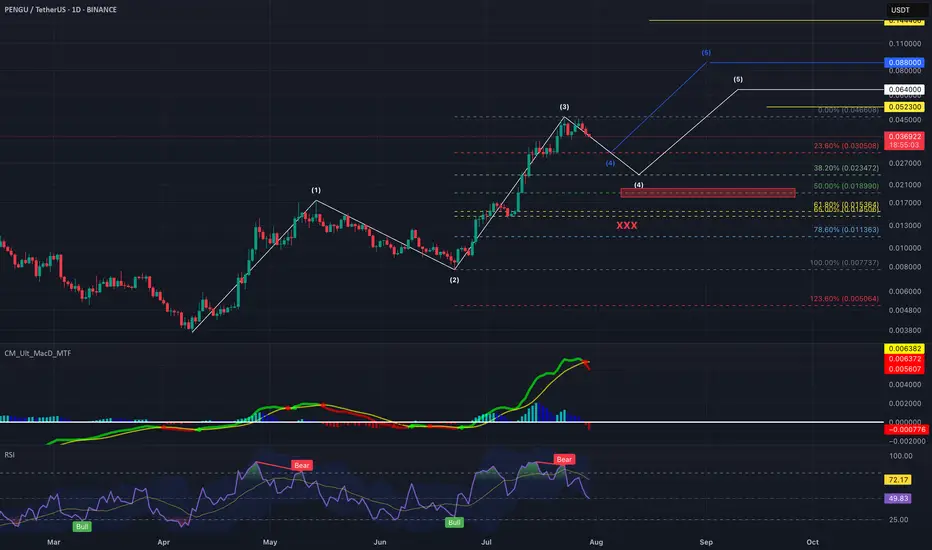
PENGU Update | Elliott Wave Cooling Before Final Push?Our original analysis anticipated this pullback and it’s playing out beautifully. Wave 3 wrapped up at 0.0466, and we’re now seeing signs of a healthy Wave 4 retracement.
Current Structure
Wave 3 completed from 0.0077 to 0.0466. Really strong wave 3.
Now retracing with:
- MACD bearish crossover
- RSI bearish divergence
And Wave 4 pullback zone is likely between 0.0305 – 0.0255 (Fib 0.236–0.382 of Wave 3)
We're now in the cool-down phase, with momentum indicators rolling over. The red box around 0.0185–0.0200 is key support. If that holds (Wave 1 high), structure remains valid for a Wave 5 extension.
Wave 5 Upside Targets are
0️⃣ $0.0438 – $0.0473 (Base case recovery)
1️⃣ $0.0523 (Typical Wave 5 projection)
2️⃣ $0.0640 (Extended Wave 5)
3️⃣ $0.0880 Parabolic (FOMO scenario, 10% chance)
Breakdown below Wave 1 invalidates the count (red box region). CSECY:PENGU has been leading the meme sector this cycle, and there’s no more "positive" news around NYSE:PUMP to drain liquidity yet. So, I believe we might actually see a shallow pullback.
This Wave 4 is likely the last dip before a clean leg up. Unless macro FUD derails the market, we expect continuation into Wave 5.
Patience is key. Let the retrace finish. Then… maybe moon. 🌝
Wave Analysis
GBPUSD H1 OUTLOOKaccording to H1 analysis GBP market is at RESISTANCE LEVEL so we have great chance to go short from RESISTANCE LEVEL dont be greedy use money management
TRADE AT YOUR OWN RISK
REGARD ALBERT

IOLCP positionally looking goodIOL CHEM AND PHARMA LTD (Weekly Chart) – Key Points
Trend:
The stock has finished a long consolidation (Wave ④) and is starting a new upward rally (Wave ⑤ expected).
Price Movement:
Current price: ₹101.47 after a recent sharp rise.
Important resistance to watch: ₹120–₹130 zone.
Momentum (RSI):
RSI at 67.59 — shows strong momentum.
Volume:
Rising volume near breakout, supporting the current price move.
Possible Scenarios:
If price breaks above ₹120–₹130 with good volume:
Likely starts a new strong rally (Wave ⑤).
Possible targets: ₹210–₹360.
If resistance holds and RSI turns overbought:
Short-term pullback or pause likely.
Support to watch: ₹90–₹100.
Summary:
The setup is bullish, but key resistance and overbought risks need monitoring before any new major upswing.


Elliott Wave Analysis – XAUUSD | July 30, 2025📊
🔍 Momentum Analysis
• D1 Timeframe: Momentum has started to reverse upward, but we need to wait for today’s daily candle to close for confirmation. Until then, there is still a risk of another short-term decline.
• H4 Timeframe: Momentum lines are clustering in the overbought zone, signaling a possible weakening of the current upward move. However, this signal alone is not enough to confirm that the uptrend has ended.
________________________________________
🌀 Wave Structure
• Price has reached the projected target for wave e, but there has been no strong bullish reaction. The recent candles are short-bodied and overlapping – typical of corrective structures. Also, this wave has lasted longer than previous corrective upswings, suggesting that the decline may not be over yet and the wave count needs to be reviewed.
Currently, we are facing two equally probable scenarios (50/50), but they suggest opposite outcomes:
➤ Scenario 1: Zigzag (5-3-5) Structure
• The current structure may represent only wave A of a larger zigzag.
• We are now in wave B, which tends to be complex and unpredictable, making it not ideal for wave-based trading.
• The red zones marked on the chart indicate potential target areas for wave B.
➤ Scenario 2: Completed 5-Wave Correction
• The downtrend may have completed at wave (e).
• The current upward movement could be wave 1 forming as a triangle – a potential start of a new bullish cycle.
• However, to confirm this scenario, price must hold above 3309. If it fails to do so and H4 momentum reverses downward, a new low is very likely.
________________________________________
📝 Trading Plan
Given the current market conditions, I only recommend short-term scalp trading based on the predefined support and resistance zones.
Avoid wave-based trading until the structure becomes clearer. Once clarity returns, I will provide an updated trading plan.

#Banknifty directions and levels for July 30th:
What can we expect today?
In the previous session, both Nifty and Bank Nifty took a solid pullback after the gap-down start.
However, neither of them broke the 38% Fibonacci level in the current swing.
So, unless the 38% level is broken, we should continue to approach the market with a bearish view.
At the same time, key parameters have been lagging recently, which has made it difficult for the market to take a clear direction.
My primary expectation is consolidation within the previous day's range.
However, if the market breaks the bottom with a solid structure, then we can expect the correction to continue.

HIMS WEEKLY TRADE IDEA (7/29/25)*
**💊 HIMS WEEKLY TRADE IDEA (7/29/25)**
**🔥 Bullish Flow + Rising RSI + Institutional Volume**
**📈 Trade Setup**
• **Stock**: \ NYSE:HIMS
• **Direction**: CALL (LONG)
• **Strike**: \$64.00
• **Entry**: \$0.92
• **Target**: \$1.38
• **Stop**: \$0.46
• **Size**: 2 contracts
• **Expiry**: Aug 1, 2025 (3DTE)
• **Confidence**: 80%
• **Entry Timing**: Market Open
---
**🧠 Why This Trade?**
✅ **Call/Put Ratio = 1.37** → Bullish sentiment
✅ **RSI Daily: 65.2 / Weekly: 61.3** → Momentum building
✅ **1.8x Weekly Volume Surge** → Institutional accumulation
✅ **\$64C OI = 2,616** → High liquidity + interest
⚠️ **Gamma Risk + Fast Decay** → Time-sensitive play
---
**🎯 Strategy**
→ Play the momentum spike into expiry
→ Exit quickly on profit target or 50% stop
**#OptionsTrading #HIMS #SwingTrade #EarningsPlay #TradingViewSetup #FlowTrade**

DXY dayly structureMay change indeed
but its pretty much what meassures and current development is showing
GG
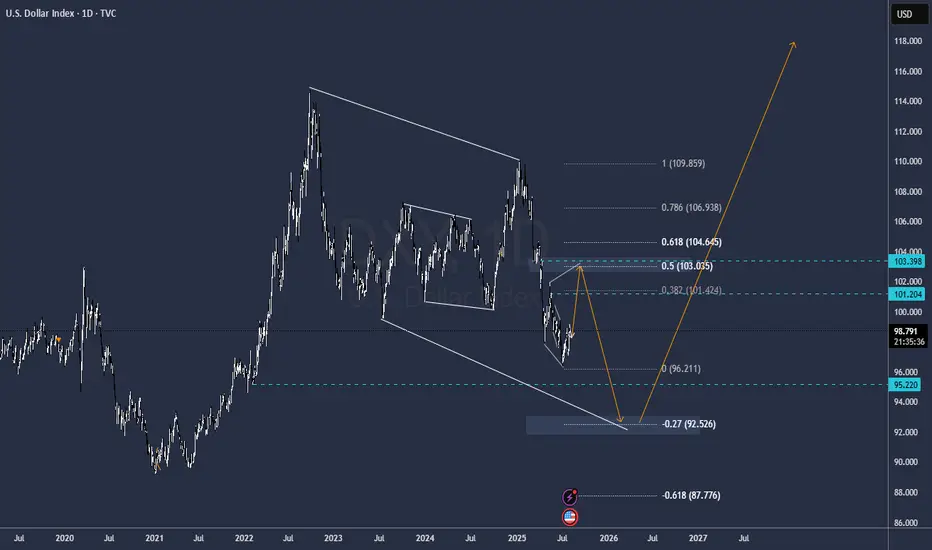
Potentially a wave 2 completing of wave 1 of 3 in wave one...06 or higher is looking like a target before the explosion. If i am correct this is on to add to your list. I will not be giving any FINANCIAL ADVICE as always.
This could go wild over the next year.
Good luck :)
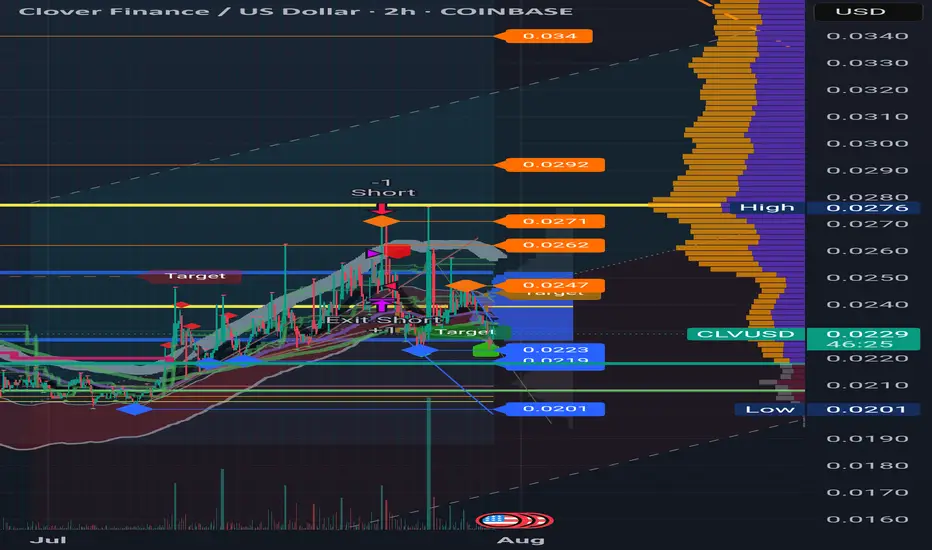
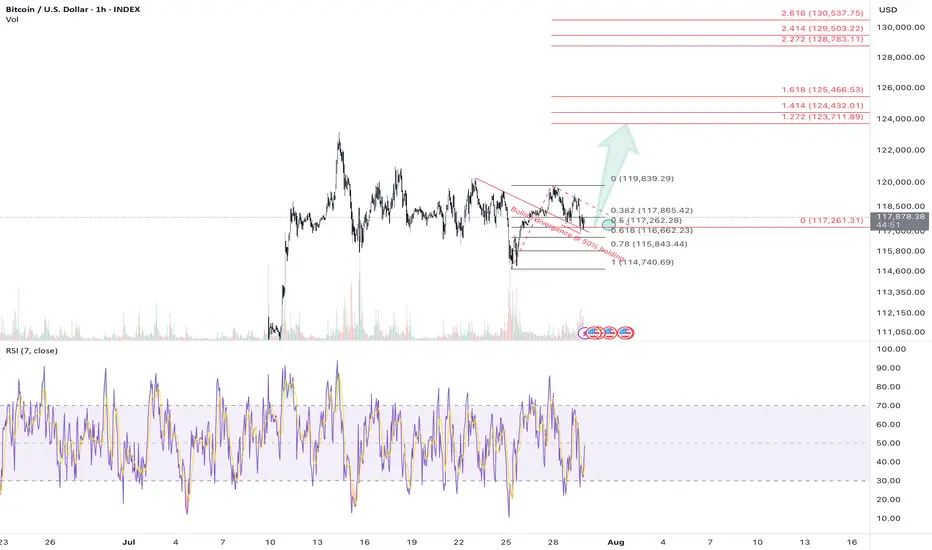
Short-term: Jump over the creek, ready for markupWhen market is in an uptrend, I look for divergence in the price as it holds 50%.
The chart as you see it pictures a perfect scenario for a trade entry, but make sure to have a stop loss set at fib retr. around 70%.
We could see the price going upwards from right here and right now.
Please note that I don't trade real money - I'm in it just for the thrills and fun.
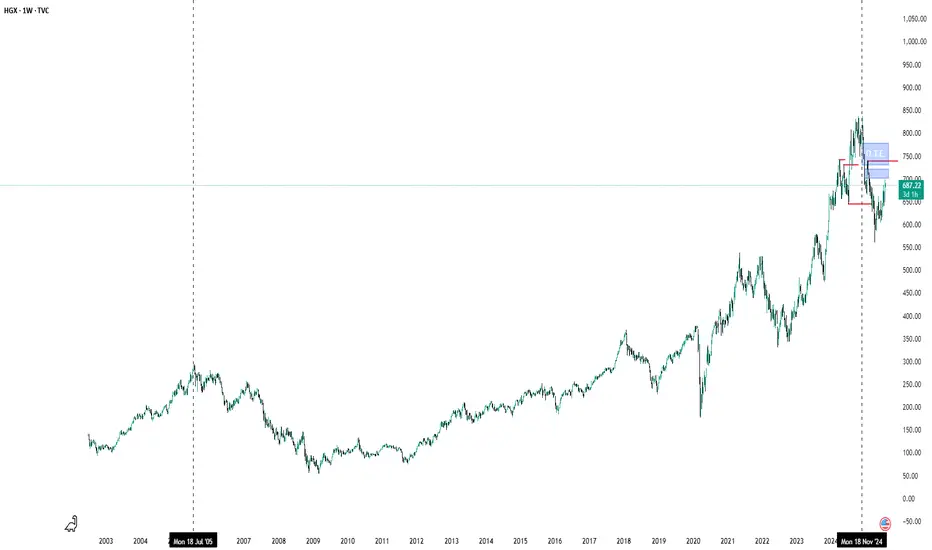
Housing Index, That There Look Identical Weak housing sector looking to return to Optimal trade Entry and then giving up the ghost.
XauUsdThere are two analyses.
As you can see, the overall trend is bullish and long positions have more chances, the important market points are drawn accurately and have high validity.
The red arrow has a 60% chance of occurring and the blue arrow has a 40% chance.
Important market points:
Resistance:
3340
3369
3390
3422
Support:
3303
3280

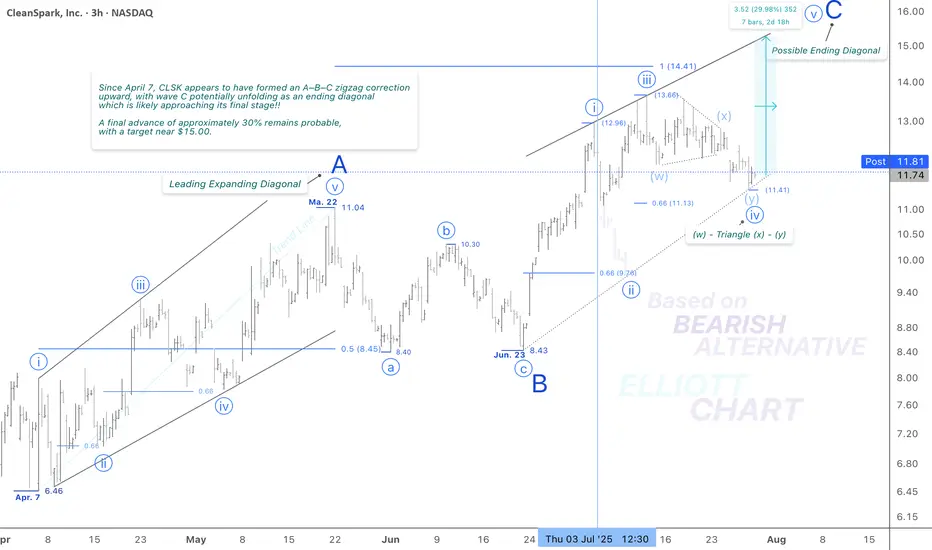
CLSK / 3hThe modest and unexpected 2.5% decline in NASDAQ:CLSK today suggests a potential shift in the wave iv (circled) corrective structure—from the previously identified to a more complex combination.
This adjustment still fits within the context of the ending diagonal pattern in Minor wave C and reflects a deeper, yet corrective, move down. The overall outlook and wave structure remain unchanged.
Wave Analysis >> As illustrated in the 3h-frame above, Minor wave C—completing the corrective upward move of wave (B)—appears to be unfolding as an ending diagonal, now likely in its final stages. Within this structure, the Minute wave iv (circled) has formed a correction. A final push higher in Minute wave v (circled) is now expected, which would complete the ending diagonal pattern of wave C, and in turn, conclude the countertrend advance of wave (B).
Trend Analysis >> Upon completion of the potential ending diagonal in Minor wave C, the broader trend is anticipated to reverse to the downside, initiating the final decline in Intermediate wave (C). This bearish phase may extend through the remainder of the year.
#CryptoStocks #CLSK #BTCMining #Bitcoin #BTC
NASDAQ:CLSK CRYPTOCAP:BTC BITSTAMP:BTCUSD MARKETSCOM:BITCOIN
GBP-JPY Rising Support! Buy!
Hello,Traders!
GBP-JPY is trading in an
Uptrend and the pair made
A retest of the rising support
And we are seeing a local
Bullish rebound and we will
Be expecting a further
Local move up
Buy!
Comment and subscribe to help us grow!
Check out other forecasts below too!
Disclosure: I am part of Trade Nation's Influencer program and receive a monthly fee for using their TradingView charts in my analysis.

DeFi’s Make-or-Break MomentThe spotlight today is on TOTALDEFI, an index that could become one of the most exciting charts in the crypto market.
While many altcoins look heavy under selling pressure, TOTALDEFI is holding firmly at the 61.8% Fibonacci support near 116B. This zone is often a turning point where strong reversals begin. If the level continues to hold, we might see a 20% move to the upside, signaling renewed strength in the DeFi sector.
This price action could be a sign that decentralized finance projects are ready to lead the next market phase.

CAKE Earnings Trade Setup (2025-07-29)
**🍰 CAKE Earnings Trade Setup (2025-07-29)**
🎯 **Bullish Bias** | Confidence: **72%**
💡 **Historical Beat Rate: 88%** | Strong pre-earnings drift
**📊 TRADE DETAILS**
• **Instrument**: \ NASDAQ:CAKE
• **Strategy**: Buy CALL
• **Strike**: 67.50
• **Entry**: \$1.45
• **Target**: \$2.90+
• **Stop**: \$0.72
• **Expiry**: 2025-08-15
• **Timing**: Pre-earnings close (AMC)
**📈 Setup Rationale:**
✅ History of positive earnings surprises
✅ Stock above key MAs with room to run
⚠️ Margin pressure & mixed options flow = manage risk closely
**🔥 Risk/Reward: \~2:1+**
Cut early if earnings miss. Target 200%+ return on surprise beat.

LC EARNINGS PLAY – STRIKE WHILE IT'S HOT!**
🚨 **LC EARNINGS PLAY – STRIKE WHILE IT'S HOT!** 🚨
📅 **Earnings Season Heat Check: LC | Jul 29**
💰 **Positioning for a Post-Earnings POP!**
---
🔥 **The Setup:**
LC’s earnings momentum is real –
📈 TTM Rev Growth: **+13.1%**
💹 EPS Surprise Rate: **150% avg**
📊 75% Beat Rate History
💵 Analyst Consensus: **Strong Buy (1.8/5)**
---
📉 **Technical Tailwind:**
✅ Price above 20D + 200D MA
✅ RSI: **60.07** – room to run
📈 Volume Spike: **+61% above 10-day avg**
🚀 Options flow targeting **\$14 CALLS** w/ OI: **864** / Vol: **737**
---
📌 **TRADE IDEA**
🎯 Buy: **\$14.00 Call @ \$0.70**
📆 Exp: **Aug 15, 2025**
🎯 Target: **\$2.10** (Risk/Reward = 1:3)
🛑 Stop: **\$0.35**
---
⚠️ **Earnings Risk:** IV crush real.
🎯 Exit within 2 hours **post-EPS** if no move.
Macro tailwinds + financial sector rotation = 🚀 fuel.
**Beta = 2.45** → Big move potential incoming!
---
🧠 Confidence Level: **75%**
⏰ Timing: Pre-Earnings Close
🧾 Model-Driven Strategy | No Hype, Just Edge.
---
💥 Let’s ride the LC earnings wave – \$15+ in sight! 💥
\#LendingClub #LC #EarningsPlay #OptionsTrading #TradingView #StocksToWatch #CallOption #Fintech #SwingTrade #EarningsHustle #BullishSetup #IVCrush #EarningsGamma #ShortTermTrade

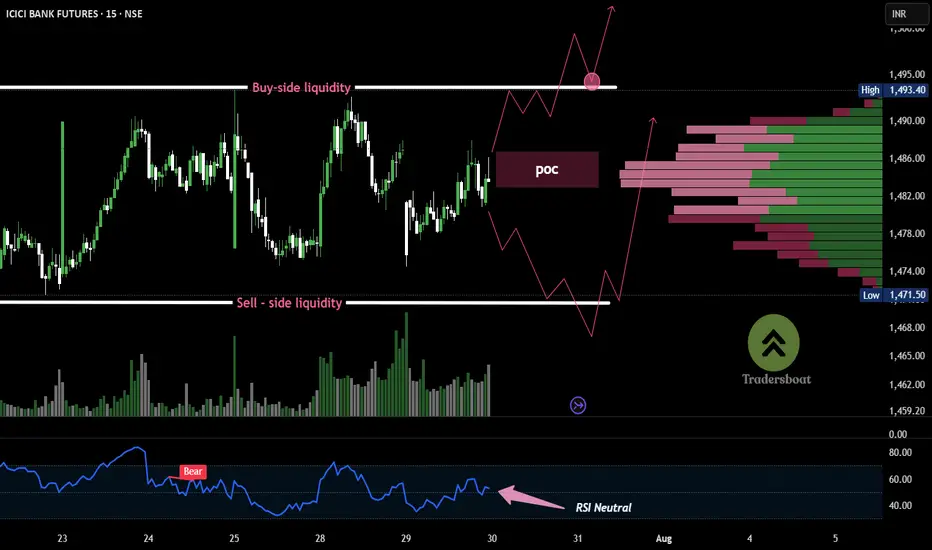
ICICI BANK -15MIN Volume bulge at ₹1485 = decision pointICICI Bank Futures is consolidating in a tight range between ₹1462 and ₹1493, building both buy-side and sell-side liquidity. This structure typically precedes a strong breakout.
The volume profile shows a concentration around ₹1484–₹1486, indicating it as a decision zone. RSI remains weak below 50, suggesting short-term bearish control, but a breakout in either direction could trigger momentum.
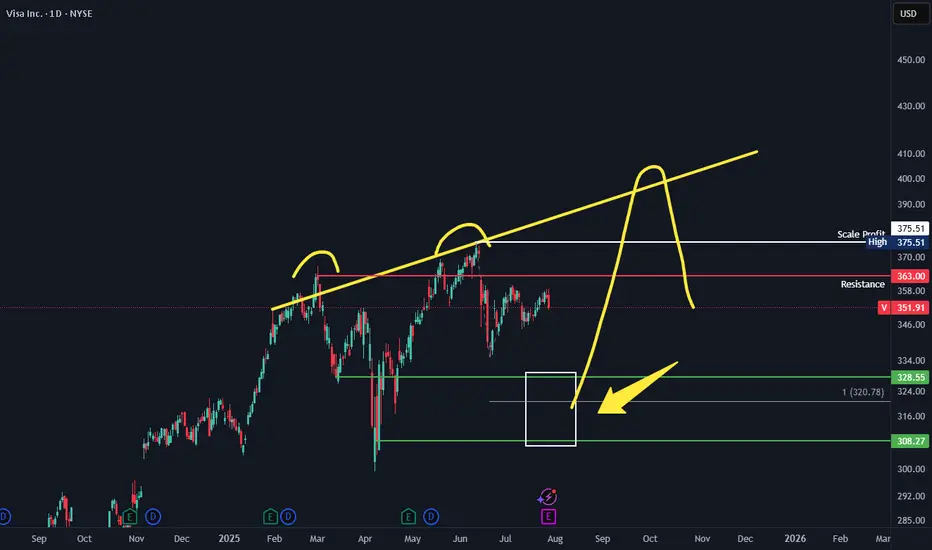
VISA 3 peaks and a dump. Should VISA pullback to the lower support zone. Look to swing long back to ATH with the big target of around 400 where 1 can look to swing short. The typical 3 peaks and a dump setup.
HBARUSWe´re in a bigger correction in HBAR and I expect a 5th wave in this correction. Right now we´re in the correction of the 4th wave and completed a ABC pattern.

SPX500 NEARING AN IMPORTANT FIB. EXTENSION RESISTANCEIn this weekend's analysis I find the SPX500 to remain BULLISH for next few days as we have strong closings outside the upper KC band and also touching the upper Bollinger band on the higher time frames from Daily to Monthly charts. It's also important to note that declining volume bars is NOT supporting the monthly rally, while MACD, RSI divergences are also sounding warning sirens that it's near a major correction territory which I have measure as the fib extension 0.618 from the October, 2022 base or support on the monthly chart. As signaled last week that we could be getting a capitulation candle soon to the fib target. Once we get a reversal candle on the 4 Hours it will confirm that the intermediate tops is achieved on the SPX500 and a correction is highly probable. So our trade thesis is Bullish until we get a confirmed bearish signal on either the 4H or 1D timeframe with Stop loss at 6377 level. Thanks for visiting my publication and trade idea on the SPX500. Cheers and happy trading to everyone.

NZDUSD: Market Sentiment & Price Action
Looking at the chart of NZDUSD right now we are seeing some interesting price action on the lower timeframes. Thus a local move up seems to be quite likely.
Disclosure: I am part of Trade Nation's Influencer program and receive a monthly fee for using their TradingView charts in my analysis.
❤️ Please, support our work with like & comment! ❤️

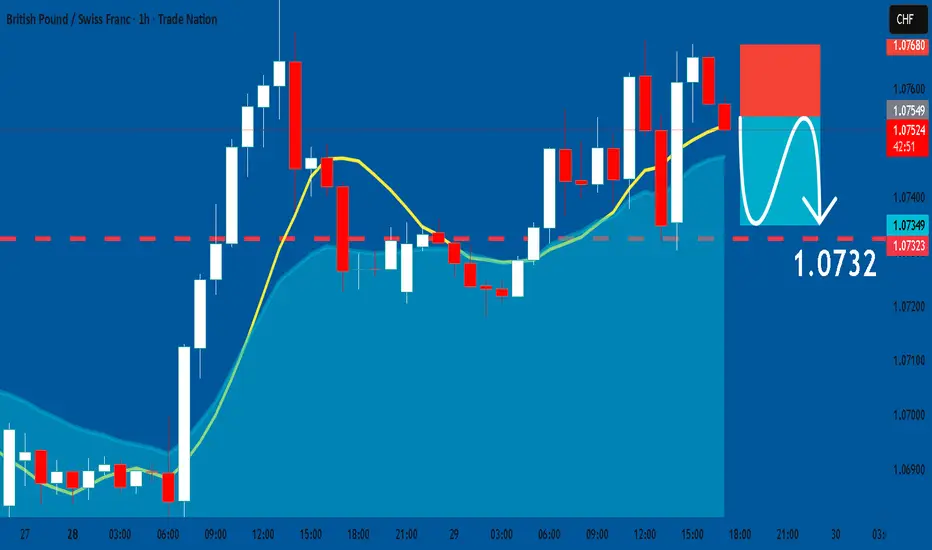
GBPCHF: Short Signal with Entry/SL/TP
GBPCHF
- Classic bearish setup
- Our team expects bearish continuation
SUGGESTED TRADE:
Swing Trade
Short GBPCHF
Entry Point - 1.0754
Stop Loss - 1.0768
Take Profit - 1.0732
Our Risk - 1%
Start protection of your profits from lower levels
Disclosure: I am part of Trade Nation's Influencer program and receive a monthly fee for using their TradingView charts in my analysis.
❤️ Please, support our work with like & comment! ❤️