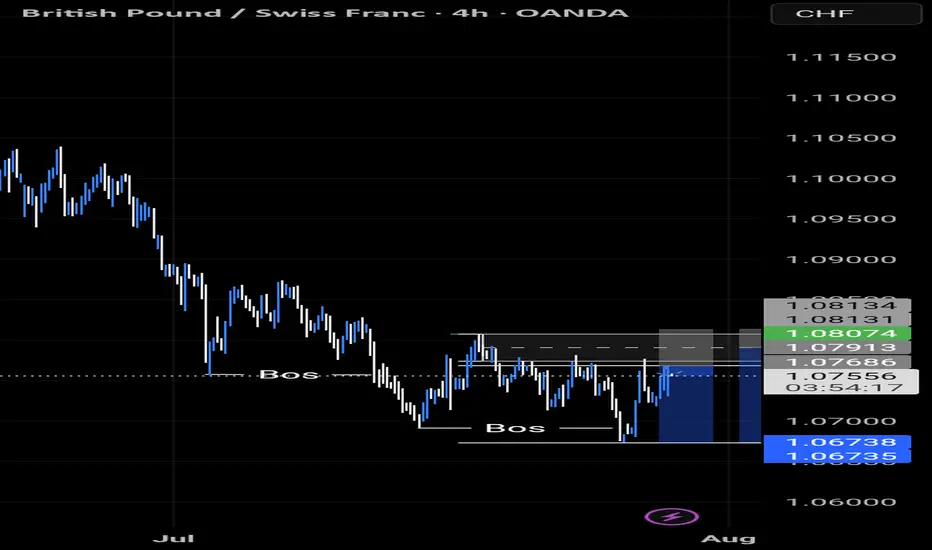
GBPCHF TRADE IDEA We're in on a downside movement on GBPCHF.
We had a pullback to our Fibonacci level and the market seems to be making a move to the downside
Wave Analysis
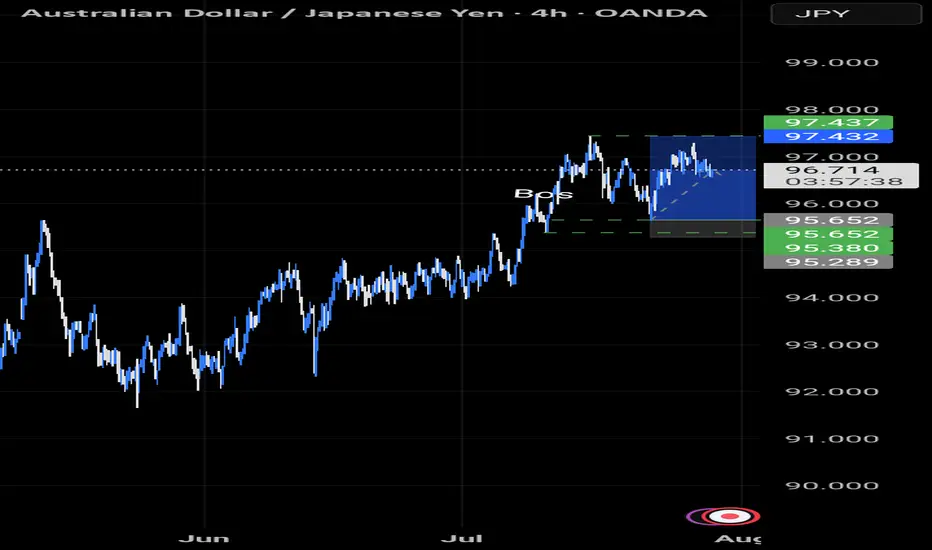
AUDJPY TRADE IDEA UPDATE AUDJPY also made a pullback to our Fibonacci level and has made a move to the upside.
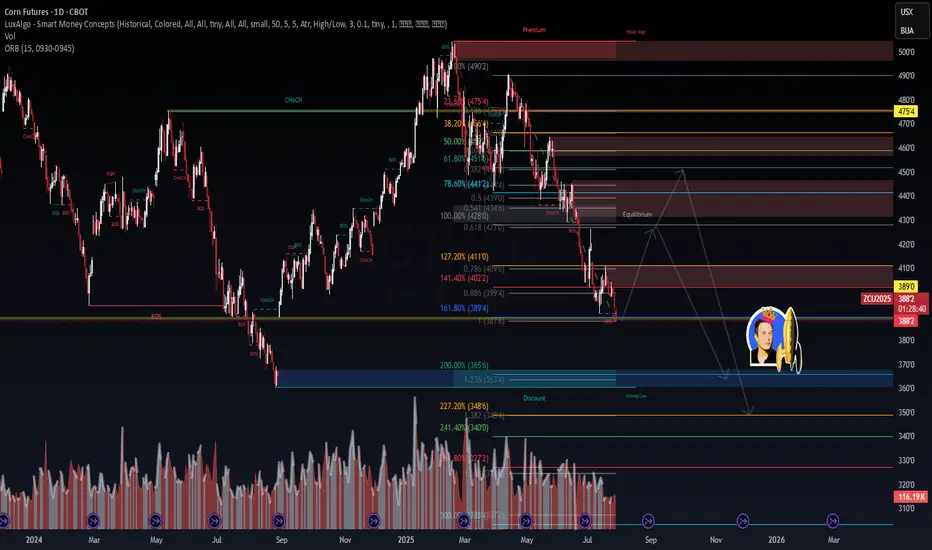
Corn Futures (ZCU2025) – Heavy Structure, Heavy Pressure📉 Corn Futures (ZCU2025) – Heavy Structure, Heavy Pressure
WaverVanir DSS shows continued downside probability in Corn as price compresses below the 0.786–1.272 fib zone and forms a supply rejection cluster near 4.10–4.27.
🧠 Macro Snapshot:
🌽 USDA WASDE (Aug 12) may revise yield upward amid favorable Midwest weather → bearish catalyst
🇧🇷 Brazil exports peaking + weak BRL = added global pressure
💵 Strong USD + elevated carry costs reduce long-side incentive
🏦 Fed tone remains hawkish → commodity bearish bias holding
🔍 Technical Breakdown:
✅ Confirmed BOS → CHoCH → Lower High confirms bearish control
📐 Fibonacci clusters align at:
🔻 TP1: 3750–3640 (1.236–200% ext)
🔻 TP2: 3480–3400 (2.27–2.41 ext + strong low confluence)
🛑 Invalidation above 4110–4140 (structural break + 1.272 retrace buffer)
🎯 Trade Setup (Short Bias)
Criteria Details
Entry Zone 3890–3880 (confirmed rejection candle)
TP1 3640 (volume/imbalance cluster)
TP2 3480 (fib confluence)
TP3 3270 (final extension)
Stop-Loss Close above 4110
Risk/Reward Targeting 3.2R at TP2
⚠️ What to Watch
📆 WASDE Aug 12
💬 CFTC Net Positioning (Fri)
🌡️ Weather swings (Corn Belt)
🧮 ZCU25 calendar spreads (ZCU25-ZCZ25)
🚀 The rocket is reserved for when fundamentals flip (e.g., yield shock, China buying). Until then, structure says one thing:
Smart money is hunting liquidity below 3640.
#ZCU2025 #CornFutures #FibStrategy #WaverVanir #VolanXProtocol #SmartMoneyConcepts #DSS #CommodityTrading #MacroAnalysis #ProbabilisticSignals #HawkishFed #SupplyChainPressure
A closer up view of SILJA slighty closer up view of my previously posted SILJ analysis. The yellow could could be off by one degree...in other words the yellow (3) might actually be the teal (3), but either way I see a major move up very very soon...by end of August >$20 imo.

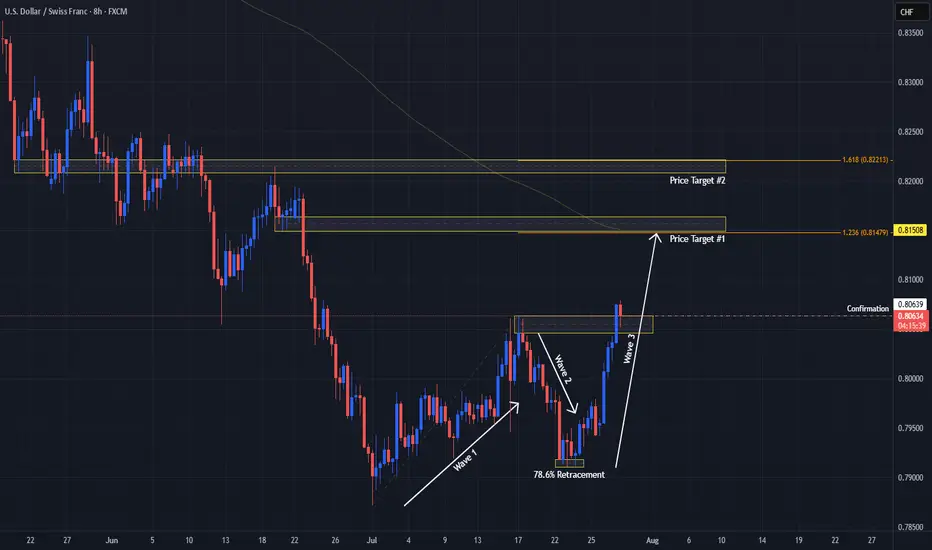
USDCHF Signals Wave 3 With Double Bottom!OANDA:USDCHF has not only formed a Double Bottom Pattern but also may be generating a potential Elliot Impulse Wave!
Bulls are giving the April & June Lows of .8038 - .8088, another go for a second time today after surpassing the first attempted High created July 17th to break above the level.
So far Price today has broken above July 17th Highs and if Bulls are able to hold this level, this would Confirm:
1) A Breakout of the Double Bottom
2) Wave 3 continuing the Impulse Wave in the Elliot Wave Theory!
The Higher Low @ .79106 created on July 25th, broke the downtrend structure as a 78.6% retracement of the Lower Low @ .78719 created July 1st which was a new 14 Year Low, finishing Wave 2 and initiating Wave 3 of the Impulse Wave.
The Extension of Wave 3 typically will end at the 1.236% or 1.618% level which gives us 2 potential Price Targets to start:
Price Target 1) .81479 - 1.236%
Price Target 2) .82213 - 1.618%
Once Wave 3 has ended, we will look for opportunities at the Wave 4 - Wave 5 juncture!
Call me crazy....but SILJ looks explosive here...In my opinion we are seeing a series of 1,2's on SILJ which are about to result in a MAJOR move to the upside. IF I am correct then we will see $20+ in very short time...by the end of August!

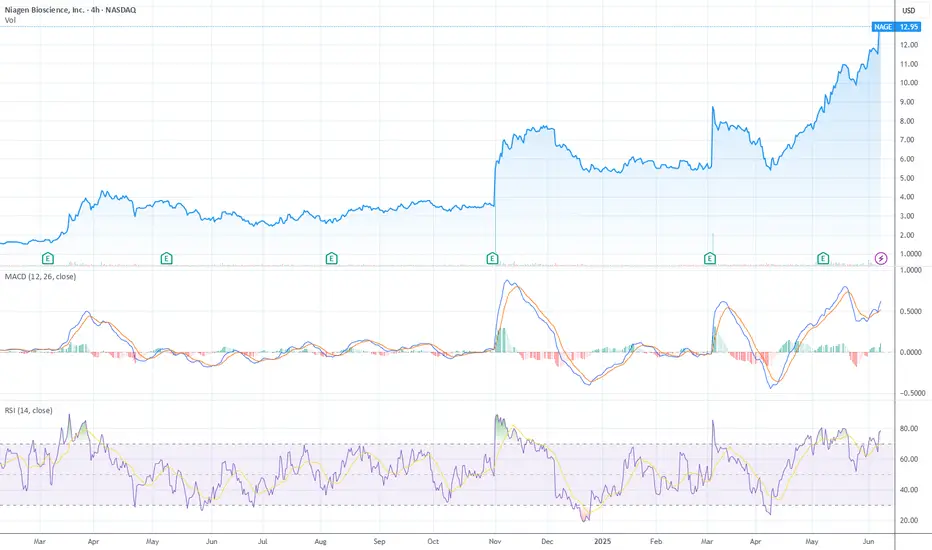
Niagen Breaks Out: Eyes on $15–17 as Momentum TargetsNiagen Bioscience ( NASDAQ:NAGE ) is in vertical price discovery mode, pushing into new highs with strong trend momentum, but with RSI at 78.66 and a flattening MACD histogram, it’s nearing a classic short-term exhaustion zone
Technical Breakdown
1. Price Action – Parabolic Advance
Price is climbing in a near-vertical channel from the $5–6 range in March to now $12.95 — a 2x+ move in just a few months. No clear resistance above = price discovery, but these steep climbs often invite sharp mean reversion when momentum fades. No signs of topping yet, but late buyers risk being exit liquidity if volume dries up.
2. RSI – Deep Overbought
RSI is at 78.66, right near the extreme threshold (>80) where pullbacks are common. Note the last RSI spike above 80 in April led to a sharp correction. If RSI rolls while price makes new highs, that’s bearish divergence risk — an early signal of topping.
3. MACD – Still Positive, But Slowing
MACD lines are bullishly stacked, but the histogram is flattening — a signal that momentum is stalling. A bearish MACD crossover here would confirm that this rally leg is losing energy.
4. Volume – Watch Closely
Volume data is light on this chart, but recent candles don’t show a volume climax — suggesting this may not be euphoric yet, but it’s close. One high-volume reversal candle near the top could flip sentiment fast.
Fibonacci Extension Setup
We'll anchor the extension to the March 2025 low and the recent pre-breakout high, using the most relevant and aggressive up-leg:
Swing low: ~$5.00 (March 2025)
Swing high: ~$11.50 (May 2025)
Pullback low: ~$9.00 (early May dip before this new breakout)
Extension Targets
1.0x $11.50 Already cleared (prior high)
1.272 $13.25–13.50 Short-term upside target, within reach
1.618 $15.00–15.25 Primary extension / high-conviction zone
2.0 $17.00 Stretch target in euphoric continuation
These levels line up well with psychological round numbers and the measured strength of the rally.
What Would Validate These Targets?
RSI stays above 65–70 (healthy overbought, not divergent)
MACD avoids bearish crossover and histogram turns back up
Breakout continuation above $13.25 with volume
What Would Invalidate?
Sharp rejection from $13.25 or $14 with divergence
RSI dropping below 65 while price stalls
Bearish MACD crossover + red candle volume spike
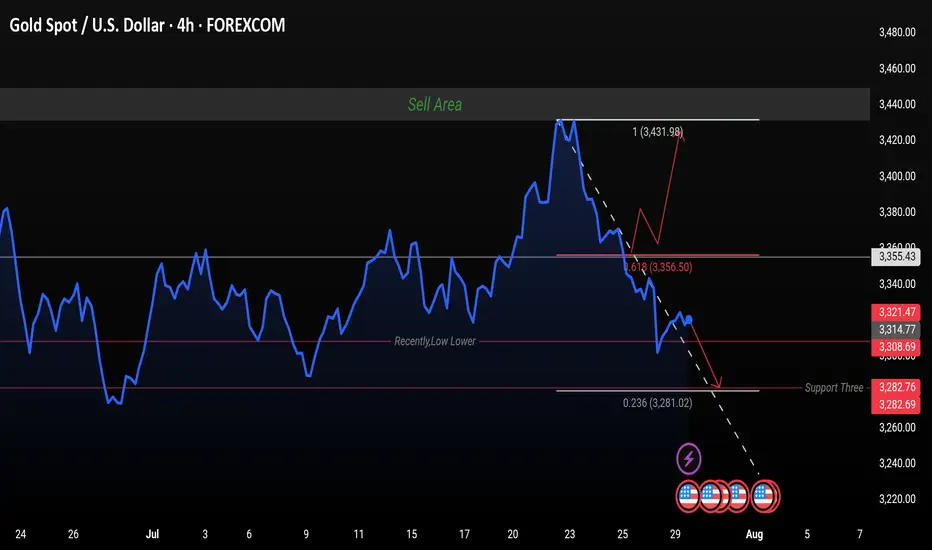
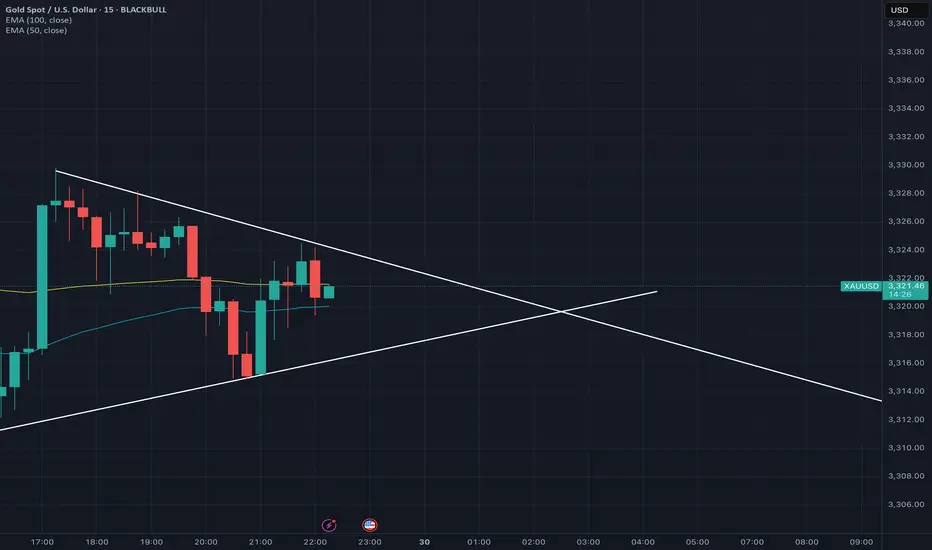
H4 Analysis. It's sell or buy let's see?
Gold is currently trading near 3323 after a recent sharp drop from the 3431 high. The price is respecting the downtrend line and has tested the 0.236 Fibonacci retracement at 3281 as support.
📉 Bearish Outlook:
If the price fails to break above 3314–3325, we could see a continuation toward the 3282 and possibly 3281 support zone.
📈 Bullish Scenario:
A break and close above 3355 (Fib 0.618) could push the market toward the 3431 resistance zone (Sell Area).
Key Levels to Watch:
Resistance: 3355 / 3431
Support: 3314 / 3308 / 3282
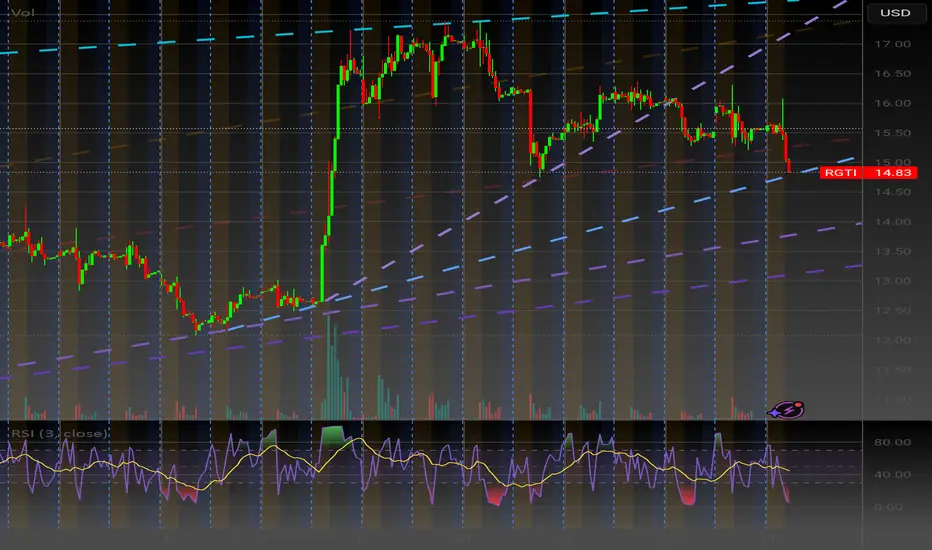
Chapter 3: The Big Gap Fill (RGTI) Chapter 3: The Big Gap Fill
After the luminous victory of the Alienoid Bulls in Chapter 1, the quantum lattice began to warp. Unbeknownst to them, the Mech Bears had not been defeated—only waiting, recalibrating, and evolving.
Hidden in the deep recesses of the 7D stackspace, a new war protocol had been activated: Project GAP-FILL.
Forged from the remnants of collapsed timelines and corrupted trading algorithms, the Mech Bears returned with upgraded plasma scythes, vortex cannons, and distortion shields—engineered specifically to slice through fractal bullish momentum.
Their mission: rupture the vertical trajectory of the Bulls by targeting the exposed gap at $14.87 .
And they struck with precision.
The plasma walls cracked. Alienoid defenders were torn apart, pixel by pixel. Charts trembled. RSI indicators bled below the midline. Volume spikes echoed like sirens through algorithmic space.
The Bulls fought valiantly, but their entangled rally code had become predictable. Their once-pristine yellow pathways had begun to fade under the purple-fanged teeth of the Bears' synthetic sell walls.
$14.87 was now no longer just a price—it was a battlefield scar.
It pulsed in red, flickering like a dying star, as algorithms calculated:
→ Bounce? An emergency quantum surge from sector Theta-12 might catch the fall.
→ Or further dip? Toward the gravitational pull at $13.80... or even deeper, toward the haunted zone beneath $12.60.
Whispers from the quantum feed rippled across timelines:
“If the Bulls can't re-stabilize above $14.87, the mech horde will breach the next support sector.”
The volume candles crackled, RSI skidded down through 30, and the future became uncertain.
The Alienoid Bulls retreated to regroup, wounded but not broken, preparing for what many called…
The Great Reversal War. NASDAQ:RGTI
BTCUSD Lower Time Frame WavesBase on Wave Analysis BTC is going up to hit 122-124 K area before and then start to fall to 110-112 K area to finish the correction phase

Weekly trading plan for SolanaLast week BINANCE:SOLUSDT played out perfectly according to our orange scenario. Currently, we're in a correction phase, trading below the key weekly reversal level at $190
Key Observations:
Bullish divergence forming on the hourly chart
But 4-hour chart shows further downside potential
Critical Levels:
Break above weekly pivot + trendline → Targets $220
Failure to reclaim above hourly MAs → Opens path to $160
Trade carefully - this could go either way

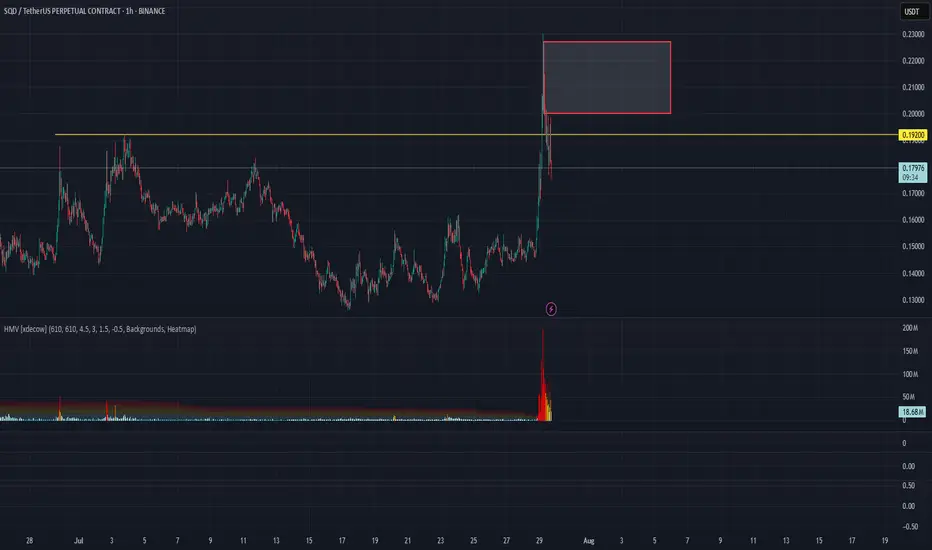
SQD/USDT Analysis — False Breakout
This token attempted to break out of a global sideways range, but failed to hold above the key level. A large amount of position closing was observed at that moment.
We are considering a short from the $0.205–$0.227 zone, provided it is retested with a clear reaction.
This publication is not financial advice.
Analysis on the 10 Elite PairsYou can follow us for more Analysis(Images and Videos) with Precise definition of the Financial Market.ENJOY!!!

Weekly trading plan for EthereumLast week's BINANCE:ETHUSDT price action performed perfectly according to our scenarios - hitting our first target and establishing a new local high. Currently, price remains above the weekly reversal level at $3,751, maintaining potential for an advance toward Resistance #2.
Key Considerations:
While above $3,751 → Resistance #2 remains in play
Break below reversal level + trendline → Likely retest of last week's low
Such breakdown would likely breach both primary support levels
Trade Plan:
Bulls: Watch for continuation above $3,751
Bears: Require confirmed break of trendline + reversal level
As always, confirmation is key - trade the breaks, not the anticipations

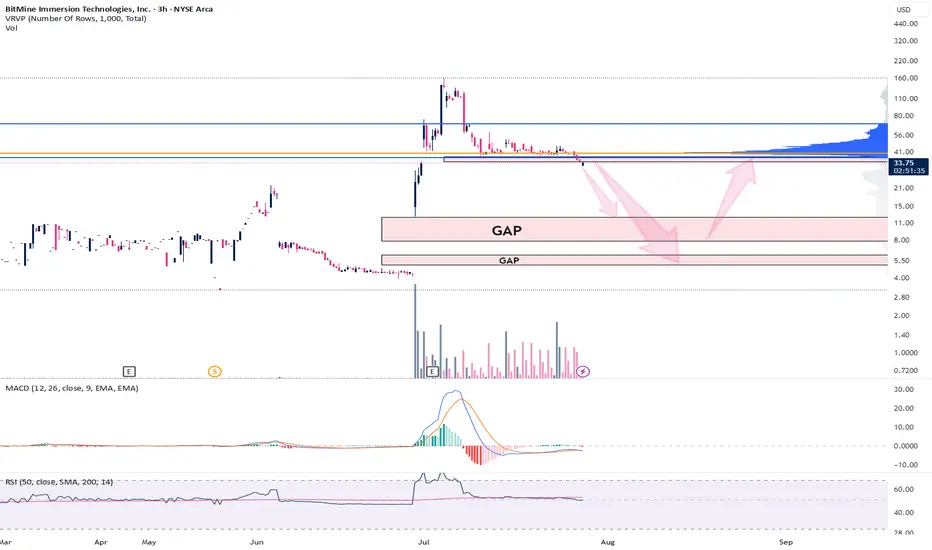
BMNR - Gaps to fill before lift offAMEX:BMNR is in competition to become the single largest ETH treasury globally with a slightly different twist - staking for a 2-5% annual return + performance.
Just like NASDAQ:SBET , AMEX:BMNR are diluting their stock to raise capital to additional purchases. This was announced a couple of weeks ago and has not yet concluded.
I expect the gaps to be filled before it really takes off.
Ideally the first gap completes at $7.92 which would be a perfect 61.8 fib retracement (EWT Target), however, if we go this low, I naturally would expect the lower gap to be taken out or at least entered.
Lower gap: $5.10 to $6.13
Higher gap: $7.92 to $12.30
If this plays out, it will be a generational buying opportunity. Like buying NASDAQ:MSTR at $11.
Cathie Wood ( CBOE:ARKK ) also made large purchases of this stock via several of her ETF's. If we follow her trend of poor buying decisions from a technical perspective, then we can certainly expect a large discount on this stock. History has a tenancy of repeating itself.
Not financial advice.
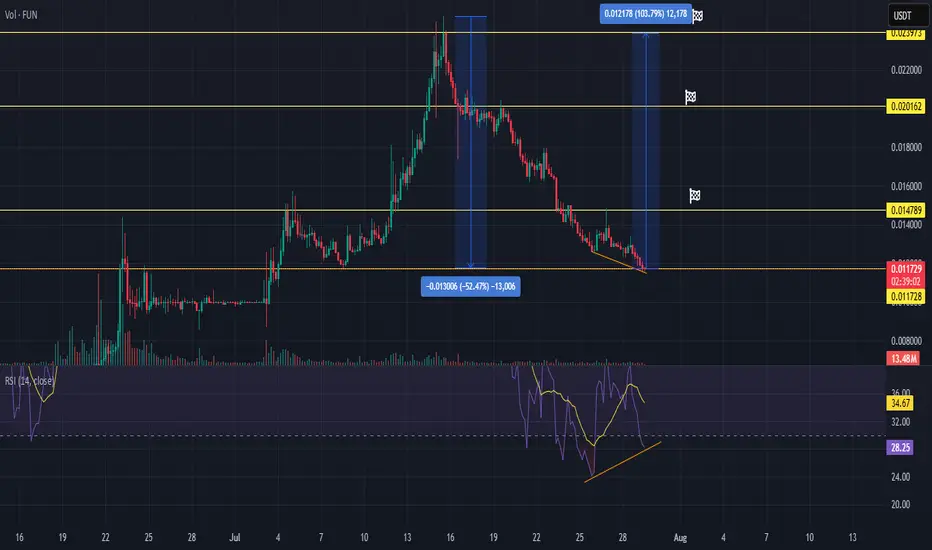
FUNUSDT reversal set-uphi Traders,
We can see Bullish Signals Developing
Bullish Divergence (RSI):
A clear bullish divergence is visible between the RSI and price action. While the price made lower lows, the RSI formed higher lows (28.35 vs. previous 24 region), indicating a potential loss of bearish momentum and the emergence of buying pressure at lower levels.
Oversold RSI:
The RSI is recovering from oversold conditions and is currently around 34.68, showing that the asset may be primed for a short-term rebound.
🟡 Key Support Zone: Previous Resistance Flip
The current price action is retesting a previous top (~0.01172 USDT) from mid-July, which now acts as support.
This level previously acted as a breakout zone during the upward rally and is a logical area where buyers may step in again.
If this support holds, it increases the probability of a reversal or consolidation phase.
📊 Potential Reversal Targets
First Target: 0.01478 USDT (mid-range resistance)
Second Target: 0.01600 USDT
Third Target: 0.02016 USDT (strong resistance from recent top consolidation)
📉 Risk Management
A daily close below 0.01170 would invalidate the bullish setup, indicating possible continuation of the downtrend.
Volume remains moderate (13.43M), so confirmation via bullish candle and volume pickup is ideal.
✅ Conclusion:
FUN/USDT is showing early signs of a potential bullish reversal, backed by RSI divergence and a retest of prior resistance now acting as support. Traders may consider this a watchlist candidate for a bounce setup, with well-defined invalidation and targets.
Is Gold having Correction before dumping?It's a pretty hot topic at the moment where the Gold is moving toward and what it will eventually become... Side way wedge like this. what do you think?
SARO Buy/LongTechnical analysis of the company. According to financial indicators, the company is currently undervalued and is supported by SMA200. The target price for the company is $35.

Today's Gold Price: Short at HighsToday's Gold Price: Short at Highs
As shown in the chart:
Rebound Short Strategy
Resistance: 3330-3350
Support: 3310
Technical Analysis:
1: As long as the gold price is below 3330, the market is bearish.
2: As long as the gold price is below 3350, the market is short.
3: As long as the gold price is above 3300, the long position is to buy on dips.
Specific Strategy:
Aggressive Strategy:
Sell: 3325-3330
Stop Loss: 3335
Target Price: 3310
Conservative Strategy:
Sell: 3340-3350
Stop Loss: 3355
Target Price: 3330-3310
Bottom Picking Strategy:
Buy: 3300-3310
Stop Loss: 3290
Target Price: 3350+/3400+


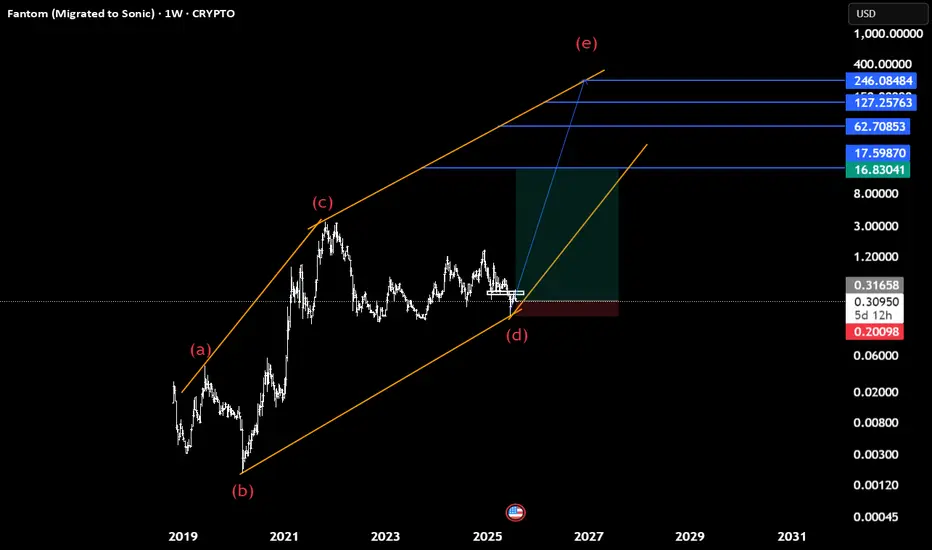
Sonic(based on NEo wave)Soon Sonic will start heavy bullish waves to the targets which shown with blue lines.
95% it is a diamnod diametric and we cant consider this as descending triangle because there is no overlap between wave d and a.
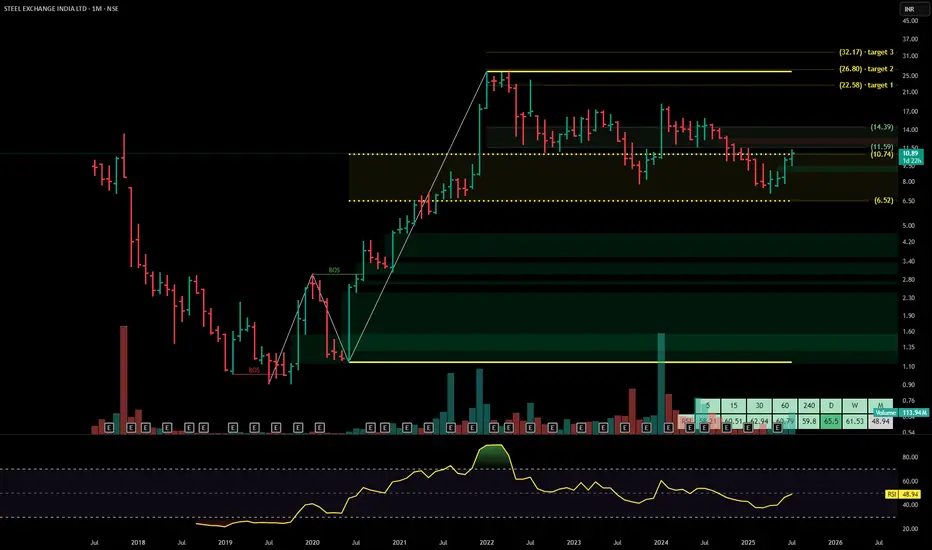
SSTEEL EXCHANGE INDIA Steel Exchange India Ltd. is a mid-sized integrated steel manufacturer, producing billets, TMT bars, and structural steel. The company operates across Andhra Pradesh with backward integration through captive power and sponge iron capacity. It serves construction, infrastructure, and industrial clients through its Vizag Steel vertical. The stock is currently trading at ₹10.89.
Steel Exchange India Ltd. – FY22–FY25 Snapshot
Sales – ₹814 Cr → ₹860 Cr → ₹918 Cr → ₹982 Cr – Gradual expansion driven by volume growth and demand
Net Profit – ₹39.6 Cr → ₹45.3 Cr → ₹50.6 Cr → ₹56.4 Cr – Steady earnings growth through efficiency and pricing Company Order Book – Moderate → Strong → Strong → Strong – Consistent inflow from infra-linked segments Dividend Yield (%) – 0.00% → 0.00% → 0.00% → 0.00% – No payouts, reinvestment-focused strategy
Operating Performance – Moderate → Strong → Strong → Strong – Margin stability supported by captive power Equity Capital – ₹53.68 Cr (constant) – No dilution, lean capital base
Total Debt – ₹190 Cr → ₹180 Cr → ₹168 Cr → ₹155 Cr – Controlled deleveraging from operational cash flows
Total Liabilities – ₹310 Cr → ₹325 Cr → ₹340 Cr → ₹356 Cr – Scaling modestly with demand
Fixed Assets – ₹145 Cr → ₹153 Cr → ₹160 Cr → ₹168 Cr – Capex directed toward plant modernization and efficiency upgrades
Latest Highlights FY25 net profit rose 11.5% YoY to ₹56.4 Cr; revenue increased 7.0% to ₹982 Cr EPS: ₹1.05 | EBITDA Margin: 14.9% | Net Margin: 5.74% Return on Equity: 12.34% | Return on Assets: 9.81% Promoter holding: 59.44% | Dividend Yield: 0.00% Operational efficiency gains from captive power and logistics optimization Rural infra and housing demand driving uptick in TMT segment volumes
Institutional Interest & Ownership Trends Promoter holding remains stable at 59.44% with no pledging or dilution. FII interest is minimal given the mid-cap profile, while HNI accumulation is visible across recent delivery spikes. Institutional exposure remains niche, centered around infra-allocation and value opportunities in commodity-linked verticals.
Business Growth Verdict Yes, Steel Exchange India is growing steadily across core product lines Margins supported by integration and volume expansion Debt is declining steadily with earnings momentum Capex remains efficient and supports operational improvement
Company Guidance Management projects single-digit revenue growth in FY26 driven by product mix enhancement and improved capacity utilization. Margin profile expected to remain consistent due to backward integration and demand visibility from infrastructure.
Final Investment Verdict Steel Exchange India Ltd. presents a modest yet efficient growth story in India’s steel sector. Its improving margin profile, steady earnings, and conservative capital structure make it suitable for gradual accumulation. The company’s core focus on integrated operations and infra-led volumes provides a base for value creation, appealing to investors seeking mid-cap manufacturing exposure in commodity-driven sectors.