Wave Analysis

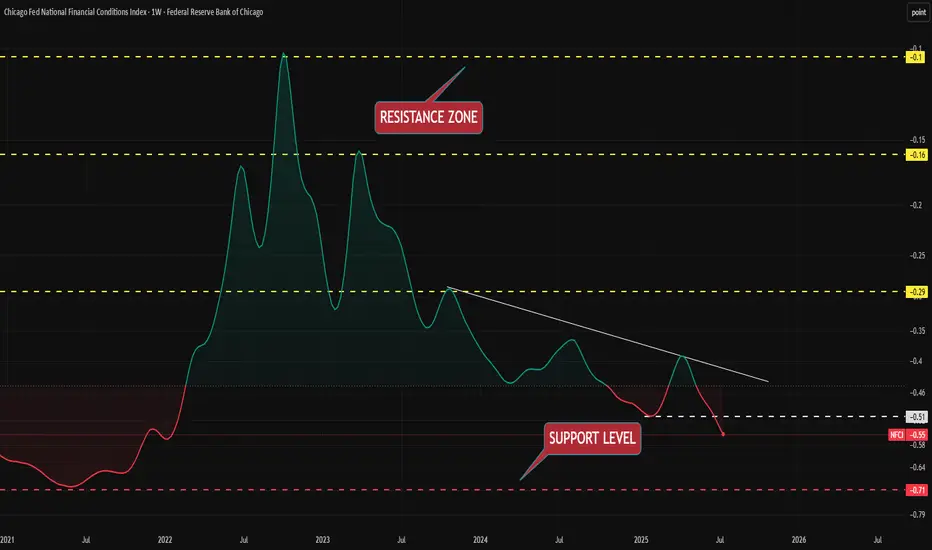
Possibility of uptrend As long as the indicator is above the green resistance zone and the resistance trend line is not consolidated, the continuation of the downtrend is likely. If the strong indicator breaks through the mentioned resistance zone, a long-term uptrend will be formed.
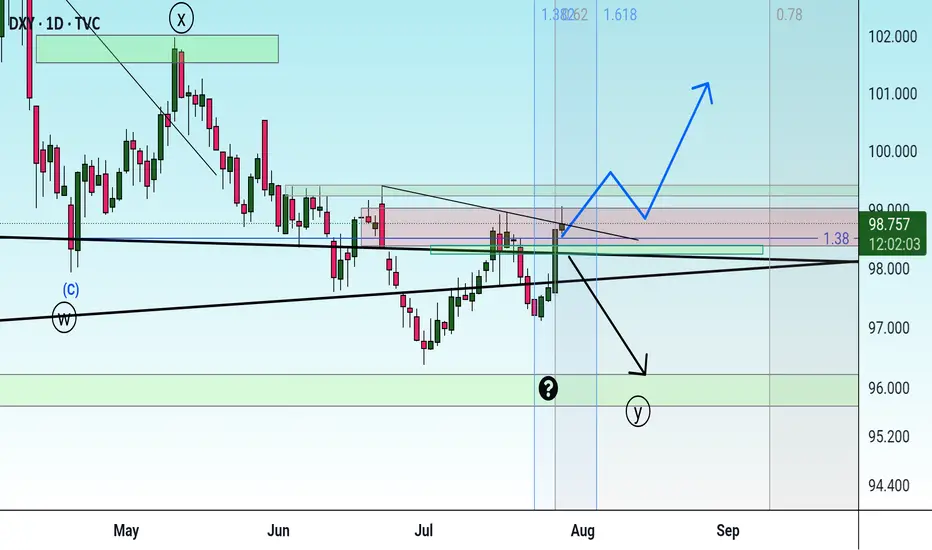
Check the trend Given that there is a possibility of a triangle pattern forming, it is expected that the price will change direction at the current resistance level and a downtrend will begin. If the price consolidates above the green resistance level, the uptrend will likely continue.

Possibility of correction As long as the price fluctuates above the support trend line, the continuation of the uptrend is likely. If the price crosses the support trend line, it will be a confirmation of the downtrend and the start of a downtrend or correction is likely.
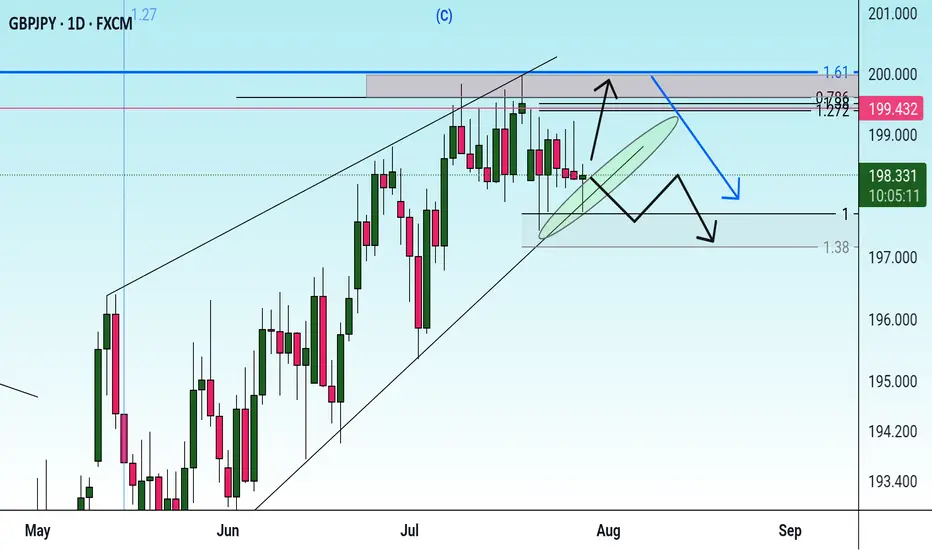
Downtrend If the price can break through the support trend line, a continuation of the downtrend to the support levels is likely. Otherwise, an uptrend is possible with consolidation above the support level.

Check the trend Given the price behavior within the current resistance range, possible scenarios have been identified. It is expected that after some volatility and correction, we will see a continuation of the upward trend.

correction The corrective pattern is expected to move along the specified path and, after reaching the time frame, a trend change is expected to occur.

GBPCAD waiting to shortbased on daily candle closed yesterday, i'm expecting another bearish move today.
i'm marked the possible resistant area and waiting lower timeframe to do reversal pattern.
calculate your own risk & reward.
Good luck

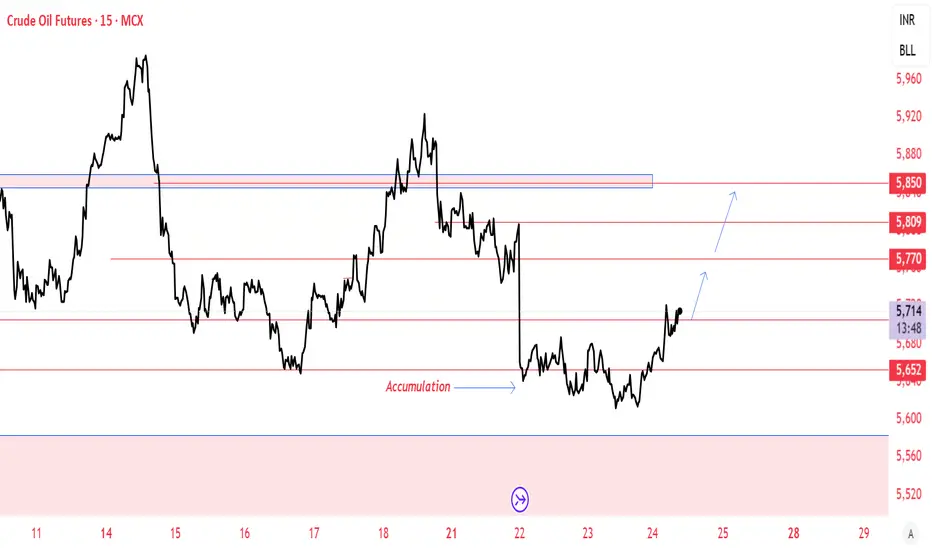
Crudeoil MCX - Bullish ViewAccumulation Happened Near Support. May see 5800-5820 after drift fall.
Please do your own research before taking any trading decisions
EURAUD Long - Pullback from Monthly Support - Easy MoneyOANDA:EURAUD Long Trade.
EURUSD is Bouncing Back from Monthly Support.
Note: Manage your risk yourself, its risky trade, see how much your can risk yourself on this trade.
Don't be greedy.
Use proper risk management
Looks like good trade.
Lets monitor.
Use proper risk management.
Disclaimer: only idea, not advice

AUDJPY Long TradeOANDA:AUDJPY Long Trade.
Entry price is already tapped in, I checked chart late, TP is intact, you can take little risk if you can afford.
Note: Manage your risk yourself, its risky trade, see how much your can risk yourself on this trade.
Don't be greedy.
Use proper risk management
Looks like good trade.
Lets monitor.
Use proper risk management.
Disclaimer: only idea, not advice

SILVER Will Grow! Buy!
Please, check our technical outlook for SILVER.
Time Frame: 8h
Current Trend: Bullish
Sentiment: Oversold (based on 7-period RSI)
Forecast: Bullish
The market is approaching a significant support area 3,817.6.
The underlined horizontal cluster clearly indicates a highly probable bullish movement with target 3,930.1 level.
P.S
The term oversold refers to a condition where an asset has traded lower in price and has the potential for a price bounce.
Overbought refers to market scenarios where the instrument is traded considerably higher than its fair value. Overvaluation is caused by market sentiments when there is positive news.
Disclosure: I am part of Trade Nation's Influencer program and receive a monthly fee for using their TradingView charts in my analysis.
Like and subscribe and comment my ideas if you enjoy them!

CYBER/USDT – Re-Accumulation Near CompletionCYBER/USDT is nearing the end of a clear re-accumulation phase, marked by steady consolidation and higher low formations. The structure suggests that smart money has been loading in, preparing for the next major leg upward.
Price action is tightening, and momentum is shifting—indicating a potential breakout from the range. Given the current setup and market context, there is high potential for a move that could double from current levels, especially if volume confirms the breakout.

AUDJPY Will Go Lower! Sell!
Take a look at our analysis for AUDJPY.
Time Frame: 9h
Current Trend: Bearish
Sentiment: Overbought (based on 7-period RSI)
Forecast: Bearish
The price is testing a key resistance 96.734.
Taking into consideration the current market trend & overbought RSI, chances will be high to see a bearish movement to the downside at least to 96.102 level.
P.S
Overbought describes a period of time where there has been a significant and consistent upward move in price over a period of time without much pullback.
Disclosure: I am part of Trade Nation's Influencer program and receive a monthly fee for using their TradingView charts in my analysis.
Like and subscribe and comment my ideas if you enjoy them!

GBPCAD Will Go Down! Short!
Please, check our technical outlook for GBPCAD.
Time Frame: 1D
Current Trend: Bearish
Sentiment: Overbought (based on 7-period RSI)
Forecast: Bearish
The market is trading around a solid horizontal structure 1.833.
The above observations make me that the market will inevitably achieve 1.813 level.
P.S
Please, note that an oversold/overbought condition can last for a long time, and therefore being oversold/overbought doesn't mean a price rally will come soon, or at all.
Disclosure: I am part of Trade Nation's Influencer program and receive a monthly fee for using their TradingView charts in my analysis.
Like and subscribe and comment my ideas if you enjoy them!

DOTUSD – Bottom Bounce or Trap?DOT dropped hard through $4.13 and 200 SMA but found strong buyers near $3.91. It’s now rebounding with decent RSI momentum, pushing toward $4.08. If this strength holds and price breaks $4.09, a move to $4.13 is possible. But failure to reclaim $4.09 might cap this as just a lower high.

BNBUSD – Holding Flat, But HeavyBNB has been grinding sideways, unable to reclaim above $830–$835. Price is compressing around the 200 SMA with weakening RSI momentum. Structure remains choppy with lower highs. Bulls need a close above $832–$835 to revive momentum, or this likely rolls lower to $815 again.

AUD/USD another leg up before down anticipatedroad map plotted. just entered bullish trade for a small leg up. SL to be moved to breakeven. anticipating a generous leg ABC leg down anytime as approaching upper blue trendline forming a ascending triangle. keep an eye out for refersal signals

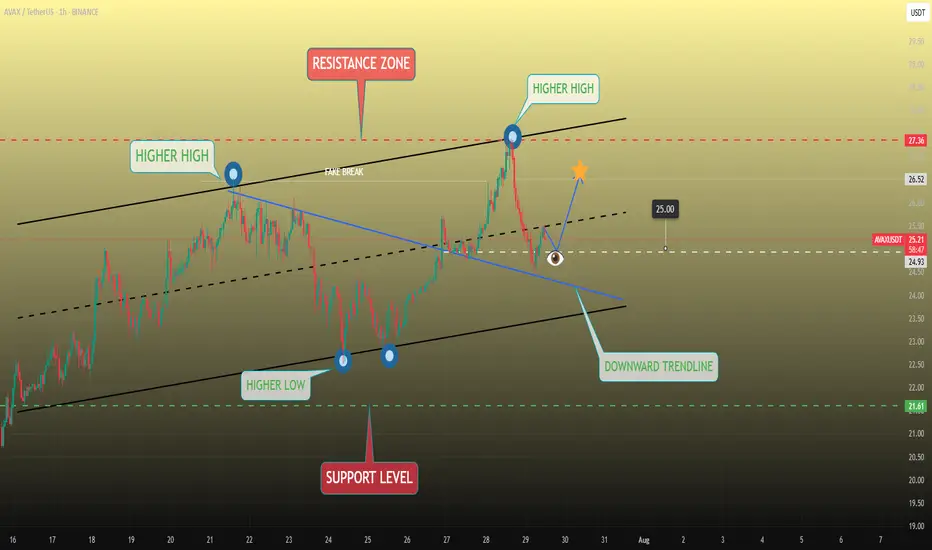
AVAXUSDT Corrective Move In The MarketAVAXUSDT
retraced sharply from the 27.34 resistance zone after making a higher high but found support above the descending trendline. The recent corrective move has paused at a key structure level near 24.96, hinting at potential bullish continuation. A breakout above this local resistance could trigger a rally toward the 26.50–27.34 target zone. Momentum builds as long as price remains above the trendline and higher low structure.
📈 Key Levels
Buy zone: 24.80 – 25.30
Buy trigger: Break and hold above 25.30
Target: 26.50
Invalidation: Close below 24.00
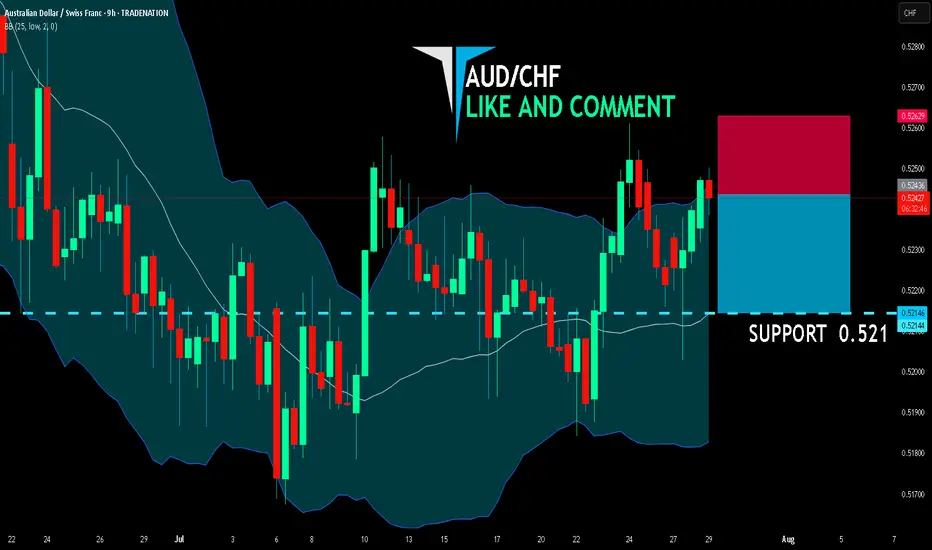
AUD/CHF BEARS ARE STRONG HERE|SHORT
AUD/CHF SIGNAL
Trade Direction: short
Entry Level: 0.524
Target Level: 0.521
Stop Loss: 0.526
RISK PROFILE
Risk level: medium
Suggested risk: 1%
Timeframe: 9h
Disclosure: I am part of Trade Nation's Influencer program and receive a monthly fee for using their TradingView charts in my analysis.
✅LIKE AND COMMENT MY IDEAS✅
NZD/CHF SHORT FROM RESISTANCE
Hello, Friends!
NZD/CHF pair is trading in a local uptrend which we know by looking at the previous 1W candle which is green. On the 12H timeframe the pair is going up too. The pair is overbought because the price is close to the upper band of the BB indicator. So we are looking to sell the pair with the upper BB line acting as resistance. The next target is 0.473 area.
Disclosure: I am part of Trade Nation's Influencer program and receive a monthly fee for using their TradingView charts in my analysis.
✅LIKE AND COMMENT MY IDEAS✅

Symmetrical Triangle (ABCDE)Chart Pattern Overview:
Symmetrical Triangle (ABCDE):
You’ve drawn a classic ABCDE contracting triangle. The E wave seems completed, and now BTC is testing the upper resistance of the triangle.
Key Resistance Breakout Point:
The yellow descending trendline (currently around $119,000) is the immediate breakout point.
Target Upside:
If the breakout is confirmed, your projected target is around $125,800.
Critical Support Zones:
$117,051 — Critical Support to Hold (Triangle support).
$114,574 - $114,183 — Strong horizontal demand zone (EMA Cross region).
$111,778 — Major liquidity zone — must not break for bullish continuation.
Volume is relatively low during the E wave, which is typical before a breakout.
A spike in volume upon breakout of $119,000 would confirm bullish momentum.
Target Projection After Breakout:
Breakout Target Zone: $123,200 - $125,800.
First hurdle at $123,181.
Final wave target projected near $125,800 (C label).
FOR MORE DETAIL SUPORT FREE JOIN MY COMMUNITY
FOR THAT JUST MSG HERE AND I WILL SHARE DETAILS.

NFCI index for detecting ALT seasonThe NFCI index for identifying ALT season is one of several indDEX derived from, among others, the Federal Reserve interest rate.