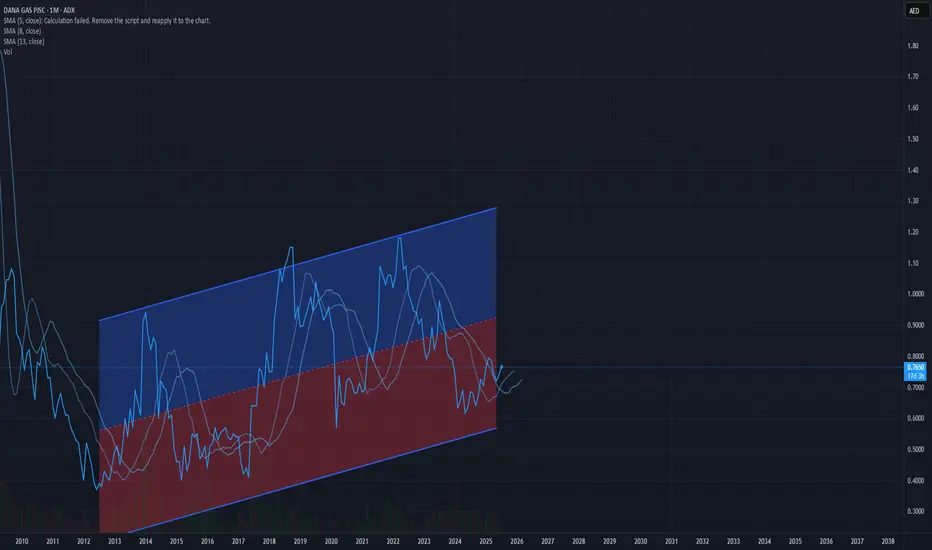
Wave Analysis
on an up treand from the historical data of the past few years adding the dividents of this year looking very appeling and on an up treand looks to reach the 1-1.2 target before the end of the year
over all a good time to enter on this uptrend
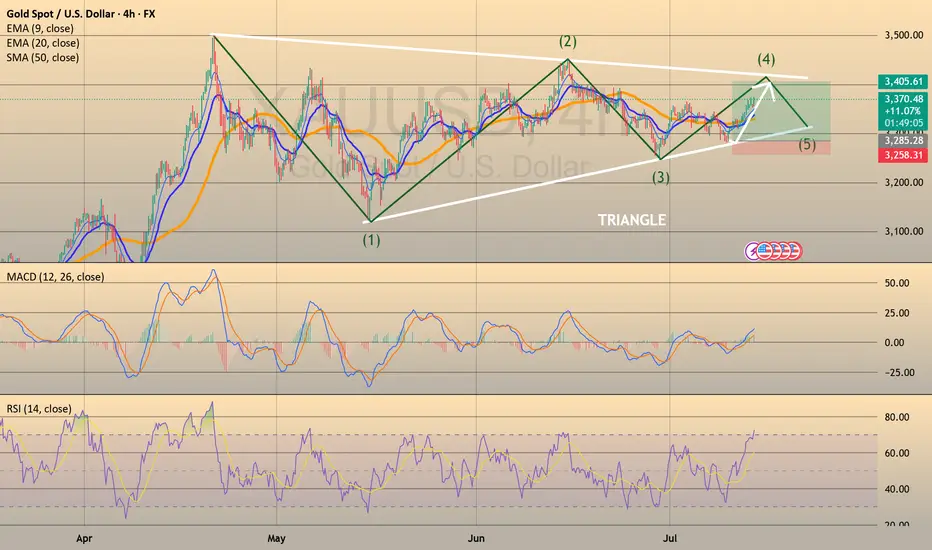
XAUUSD - POSSIBLE BIG LONG MIDTERM TRADESAXO:XAUUSD
XAUUSD - POSSIBLE BIG LONG MIDTERM TRADE📈
XAUUSD has gone the half of my take profit, so I decided to close 1/2 of my position here and put my stop loss at an entry price. Still, we have good chance to go towards upper border of the triangle, just want to reduce the risk.
XAUUSD has been trading sideways and has formed a Triangle pattern since April 23d. Looks like the price found a balance between supply and demand. Currently the price is sitting on a lower border of a triangle and potentially is forming the Wave D, according to Elliot Triangle Wave formation.
Trade cautiously!
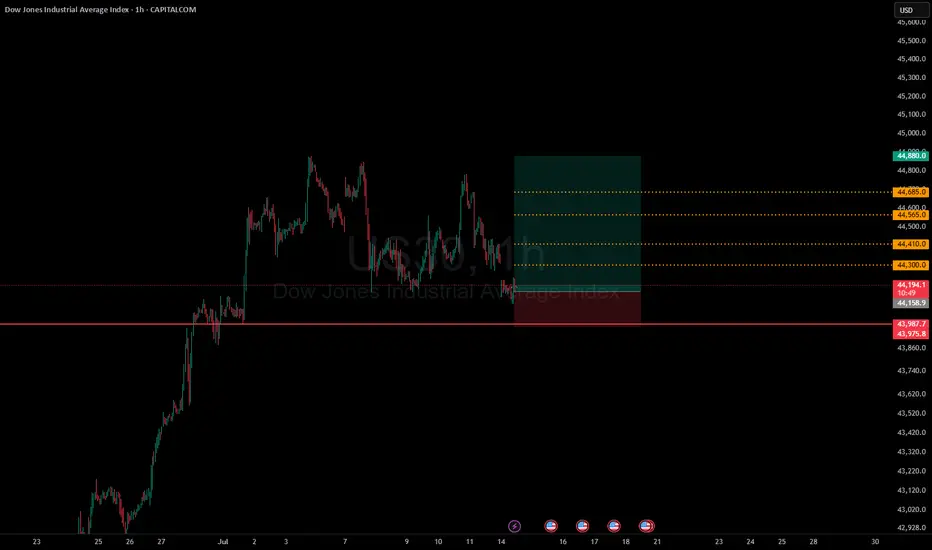
NZDCAD Long Trade 1:1.37 OANDA:NZDCAD Long Trade, with my back testing of this strategy, it hits multiple possible take profits, manage your position accordingly.
Institutions are Bullish, price is at good support, buying pressure is good also.
Risking 1% to make 1.37%
Note: Manage your risk yourself, its risky trade, see how much your can risk yourself on this trade.
Use proper risk management
Looks like good trade.
Lets monitor.
Use proper risk management.
Disclaimer: only idea, not advice

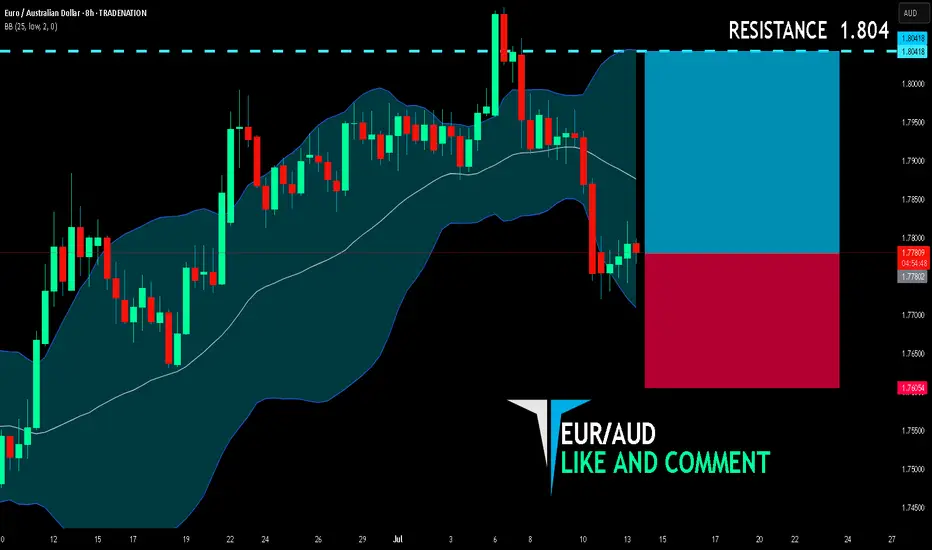
EUR/AUD BULLISH BIAS RIGHT NOW| LONG
EUR/AUD SIGNAL
Trade Direction: long
Entry Level: 1.778
Target Level: 1.804
Stop Loss: 1.760
RISK PROFILE
Risk level: medium
Suggested risk: 1%
Timeframe: 8h
Disclosure: I am part of Trade Nation's Influencer program and receive a monthly fee for using their TradingView charts in my analysis.
✅LIKE AND COMMENT MY IDEAS✅
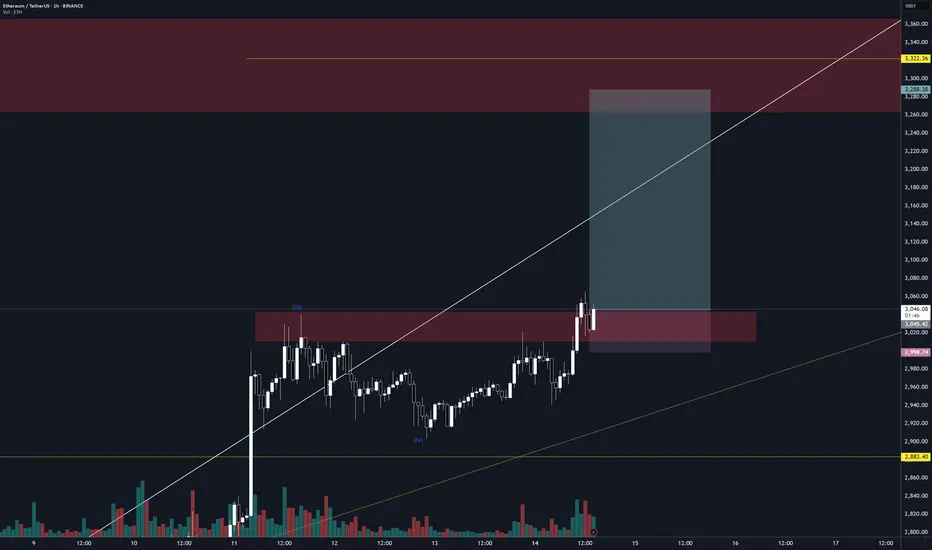
new long order on etheth backtest-ed, eth/btc looking good to move, btc reached new all time high.
Good to go ? ./.
XAUUSD Analysis – July 14, 2025: Gold Tests Critical Resistance Gold (XAUUSD) is currently trading around $3,373, rebounding strongly from the recent low at $3,294. Price is now testing the key resistance zone at $3,372–3,375, which aligns with the 0.0 Fibonacci retracement of the previous downtrend and a significant supply zone on the H4 timeframe.
1. Technical Analysis (H4 Chart):
🔹 Fibonacci & Price Action:
The price found strong support at $3,294, where previous demand and Fibonacci levels converge.
A sharp bullish move has pushed price above the 0.5 (at $3,316) and 0.618 (at $3,322) Fibonacci levels – signaling strong buyer interest.
The $3,372 zone is now acting as short-term resistance, matching the previous swing high.
🔹 EMA & RSI:
EMAs are trending upward, confirming short-term bullish momentum.
RSI is approaching overbought territory, suggesting a potential pullback in the short term.
🔹 Trendline & Structure:
Price remains above the rising trendline, indicating sustained bullish momentum.
The nearest support zone is now at $3,322 – $3,333, which overlaps with key Fibonacci and previous structure levels.
2. Key Price Levels:
Price Zone
Significance:3,372 – 3,375
Short-term resistance – Fibo 0.0:3,345 – 3,333
First support – pullback zone:3,322 – 3,316
Strong support – EMA + Fibo 0.5:3,294 – 3,287
Major support – recent swing low
3. Suggested Trading Strategies:
Strategy 1 – Take Profit for Existing Longs:
If you entered long positions near $3,295–$3,300, consider taking partial profits at the current resistance zone ($3,372–$3,375).
Strategy 2 – Short-Term Sell Opportunity:
Consider a short entry near $3,372–$3,375, with a stop-loss above $3,383.
Target profit: $3,333 – $3,322
Strategy 3 – Buy on Dip (Trend Continuation):
If price pulls back to the $3,333 – $3,322 support and holds, this is a good zone to enter long.
Stop-loss below $3,316, with potential target back to $3,385 – $3,400 if a breakout occurs.
Gold is showing a solid recovery after a sharp decline, but it is now testing a key resistance zone around $3,373. Caution is advised in the short term, as a pullback may occur. Priority should be given to "Buy on Dip" strategies if support zones hold.

Sugar is entering into bullish marketSugar is entering a bull market. I expect a recovery this week or two. The minimum wave equality norm has been fulfilled, so we may see multi-year bullish growth. But we need to be careful not to fall into another, final low at $13-11.

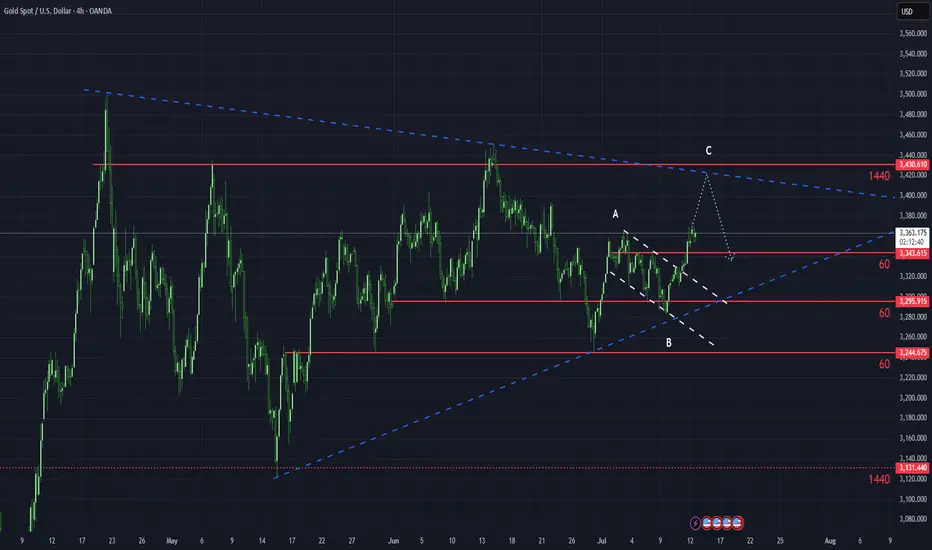
20250714-XAUUSD IdeaA clear impulse–correction–impulse structure has emerged in the major timeframe. A 1:1 upward movement is anticipated, potentially reaching the upper resistance zone and completing wave 4 of a contracting triangle. Monitor whether the price retests the 3343 level and observe the completion timing of wave C within the corrective ABC structure.
Descending Triangle Formation (GBPUSD)Here I can see a Descending Triangle Formation. I can see all the relevant characteristics such as the 4 touches, breakout and retest. Now it’s just a waiting game to see if it plays out.

IS XAUUSD FORMING SHORT BEARISH TREND ?FUNDAMENTAL ANALYSIS
Entry Point 3357
Target 1 3347
Target 2 3337
Stop Loss 3367
this is not financial advice

1000BONK/USDT - New ATH!!Lately, 1000BONK has been gaining significant attention across the market, supported by a rapidly growing and engaged community. After a liquidity grab below 0.015 1000BONK is now gearing up for its next leg up, with clear potential to target a new all-time high (ATH).

QNT/USDT - massive boxQNT/USDT is printing one of the most classic textbook patterns a massive box range that has developed over the past 1000 days. This type of long-term consolidation typically leads to explosive moves once the breakout occurs, and historically, box patterns of this scale rarely fail when confirmed.

KERNEL/USDTKERNEL/USDT is showing strong bullish structure at the current price zone, indicating accumulation and strength from smart money. After a period of consolidation, it's gaining momentum and looks poised to make a parabolic move

Expecting a slight Pull Back for gold I’m expecting a slight pull back on gold for the first day of trading week as always. A consolidation will always happen first before flushing retails out. 3339-3353 could be a possibility for bulls / long positions continuing higher. Breaking lower by EOD we can expect more bears to come in.
As always my analysis is for reference. Not an advised. Trade with your own due diligence. Risk management is always important for trading. Stay safe. Trade safe.

Weekly $SPY / $SPX Scenarios for July 14–18, 2025🔮 Weekly AMEX:SPY / SP:SPX Scenarios for July 14–18, 2025 🔮
🌍 Market-Moving News 🌍
⚖️ Powell Faces ‘Epic’ Trade‑Inflation Dilemma
Former Fed economists warn Chair Powell is navigating nearly unprecedented terrain: tariffs are pushing up prices even as the labor market cools. Striking a balance between inflation control and growth support remains a formidable challenge
📊 Tariff‑Driven Inflation May Peak This Week
June’s CPI is expected to show a 0.3% month-on-month increase, potentially lifting core inflation to ~2.7%—its highest level in 18 months. These data will heavily influence the Fed’s decision-making process
🏦 Big Bank Earnings Kick Off
Earnings season begins with JPMorgan ( NYSE:JPM ), Goldman Sachs ( NYSE:GS ), Wells Fargo ( NYSE:WFC ), and Citigroup ($C) reporting. Strong results could offset trade and inflation anxieties; expect volatility in financials
📈 Goldman Sees Broader S&P Rally
Goldman Sachs projects the S&P 500 to climb roughly 11% to 6,900 by mid‑2026, underpinned by firm earnings and expected Fed rate cuts. But warns that breadth remains narrow, increasing downside risk without robust participation
⚠️ Summer Volatility Risk Lingers
Deutsche Bank warns that summer’s low liquidity and the looming Aug 1 tariff re‑imposition deadline may spark sudden market turbulence—even amid bullish sentiment
📊 Key Data Releases & Events 📊
📅 Monday, July 14
Quiet start—markets digest back-to-back CPI, tariffs, and clearing post‑earnings.
📅 Tuesday, July 15
8:30 AM ET – Consumer Price Index (June)
Watch for potential tariff impact in CPI; core inflation data are crucial.
8:30 AM ET – Core CPI (June)
10:00 AM ET – Empire State Manufacturing Survey (July)
Early view on Northeast factory trends.
📅 Wednesday, July 16
8:30 AM ET – Producer Price Index (June)
Wholesale inflation signals to validate CPI trends.
10:00 AM ET – Housing Starts & Building Permits (June)
📅 Thursday, July 17
8:30 AM ET – Initial & Continuing Jobless Claims
A gauge on labor-market resilience amid talks of cooling.
📅 Friday, July 18
10:00 AM ET – Federal Reserve Beige Book Release
Fed’s regional economic snapshot ahead of next FOMC.
⚠️ Disclaimer:
This is for educational/informational use only—not financial advice. Consult a licensed professional before investing.
📌 #trading #stockmarket #economy #tariffs #inflation #earnings #Fed #CPI #technicalanalysis

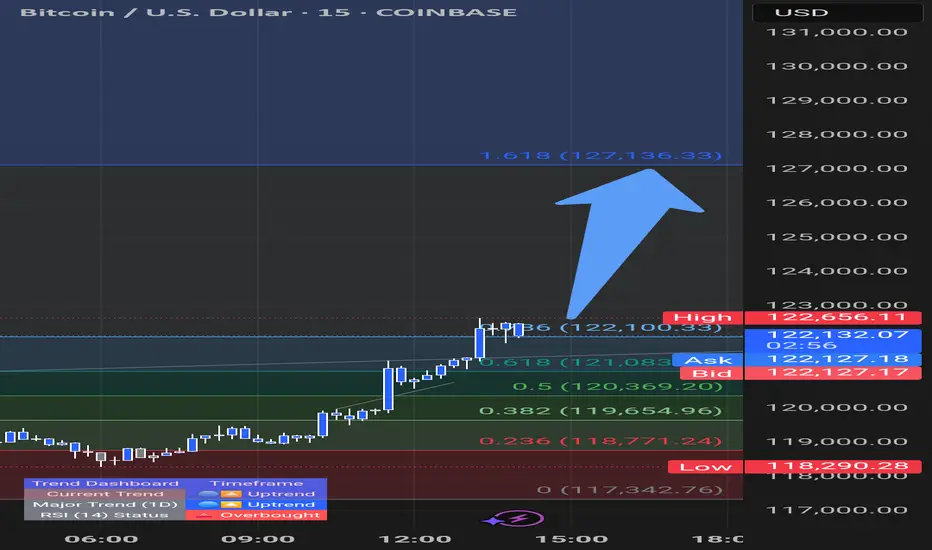
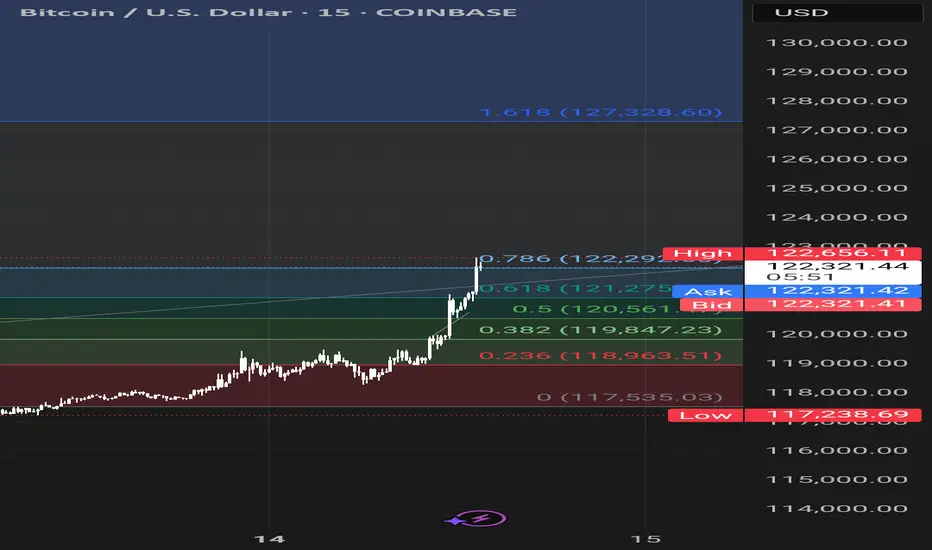
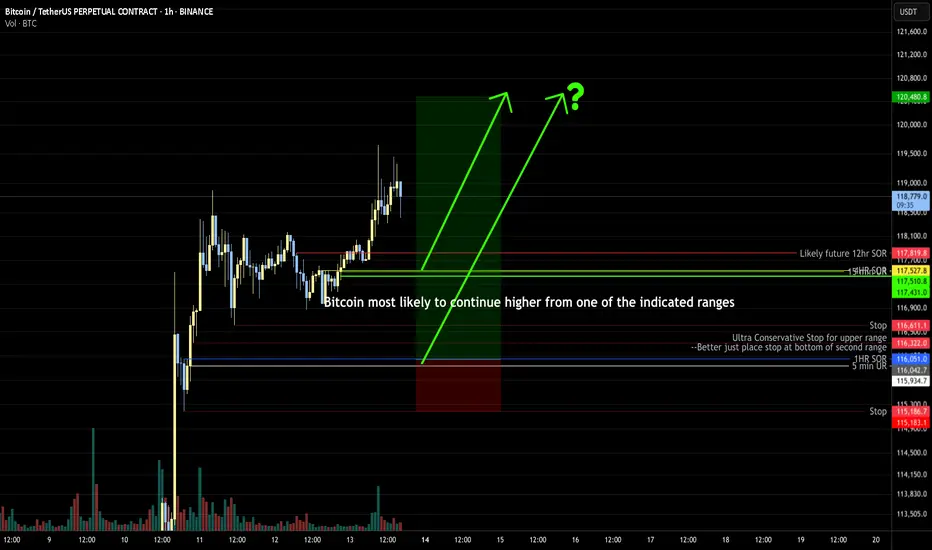
Bitcoin Overall: higherBitcoin most likely to continue higher from one of the indicated ranges. It may be best to split a trade 1/2 entry on one and 1/2 entry on other with stop below the second, or 2 trades with 1/2 normal risk.
AUDNZD Local Long!
HI,Traders !
#AUDNZD made a bullish
Breakout of the key horizontal
Level of 1.09105 which is now a
Support and the pair is going down
To retest the level from where
We will be expecting a
Further bullish move up !
Comment and subscribe to help us grow !

ME/USDT 300%!!!ME/USDT is showing signs of strength after a classic liquidity sweep below the $0.75 zone, which flushed out weak hands and provided a clean setup for a potential trend reversal. Price has now reclaimed the $0.80 level, a key support/resistance flip zone, signaling growing buyer confidence.

1000CAT/USDT April 2025 was a breakout month for 1000CAT/USDT, delivering a powerful +200% rally. Since then, the pair has entered a healthy consolidation phase, now trading around $0.008, and showing strength by holding a solid support zone at $0.006–$0.007.
Over the past weeks, price action has respected the $0.006–$0.007 range, suggesting accumulation and strong buyer presence.

possibility of uptrendConsidering the price behavior in the current resistance range, possible scenarios have been identified. With the resistance range broken and stabilized above, a continuation of the upward trend is likely.
