Wave Analysis

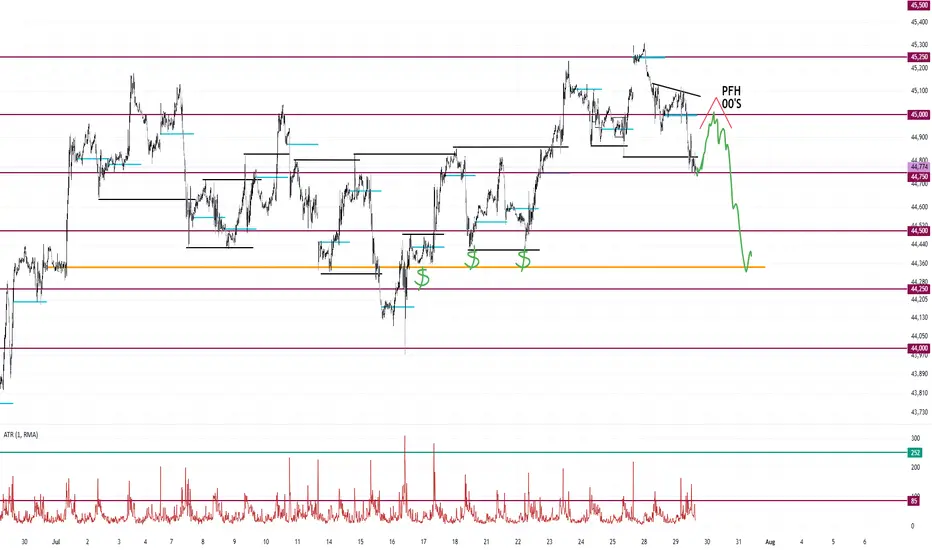
Peak Formation High Into Double Zero's Dump to Monthly OpenLooking for a peak formation high to form under the double zeros.
The market is most likely targeting the liquidity sitting around the monthly open.
I don't see any support until the market takes out some of these lows. Maybe at 44,250.
Highlighted in red brush is every peak formation high formed this month.
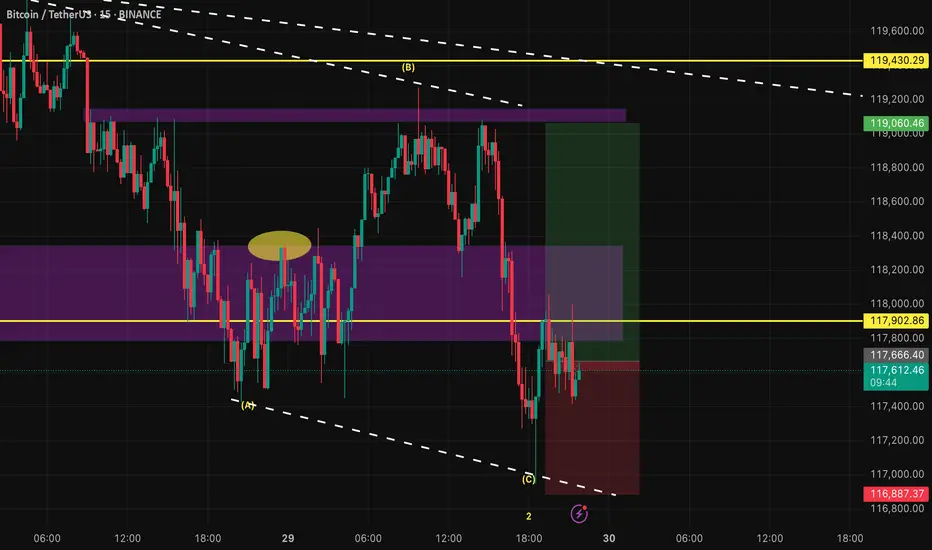
BTCUSD LongWe´re in a bigger bullish 5wave structure. Right now we´re in the 4th wave and could have completed a ABC correction. On 15min Chart we can see, that we just formed the 1st wave to start the 5th wave in the bigger structure
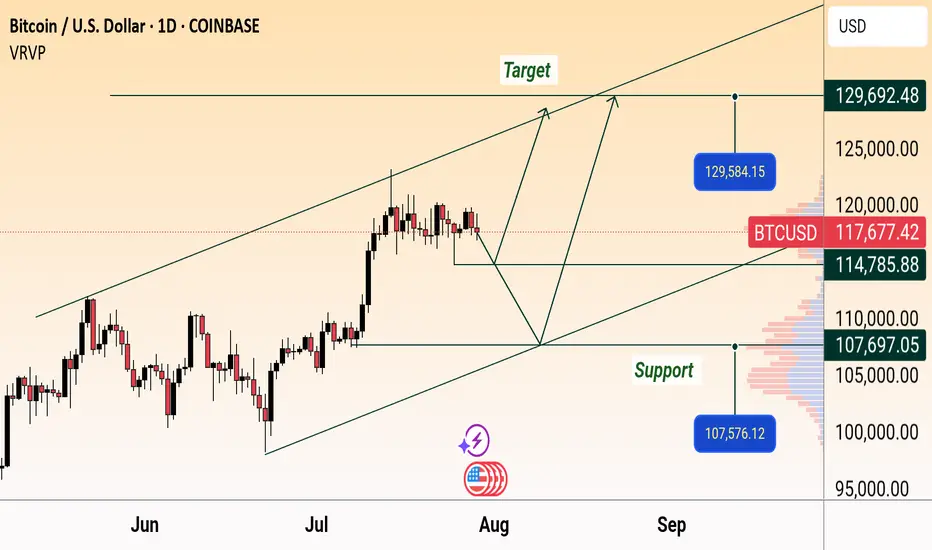
BTC/USD Daily Outlook: Support & Target Levels IdentifiedBitcoin (BTC/USD) Daily Chart Analysis:
Price is currently at $117,758.70, showing a slight decline. Key support levels are marked at $114,785.88 and $107,576.12, while targets are projected near $129,584.15 and $129,692.48. Chart suggests a possible upward channel, with both bullish and bearish scenarios mapped.
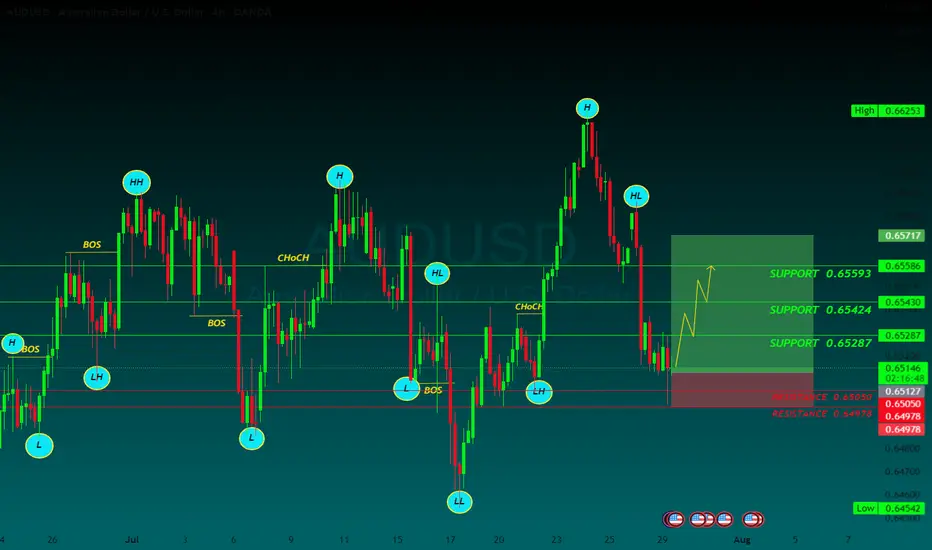
$GBPCAD: Overall Bearish, Short Term Upside
➡️ Downside motive wave: We are finishing 5 waves at strong blue support zone. I don´t see enough momentum to break this zone at the moment.
➡️ Expect a recovery: Price will probably make a short-term recovery, with a high probability of reaching the middle of the range at 1.85-1.86.
➡️ After this recovery (wave 2 or B), expect further downside, potentially breaking blue support.

BTCUSD – Wyckoff Accumulation + Elliott Wave SynergyTimeframe: 1H
Title: "A textbook Wyckoff Accumulation with Elliott Wave Confirmation – Sign of Strength Next?"
This chart presents a textbook Wyckoff Accumulation structure seamlessly combined with Elliott Wave Theory, highlighting how the two methodologies can complement each other in timing and structural validation.
🔍 Wyckoff Accumulation Phases:
SC (Selling Climax) and AR (Automatic Rally) define the range.
ST (Secondary Test) and STB (Secondary Test in Phase B) confirm horizontal support.
A classic Spring and Test pattern occurs in Phase C, marked by a sharp downward probe below support (Spring), followed by a successful retest with no new low (Test).
The LPS (Last Point of Support) is forming above the Spring low and near the 61.8% Fibonacci retracement level, showing bullish absorption of supply.
The recent rally and pullback suggest we're entering Phase D, with the Sign of Strength (SOS) expected next.
🌀 Elliott Wave Alignment:
The Spring aligns with the end of wave (iv) of a larger impulse, and the structure unfolding from the Spring appears to be the start of wave (v).
The move from Spring to SOS shows impulsive qualities, labeled as wave (i), with the corrective pullback forming wave (ii), ending near the golden Fibonacci ratio (61.8%).
This alignment of wave (ii) with the LPS further validates the accumulation and sets the stage for a strong wave (iii) within wave (v), likely to coincide with a Sign of Strength breakout.
💡 Key Takeaways:
This is a classic Wyckoff Accumulation with all major phases visible: A to D.
Elliott Wave counts confirm the internal structure and suggest bullish continuation.
Watch for the SOS rally above resistance at ~120k to confirm the transition into Phase D/E and a potential trending move.
🔔 Conclusion:
Combining Wyckoff and Elliott Wave provides a high-probability setup. A successful break above resistance will signal the start of a trend phase. LPS offers a favorable risk-reward area, especially with wave (ii) possibly completing soon with a test of Fibonacci ratio (61.8%).

BTC/USD – Bullish Reversal Setup 1H Smart Money OutlookBitcoin is showing signs of reclaiming bullish momentum after a strong rejection from demand. Structure is aligning for a potential push toward the highs:
🔹 CHoCH + BOS Confirmed – Structure shifted from bearish to bullish
🔹 Strong Rejection Candle from key demand zone (+OB) signals buyer interest
🔹 Price is breaking through FVG area, suggesting imbalance being filled
🔹 Eyes on the Order Block near Day High as first major target zone
📌 Scenarios:
1️⃣ Price holds above Bullish Bias → Clean rally toward 119,400 OB zone
2️⃣ Minor retest into FVG or upper demand → Ideal entry for continuation
🎯 Targets:
• Intraday: 118,800 – 119,250
• Swing: 119,600+ (OB Fill)
📉 Invalidation: Break below Day Low (116,967) and rejection from OB
Bias: Bullish (Short-term to mid-term)

#Nifty directions and levels for July 30th:Good morning, friends! 🌞
Here are the market directions and levels for July 30th:
There have been no major changes in the global market. The global sentiment remains moderately bullish,
while the local market continues to show a bearish tone.
Today, Gift Nifty indicates a gap-down opening of around 40 points.
What can we expect today?
In the previous session, both Nifty and Bank Nifty took a solid pullback after the gap-down start.
However, neither of them broke the 38% Fibonacci level in the current swing.
So, unless the 38% level is broken, we should continue to approach the market with a bearish view.
At the same time, key parameters have been lagging recently, which has made it difficult for the market to take a clear direction.
My primary expectation is consolidation within the previous day's range.
However, if the market breaks the bottom with a solid structure, then we can expect the correction to continue.

AUDUSD BUYThe AUD/USD pair is trading around 0.6520 on Tuesday. The daily chart’s technical analysis indicates a prevailing bullish bias as the pair remains within the ascending channel pattern. However, the 14-day Relative Strength Index (RSI) has moved below the 50 mark, indicating that a bearish bias is active. Additionally, the pair is positioned below the nine-day Exponential Moving Average (EMA), indicating that short-term price momentum is weaker.
The US and EU reached a framework trade agreement on Sunday that sets 15% tariffs on most European goods, taking effect on August 1. This deal has ended a months-long stand-off, per Bloomberg.
Traders keep their eyes on further developments in the US-China trade talks. The discussions are set to resume on Tuesday after top economic officials from both nations held over five hours of negotiations in Stockholm on Monday. The purpose of this meeting is to resolve ongoing disputes and extend their trade truce by another three months.
US Treasury Chief Scott Bessent met with China’s Vice Premier He Lifeng at Sweden’s Rosenbad government offices. The meeting comes ahead of an August 12 deadline to finalize a long-term tariff agreement with the Trump administration, building on preliminary deals reached in May and June that had helped ease tensions.
The US Federal Reserve (Fed) is widely expected to keep the benchmark interest rate steady between 4.25% and 4.50% at its July meeting. The FOMC press conference will be observed for any signs that rate cuts may start in September.
The Reserve Bank of Australia (RBA) is expected to closely watch the June labor force data and second-quarter inflation figures before deciding on a potential rate cut. Both the monthly and quarterly CPI reports are scheduled for release later this week.
SUPPORT 0.65593
SUPPORT 0.65424
SUPPORT 0.65593
RESISTSNCE 0.65050
RESISTANCE 0.64973
BITCOIN PREDICTION - MASSIVE CANDLE INCOMING!!! (WARNING) Watch this Bitcoin Prediction video now, you will love it!
Yello, Paradisers! Big warning sign: #Bitcoin is about to liquidate more traders soon if we get these confirmations that I'm sharing with you in this video. Loads of people will get wrecked again. Be careful not to get trapped into fakeouts.
In this video, I'm describing exactly what I'm seeing on Bitcoin, what patterns I'm waiting to form, and what confirmations I want to see before being able to say with 100% accuracy guaranteed that MARKETSCOM:BITCOIN is moving in that direction.
I'm sharing with you all the important targets and also how professional trading works: how risk-reward proper ratio trading works, and how high-probability trading depends a lot on how you choose to create your trades.
Watch this Bitcoin prediction to understand what I'm seeing right now on the chart and how I'm acting and making my decisions.

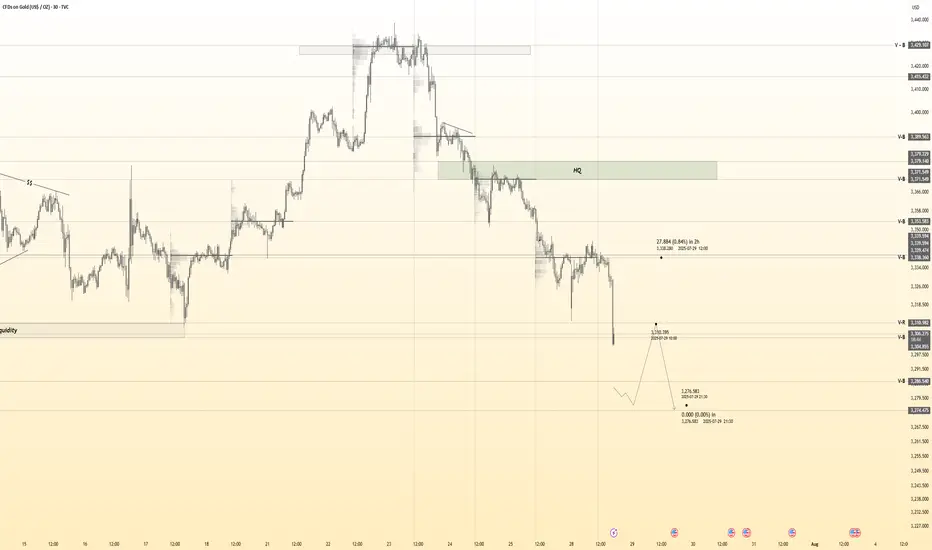
technical analysis- (xau-usd) (H1)This chart highlights a large symmetrical triangle formation, with an internal WXYXZ corrective structure blended with impulsive Elliott Waves (1)-(5). The price action is marked by key structural shifts: CHoCH, BOS, and EOH, signaling trend reversals and liquidity grabs.
📌 Price recently bounced off the ascending trendline, forming a potential wave (2) low, suggesting a bullish move into a wave (3) impulse.
🔼 Short-term target points to a revisit of the strong resistance zone around 3,400–3,410.
📊 Key Setup:
• Pattern: Symmetrical Triangle
• Wave Count: Corrective WXYXZ + impulsive structure in progress
• Signals: Bullish CHoCH + BOS confirmation
🎯 Trade Idea:
• ✅ Direction: BUY
• 🎯 Take Profit (TP): 3,400 – 3,410
• 🔻 Stop Loss (SL): 3,296
🔁 Sideways range compression sets up ideal conditions for short-term swing or breakout scalps.

Gold : Holding Ground Below 3345 Amid USD SurgeGold : Holding Ground Below 3345 Amid USD Surge
Gold's upward potential from Friday appears limited by the 3345 level—a narrow but firm resistance zone. As long as price fails to break above it, this zone has a high importance.
If gold holds below 3345, the probability of further downside increases significantly.
Meanwhile, the recent US–EU agreement has strengthened the USD. While this isn’t expected to severely impact gold, short-term fluctuations can’t be ruled out.
If price stabilizes in the red zone, it may consolidate ahead of the upcoming FOMC meeting. In such cases, volatility could erupt based on news-driven catalysts—so be prepared for unexpected moves.
You may find more details in the chart!
Thank you and Good Luck!
PS: Please support with a like or comment if you find this analysis useful for your trading day

EURUSD: Bullish Continuation is Expected! Here is Why:
Remember that we can not, and should not impose our will on the market but rather listen to its whims and make profit by following it. And thus shall be done today on the EURUSD pair which is likely to be pushed up by the bulls so we will buy!
Disclosure: I am part of Trade Nation's Influencer program and receive a monthly fee for using their TradingView charts in my analysis.
❤️ Please, support our work with like & comment! ❤️

B3 Analysis (12H)From the point where the red arrow is placed on the chart, the B3 correction has started. It appears we have an expanding/diagonal/symmetrical triangle, and wave E now seems to be complete.
As long as the green zone holds, the price could move toward the red box, which is a swap zone.
A daily candle closing below the invalidation level will invalidate this analysis.
For risk management, please don't forget stop loss and capital management
Comment if you have any questions
Thank You

Gold 30Min Engaged ( Bearish Break Out Entry Detected )Time Frame: 30-Minute Warfare
Entry Protocol: Only after volume-verified breakout
🩸Bearish From now price - 3306
➗ Hanzo Protocol: Volume-Tiered Entry Authority
➕ Zone Activated: Dynamic market pressure detected.
The level isn’t just price — it’s a memory of where they moved size.
Volume is rising beneath the surface — not noise, but preparation.
🔥 Tactical Note:
We wait for the energy signature — when volume betrays intention.
The trap gets set. The weak follow. We execute.
Major U.S. News Ahead—Will EURUSD Pivot?Good morning, my friends 👋
Here’s my EURUSD market analysis 📉
Currently, the pair is in a downtrend. I expect this downward move to end around 1.14899 or 1.14536, where a potential buying opportunity may emerge. I personally plan to enter a buy position once price reaches those zones 💼
Also, keep an eye on major U.S. economic reports being released today—they could trigger increased volatility 🔔
Every like you send is a huge source of motivation for me to keep sharing high-quality analysis 🙏 Thanks to everyone supporting the channel 💙

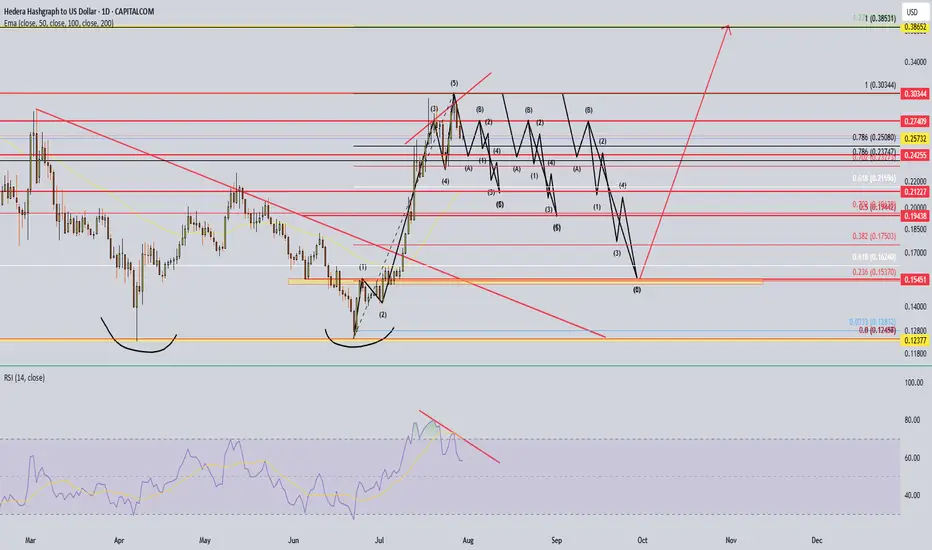
Hbar to 0.236 fib for backtest?@Dogg561 Hii
Here an update,
Hbar did a beautifull 5 move up. After this its likely it wil make an abc correction. For now just need to see a pull down for the wave A (doesnt matter where it goes), after that it needs to make a Wave B (also doesnt matter where it goes) Afther those 2 waves (A&B) you just want to count 5 waves down for the wave C (i drew 3 possible scenarios). If you put your fib tool over the complete 5 waves then you can see a super beautifull backtest on the top op wave 1 at the 0.15370 level. For now patient and wait until you see a finished abc correction to jump in again. The macro target would be 3.69 level.
Hellena | Oil (4H): SHORT to support area of 65.944.Colleagues, I previously recommended moving trades to break-even, and for good reason. It is always necessary to hedge and reduce losses—this is part of professional work.
(Breakeven=Risk Free: Move Stop loss to the entry level).
The price has nevertheless shown a stronger correction, and I now believe that the medium-term “ABC” waves have not yet formed, nor has the large “Y” wave.
This means that I expect the completion of wave “B” and then a continuation of the downward movement in wave “C.”
I consider the support area of 65.944 to be the minimum target.
Manage your capital correctly and competently! Only enter trades based on reliable patterns!

nifty 50 longrecently nifty had completed corrective wave pattern extended flat in near term price may move in impulsive move or complex correction
as on near term price could move in upwards

AUDNZD Technical + Fundamental Align for DownsideToday I want to analyze a short position on the AUDNZD ( OANDA:AUDNZD ) pair, first, let's look at it from a fundamental analysis perspective .
Fundamental View on AUDNZD
Key reasons to short AUDNZD:
Australian weakness:
Recent data show weakening consumer sentiment and declining building approvals. The RBA seems hesitant to hike further, putting pressure on the Aussie.
New Zealand resilience:
The RBNZ maintains a relatively hawkish stance. Inflation is still a concern, and the central bank is committed to keeping rates high, supporting NZD strength.
Monetary policy divergence:
The divergence between RBA’s dovish stance and RBNZ’s hawkish approach supports further downside in AUDNZD.
----------------------
Now let's take a look at AUDNZD from a technical analysis perspective on the 4-hour timeframe .
AUDNZD is currently trading in a Heavy Resistance zone(1.0963 NZD-1.0870 NZD) near the upper line of the Range Channel , Potential Reversal Zone(PRZ) and Yearly Pivot Point .
In terms of Elliott Wave theory , AUDNZD appears to be completing microwave B of microwave Y of the main wave 4 .
I expect AUDNZD to drop to at least 1.0904 NZD(First Target) based on the above explanation .
Second Target: 1.0886 NZD
Note: Stop Loss(SL): 1.0963 NZD
Please respect each other's ideas and express them politely if you agree or disagree.
Australian Dollar/New Zealand Dollar Analyze (AUDNZD), 4-hour time frame.
Be sure to follow the updated ideas.
Do not forget to put a Stop loss for your positions (For every position you want to open).
Please follow your strategy and updates; this is just my Idea, and I will gladly see your ideas in this post.
Please do not forget the ✅' like '✅ button 🙏😊 & Share it with your friends; thanks, and Trade safe.

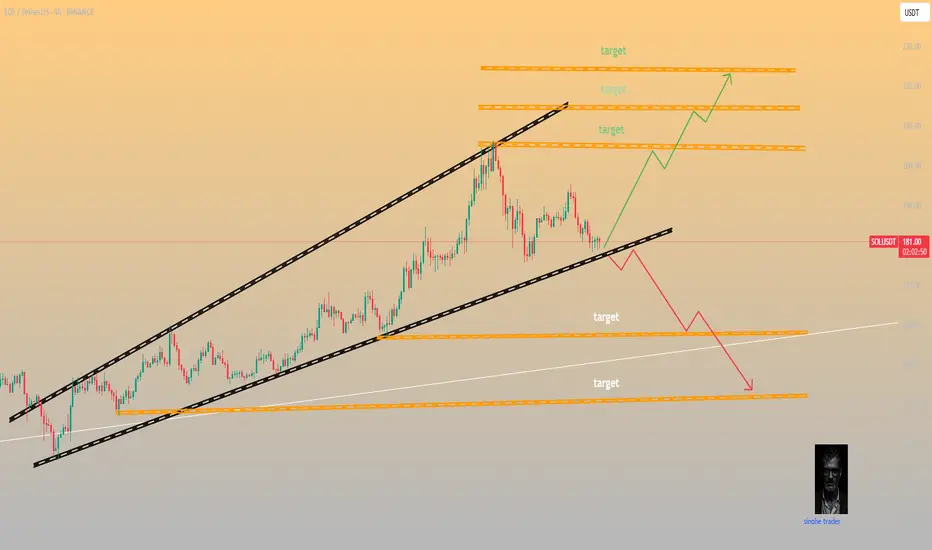
SOL Both scenarios are valid! SOL is still bullishSOL Both scenarios are valid! SOL is still bullish
SOL is in a critical zone. The price is still inside a large bullish pattern and as long as it stays inside the pattern, the trend remains bullish and SOL should follow the bullish scenario.
The bullish targets are at 205, 214 and 224
It may happen that the FOMC will bring surprises, so if SOL manages to break below the pattern, it will activate the bearish scenario after that and the chances of falling will increase further as shown in the red scenario.
The bearish targets are at 160 and 139
You may find more details in the chart!
Thank you and Good Luck!
PS: Please support with a like or comment if you find this analysis useful for your trading day
PEPEUSD – Trying to Snap the DowntrendPEPE unraveled from $0.00001320 back to $0.00001167 support. Now attempting to grind higher, with RSI curling upward and price forming a short-term uptrend. If it breaks $0.00001214, this could become a breakout attempt. But overall trend is still corrective below $0.00001248.

EURUSD Is Bearish! Short!
Take a look at our analysis for EURUSD.
Time Frame: 2h
Current Trend: Bearish
Sentiment: Overbought (based on 7-period RSI)
Forecast: Bearish
The market is approaching a key horizontal level 1.166.
Considering the today's price action, probabilities will be high to see a movement to 1.159.
P.S
We determine oversold/overbought condition with RSI indicator.
When it drops below 30 - the market is considered to be oversold.
When it bounces above 70 - the market is considered to be overbought.
Disclosure: I am part of Trade Nation's Influencer program and receive a monthly fee for using their TradingView charts in my analysis.
Like and subscribe and comment my ideas if you enjoy them!
