Bitcoin: New All-Time High — What’s Next?Bitcoin had an incredible run, breaking the old all-time high ($111,980) with strong bullish momentum and setting a fresh ATH at $123,218 (Binance). We just witnessed the first major corrective move of ~6% and a decent bounce so far — but the big question is:
What’s next? Will Bitcoin break higher over the summer or form a trading range here?
Let’s dive into the technicals.
🧩 Higher Timeframe Structure
May–June Range:
BTC was stuck between $110K–$100K, forming an ABC corrective pattern. Using trend-based Fib extension (TBFE) from A–B–C:
✅ C wave completed at $98,922 (1.0 TBFE)
✅ Upside target hit at $122,137 (-1 TBFE)
Full Bull Market TBFE:
➡️ 1.0 → $107,301 → previously rejected
➡️ 1.272 → $123,158 → recent rejection zone
Pitchfork (log scale):
➡️ Tapped the upper resistance edge before rejecting.
Previous Bear Market Fib Extension:
➡️ 2.0 extension at $122,524 hit.
2018–2022 Cycle TBFE:
➡️ 1.618 at $122,011 tapped.
Macro Fibonacci Channel:
➡️ Connecting 2018 low ($3,782), 2021 ATH ($69K), 2022 low ($15,476) →
1.618–1.666 resistance band: $121K–$123.5K.
✅ Conclusion: Multiple fib confluences mark the $122K–$123K zone as critical resistance.
Daily Timeframe
➡️ FVG / Imbalance:
Big daily Fair Value Gap between the prior ATH and $115,222 swing low.
BTC broke the prior ATH (pATH) without retest → a pullback to this zone is likely.
Lower Timeframe / Short-Term Outlook
We likely saw a completed 5-wave impulse up → now correcting.
The -6% move was probably wave A, current bounce = wave B, next leg = wave C.
➡ Wave B short zone: $120K–$121K
➡ Wave C target (1.0 TBFE projection): ~$113,326
➡ Confluence at mid-FVG + nPOC
Trade Setups
🔴 Short Setup:
Entry: $120,300–$121,000
Stop: Above current ATH (~$123,300)
Target: $113,500
R:R ≈ 1:2.3
🟢 Long Setup:
Entry: Between Prior ATH and $113,000
Stop: Below anchored VWAP (~$110,500)
Target: Higher, depending on bounce confirmation.
🧠 Educational Insight: Why Fibs Matter at Market Extremes
When markets push into new all-time highs, most classic support/resistance levels disappear — there’s simply no historical price action to lean on. That’s where Fibonacci extensions, channels, and projections become powerful tools.
Here’s why:
➡ Fibonacci extensions (like the 1.272, 1.618, 2.0) help estimate where trend exhaustion or profit-taking zones may appear. They are based on the psychology of crowd behavior, as traders anchor expectations to proportional moves from previous swings.
➡ Trend-Based Fib Extensions (TBFE) project potential reversal or continuation zones using not just price levels, but also the symmetry of prior wave moves.
➡ Fibonacci channels align trend angles across multiple market cycles, giving macro context — like how the 2018 low, 2021 ATH, and 2022 low project the current 1.618–1.666 resistance zone.
In short:
When you don’t have left-hand price history, you lean on right-hand geometry.
That’s why the $122K–123K zone wasn’t just random — it’s a convergence of multiple fib levels, cycle projections, and technical structures across timeframes.
⚡ Final Thoughts
Bitcoin faces major resistance around $122K–$123K backed by multiple fib and structural levels. A retest of the prior ATH zone (~$112K–$113K) looks probable before the next big directional move. Watch lower timeframe structure for signs of completion in this corrective phase.
_________________________________
💬 If you found this helpful, drop a like and comment!
Want breakdowns of other charts? Leave your requests below.
Wave Analysis

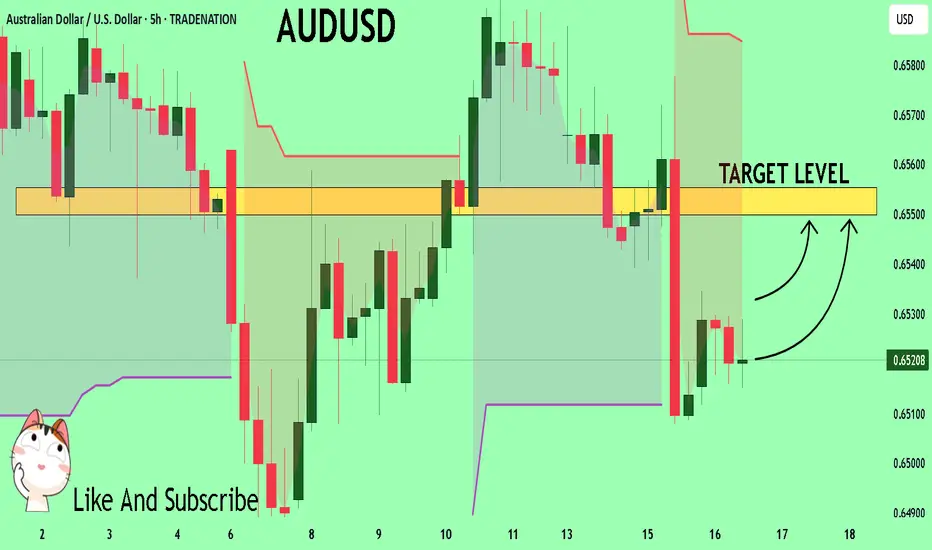
AUDUSD Set To Grow! BUY!
My dear subscribers,
AUDUSD looks like it will make a good move, and here are the details:
The market is trading on 0.6521 pivot level.
Bias - Bullish
Technical Indicators: Both Super Trend & Pivot HL indicate a highly probable Bullish continuation.
Target - 0.6550
About Used Indicators:
The average true range (ATR) plays an important role in 'Supertrend' as the indicator uses ATR to calculate its value. The ATR indicator signals the degree of price volatility.
Disclosure: I am part of Trade Nation's Influencer program and receive a monthly fee for using their TradingView charts in my analysis.
———————————
WISH YOU ALL LUCK
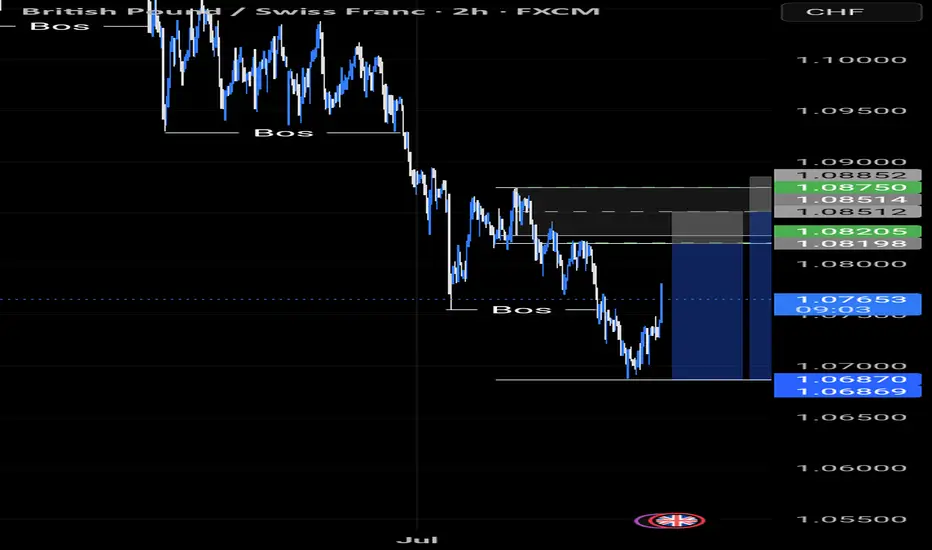
GBPCHF TRADE IDEA We seem to be pulling back on GBPCHF
We anticipate a pullback to our Fibonacci level for a continuation trade to the downside on GBPCHF.
Let's see how the market does it's thing
Bitcoin Prediction that will blow your mind (warning for bulls) I am showing you that BTC made new ATH only in the USD pair and not in other pairs like EUR, and why, and what you can anticipate and what to watch out for from #Bitcoin next.

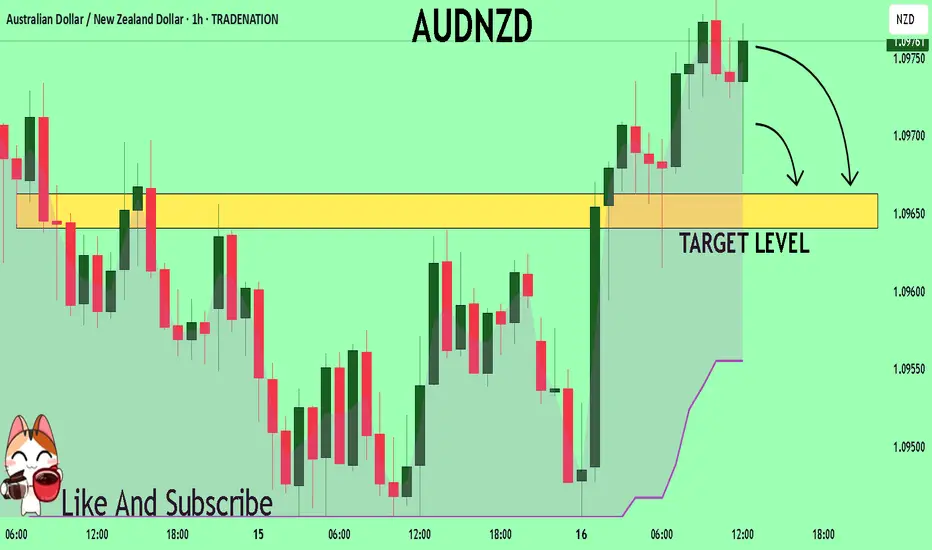
AUDNZD Under Pressure! SELL!
My dear followers,
This is my opinion on the AUDNZD next move:
The asset is approaching an important pivot point 1.0975
Bias - Bearish
Technical Indicators: Supper Trend generates a clear short signal while Pivot Point HL is currently determining the overall Bearish trend of the market.
Goal - 1.0966
About Used Indicators:
For more efficient signals, super-trend is used in combination with other indicators like Pivot Points.
Disclosure: I am part of Trade Nation's Influencer program and receive a monthly fee for using their TradingView charts in my analysis.
———————————
WISH YOU ALL LUCK
Possible Break-Out Chart Pattern and News RelatedUpdate to Rigetti:
After a retest to the Fibonacci Support-Zone 0,5-0,618, we could see an impulse Movement in Wave 3 to the 1,618 Fibonnacci lvl around 24 $
News relating the new system and low error for their new qubits could launch that wave.

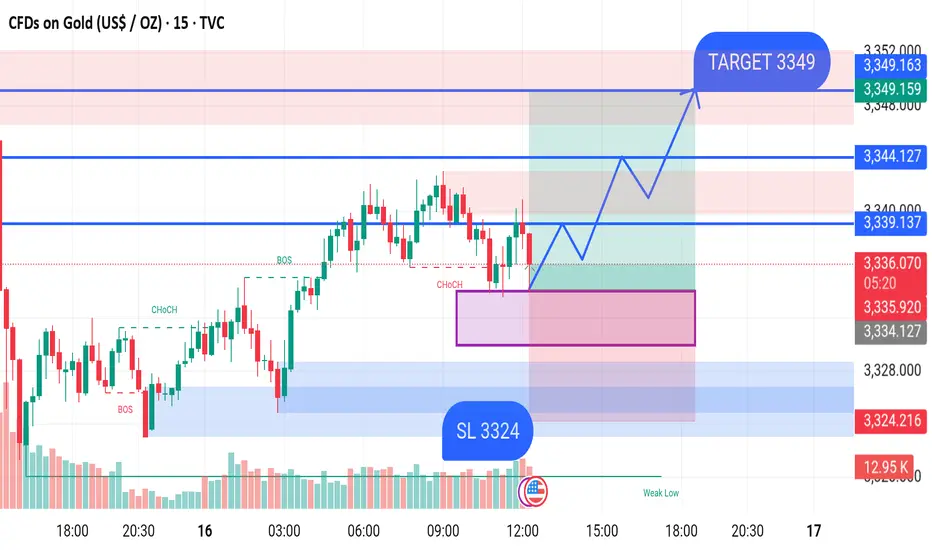
GOLD BUY M15 XAU/USD (Gold) 15-Min Chart Analysis – July 16, 2025
Price is currently consolidating around the 3,335.70 level after showing a Change of Character (CHoCH), indicating a potential shift from bearish to bullish momentum.
Key Observations:
Demand Zone: Marked in purple between 3,334 – 3,330, where buyers may step in.
Stop Loss (SL): Placed at 3,324, just below the demand zone for risk management.
Break of Structure (BOS): Confirmed to the upside, suggesting bullish intent.
Expected Move: A bounce from the demand zone, followed by higher lows and a breakout above the resistance levels.
Important Levels:
Entry Area: Near current price at 3,335
Resistance Levels:
3,339
3,344
Target: 3,349
Stop Loss: 3,324
Bias: Bullish, as long as price holds above the 3,324 support.
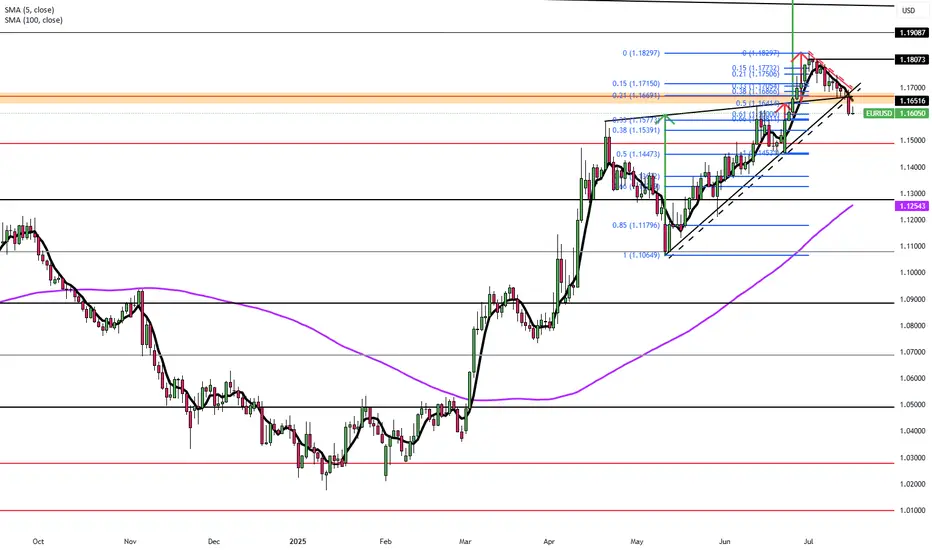
Euro Steady, EU Prepares $84B RetaliationEUR/USD hovered near 1.1670 in Tuesday’s Asian session as markets awaited US-EU trade updates. Despite Trump’s 30% tariff announcement on EU imports, he confirmed that negotiations with Brussels are ongoing ahead of the August 1 deadline. According to Bloomberg, the EU is ready to respond with proportional tariffs targeting $84B (€72B) worth of US goods, including Boeing jets, bourbon, cars, and machinery.
Resistance for the pair is at 1.1715, while support is at 1.1645.
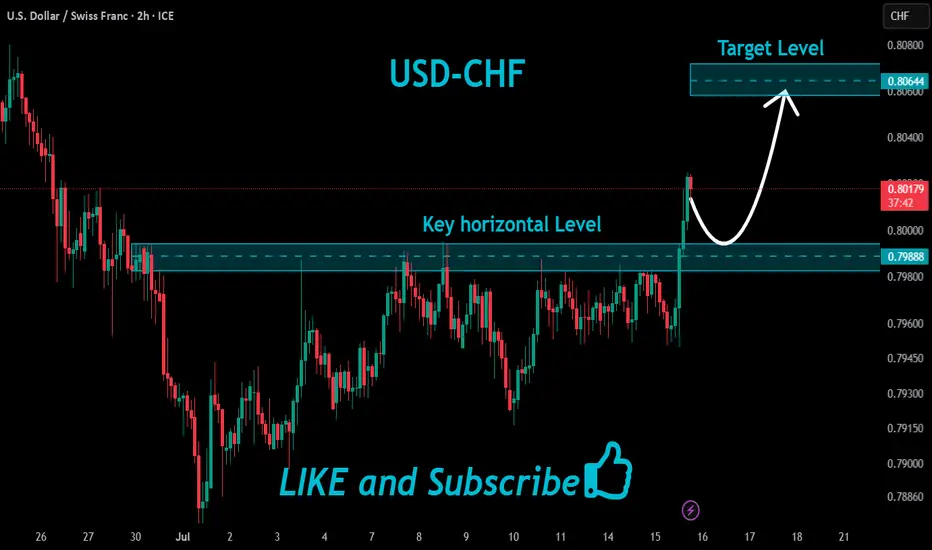
USDCHF Local Long!
HI,Traders !
#USDCHF made a bullish
Breakout of the key horizontal
Level of 0.79888 which is now a
Support and the pair is going down
To retest the level from where
We will be expecting a
Further bullish move up !
Comment and subscribe to help us grow !
BRETTUSDTA lot of people still don’t get $BRETT — they see it as just another meme coin. But let me break it down. 🧠📉📈
BRETT isn’t random.
It comes straight from the Base ecosystem, backed by the viral success and culture of Matt Furie — the same creator behind Pepe the Frog 🐸. Yeah, that Pepe.
This isn’t just memes — it’s crypto culture, and BRETT is becoming its poster child on Base. 🚀
The Base chain is still heating up, and BRETT is right in the middle of that early wave.
Early coins on new chains? Historically huge upside. ⛓️🔥
💰 I got in because I believe we haven’t even scratched the surface.
Yes, it's pulled back a bit — normal in crypto. But that’s not the end.
I’m personally expecting a rebound of at least +350% from here.
That would barely get us back to its momentum highs, and with community and narrative catching fire again... the upside could be even crazier. 🌪️📊🌕
Let the impatient sell. Let the crowd move on.
I’m here holding BRETT, because when this thing pops off again…
I don’t want to be watching from the sidelines. 🏁💎
+350% isn’t a fantasy. It’s the next leg up.
Don’t fade the frog. 🐸🔥

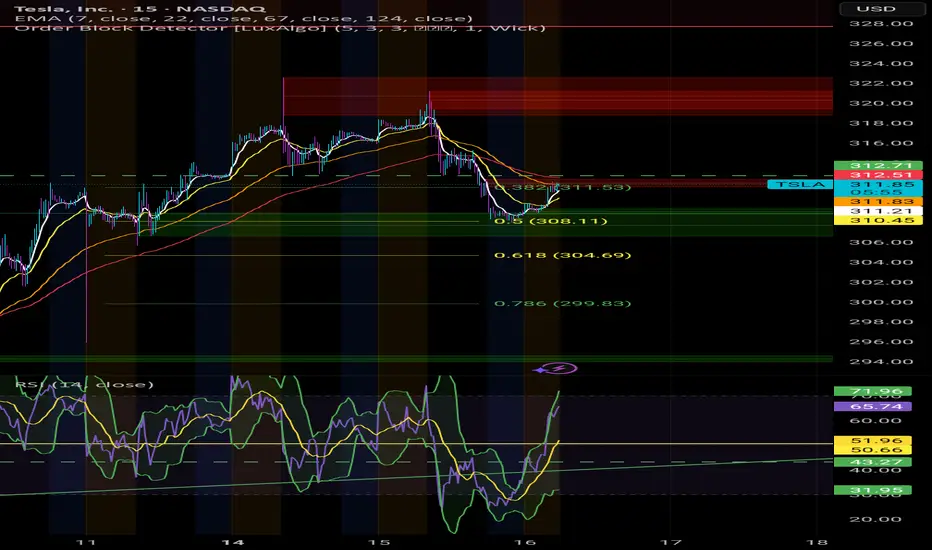
Is the BullRun over? I don't think so. $TSLAYesterday we saw a somewhat heavy fall in Indexes, and it probably scared alot of retail Bulls outs.
However, it seems we've fallen straight into potential medium term supports across multiple stocks in the markets.
I'm convinced we will get a good economic data print today.
This would open the door to new ATHs, again, in the Indexes.
For this to play out, the local bottoms established over night need to hold.
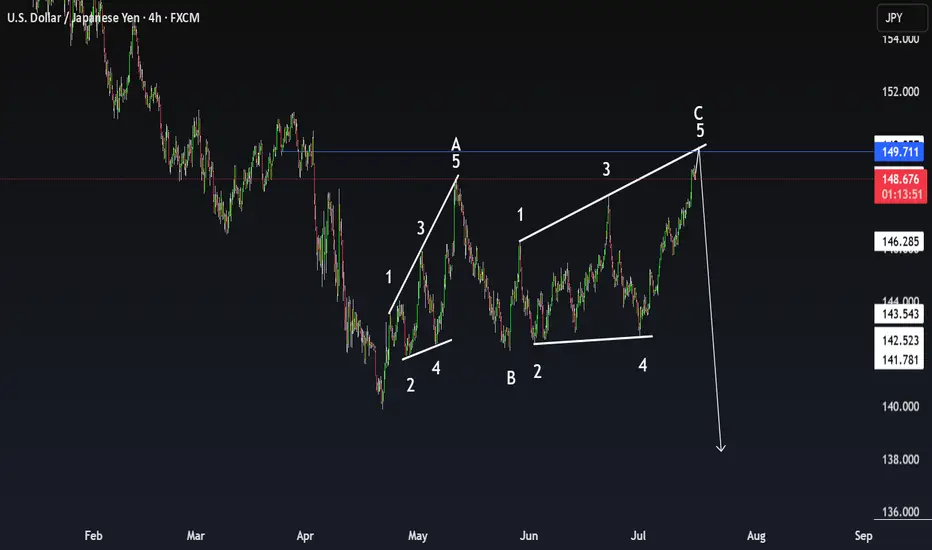
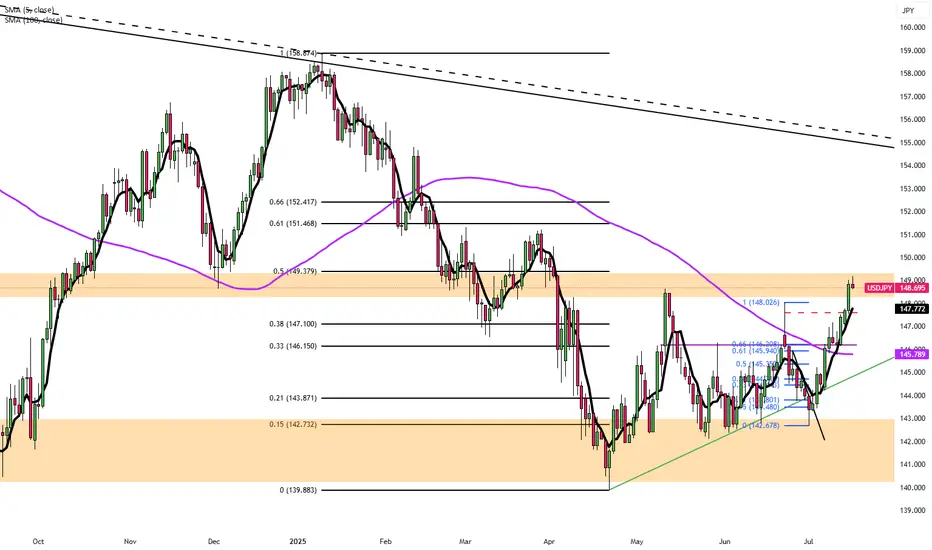
USDJPY Expanding Diagonal – Final Wave 5 at 149.71?FX:USDJPY FX_IDC:USDJPY
USD/JPY – 4H Chart – Elliott Wave Analysis
📅 July 16, 2025 | By: Trwin
🧠 Pattern Highlighted: Expanding Ending Diagonal (Wave C)
The current move from wave B to C appears to form a classic expanding ending diagonal, suggesting trend exhaustion near the key resistance zone of 149.71.
🔎 Key Features:
🔹 All 5 waves are structured as zigzags – a textbook ending diagonal.
🔹 Wave 3 > Wave 1, and Wave 5 > Wave 3 → confirms expanding structure
🔹 Wave 2 & 4 retraced deeper than typical impulses (common in diagonals)
🔹 Wedges are diverging, forming an expanding wedge.
🔹 Price is nearing a throw-over, hinting at final exhaustion.
💬 What do you think? Will USDJPY reverse hard from this expanding wedge or break higher into a blow-off top?
⚠️ Disclaimer:
This analysis is for educational purposes only and does not constitute financial advice. Trading carries risk, and past performance is not indicative of future results. Always do your own research and consult with a licensed financial advisor before making any trading decisions.
Yen Slips Near 2-Month LowThe yen traded around 147.6 per dollar on Tuesday, close to a two-month low, as market sentiment remained fragile amid lingering trade tensions. The U.S. plans to impose 25% tariffs on Japanese exports starting August 1, but Tokyo hasn’t signaled retaliation. Talks between the two sides have stalled, and Japanese officials warn of potential economic fallout if the measures take effect.
Resistance is at 147.75, with major support at 146.15.
[UPD] BTC / ETH / XRP / SOL / HYPE and other alt and mem-coins A new video update with insights on the intermediate trend structure with key support and resistance zones to keep on radar in the coming sessions
Coins discussed in the video: CRYPTOCAP:BTC / CRYPTOCAP:ETH / CRYPTOCAP:XRP / GETTEX:HYPE / CRYPTOCAP:SOL / CRYPTOCAP:LINK / CRYPTOCAP:SUI / $BRETT / SEED_DONKEYDAN_MARKET_CAP:FLOKI and others
Hope this is helpful in guiding you through the crypto market. Thank you for your attention and I wish you successful trading decisions!
If you’d like to hear my take on any other coin you’re tracking - feel free to ask in the comments (just don’t forget to boost the idea first 😉).

APTUSD – Recovered and RechargingAPT broke out from $4.70 base and surged to $5.30+. After a deep pullback, it formed a solid V-bottom and reclaimed $5.00 quickly. Price now moves with strength toward previous high. The breakout level to clear is $5.25–$5.30 for fresh leg up.

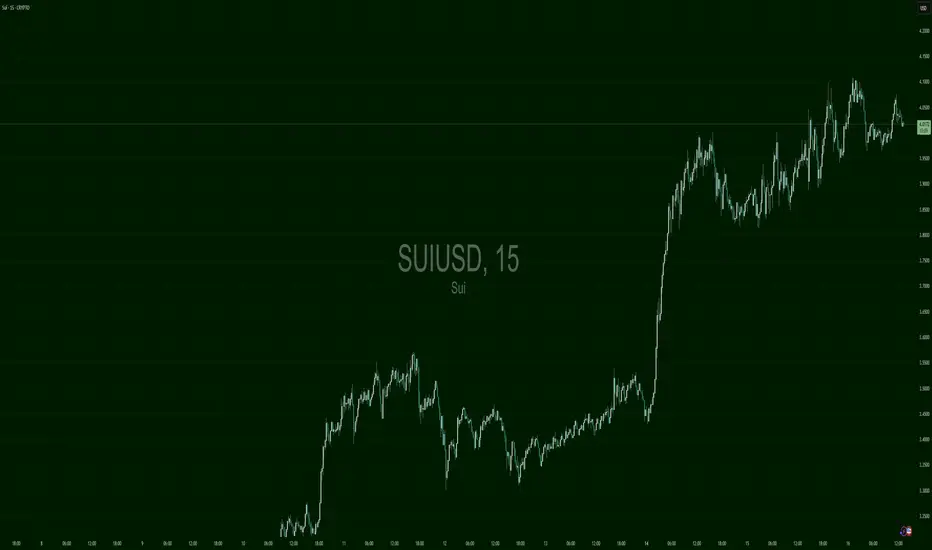
SUIUSD – Calm Before ContinuationSUI made an explosive move from $3.25 to $4.20+ in two days. After peaking, it's consolidating in a tight bull flag around $4.00–$4.07. Momentum is cooling slightly, but the uptrend remains intact. Clear breakout trigger sits at $4.10+ for new highs.
LINKUSD – Relentless Rally HoldingLINK rallied off $14.70, then chopped into $16.50 resistance. After a brief rejection, bulls took control again and printed a new local high. Trend is aggressive and persistent, with every dip bought. Support is $16.20–$16.25 — bulls must hold that zone to stay in control.

HBARUSD – Pause Before PushHBAR had a monster run from $0.18 to $0.26 in a vertical breakout. After topping, it retraced toward $0.22 and found support. The rebound has been stable, climbing with higher lows. Still consolidating below the local high, but if it breaks $0.2430 clean, expect another leg up.

BTC 141000Hello friends
I think Bitcoin has another correction to 113662 and then it will climb to 141000.

Gold Buy Plan - 16 July 2025📌 Gold Buy Plan - 16 July 2025
Timeframe: H4
Bias: Bullish
Structure: Market has formed bullish FVGs and is respecting demand zones.
🔍 Key Zones:
Demand Zone: 3,314 - 3,325 (Blue Zone)
Entry Range: Price expected to dip into demand zone before rally
Current Price: 3,343.52
Liquidity Target 1: 3,393.46
Liquidity Target 2: 3,451.19 (Final target / magnet area)
✅ Buy Setup Plan:
Wait for retracement:
Let price dip into the demand zone around 3,320–3,325.
Entry Trigger:
Look for:
Rejection candle in H1 or M30
Break of structure or bullish FVG formation
Engulfing candle from the demand zone
Buy Entry:
Around 3,320 ± few points (inside demand zone)
Stop Loss:
Below the demand zone: around 3,305
Take Profit Targets:
TP1: 3,393 (liquidity level)
TP2: 3,451 (magnet zone)
Risk to Reward:
From 3,320 to 3,451 → approx. 1:4 RRR
⚠️ Conditions to Invalidate Buy Plan:
If price closes H4 candle below 3,305, plan is invalid.
If price forms a bearish FVG after liquidity sweep, re-evaluate.

Gold (XAU/USD) Trading Analysis for July 16Support Zone: The market has found support around the 0.5 Fibonacci retracement level at 3,333.58. This could be a potential entry point for a long trade if the price bounces here.
Resistance Zone: The price action is approaching the 3,345.18 level, with a strong resistance around that zone. If the price breaks above this resistance, we could see further upward movement.
Price Action: We can observe an initial bullish movement followed by a correction. The price is currently in an uptrend, forming a series of higher lows and higher highs.
Fibonacci Levels: The 0.5 level at 3,333.58 has already acted as a support zone, and if the price retraces back here, this could be a good opportunity to enter long positions. The 0.618 level at 3,336.32 serves as a key resistance point. If price breaks above this level, it could indicate a continuation of the bullish trend.
Bullish Scenario (Long Entry): If the price retraces back to the 3,333.58 area (0.5 Fibonacci level) and shows signs of support (such as bullish candlestick patterns), consider entering long with a target at 3,345.18.
Bearish Scenario (Short Entry): If the price fails to break above 3,345.18 and forms a reversal pattern, you could consider shorting with a target near 3,320.
Risk Management:
Stop Loss: Place a stop loss just below 3,330, allowing for a small margin of error in case the price breaks through the support level.
Take Profit: Consider setting a take-profit at 3,345.18 for short-term moves or look for further price action if you're aiming for a longer-term trend.
Reminder: Always monitor the price action closely and adjust stop losses accordingly. The market is subject to volatility, especially during high-impact news events, so make sure to stay updated.

ALTS Season is coming Hello, I hope you are all well
Today I'm going to share this idea with you. This chart shows the liquidity of altcoins below the top 10
I expect to see an upward trend from these areas and targets, as depicted in the chart.
Don't forget to manage your risk. This is not investment advice. Altcoins are highly risky, and you could lose all your money
Good luck to everyone 🤍

Gold is getting ready to rise.Gold has been resting too long and the neutral triangle is no longer valid in terms of time and a contracting triangle seems to be forming.
In any case, there is at least one more bullish wave left for gold.
Good luck
NEoWave Chart
