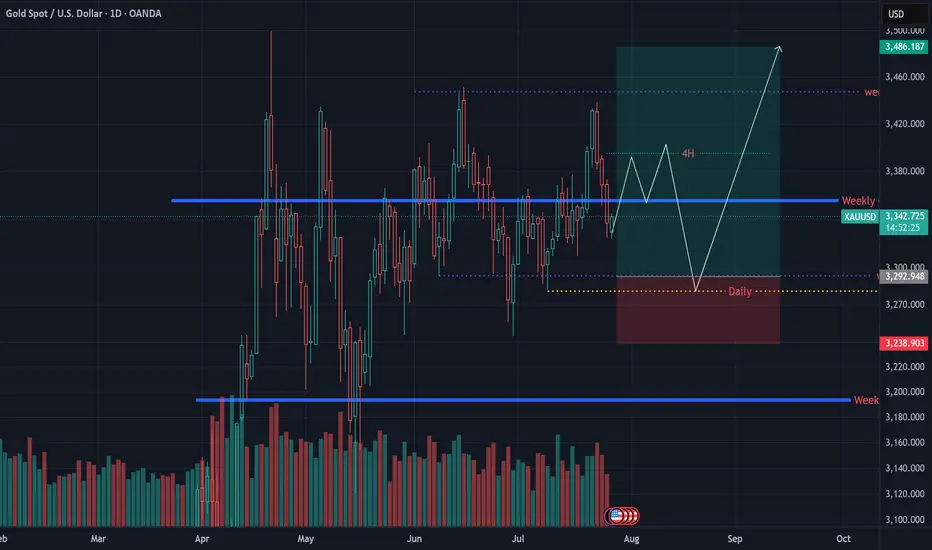
XAUUSD Analysis – July 27, 2025Last week, we marked the 3320–3330 zone as a potential buy-entry area. However, mid-term order flow pushed price above 3400 before reaching that level.
Toward the end of the week, a sell-off slightly weakened buyer confidence, and we now anticipate more cautious re-entries around the 3300–3290 region.
📈 The broader trend remains bullish for mid and long-term traders.
For scalpers trading against the trend, we recommend sticking to minor bearish pullbacks only, and managing risk tightly.
🔻 The 3390–3400 range offers a potential 300+ pip short opportunity for risk-averse sellers.
🟠 Risk-tolerant traders might consider holding shorts until the 3300 zone is tested.
⚠️ Key Insight: Given the liquidity build-up at 3400, if the price returns to this level, there’s a strong chance we’ll see a breakout above the previous high.
Wave Analysis
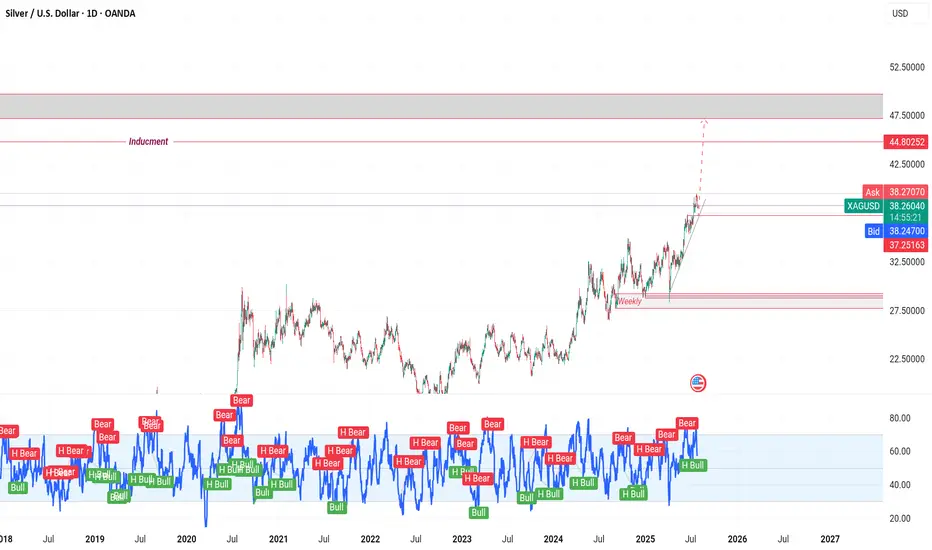
XAG/USD on high time frame
"Hello, for investors in XAG/USD, the $37 zone appears to be a low-risk area for buying. Both technical and fundamental analyses suggest that the price is likely to move higher towards $48."
If you require further insights or have additional information to discuss, feel free to share!

GBPUSD NEW LOOKaccording to H1 analysis GBP market is at support level we have good opportynity
go long from support level
Dont be greedy use money management
TRADE AT YOUR OWN RISK
REGARD ALBERT

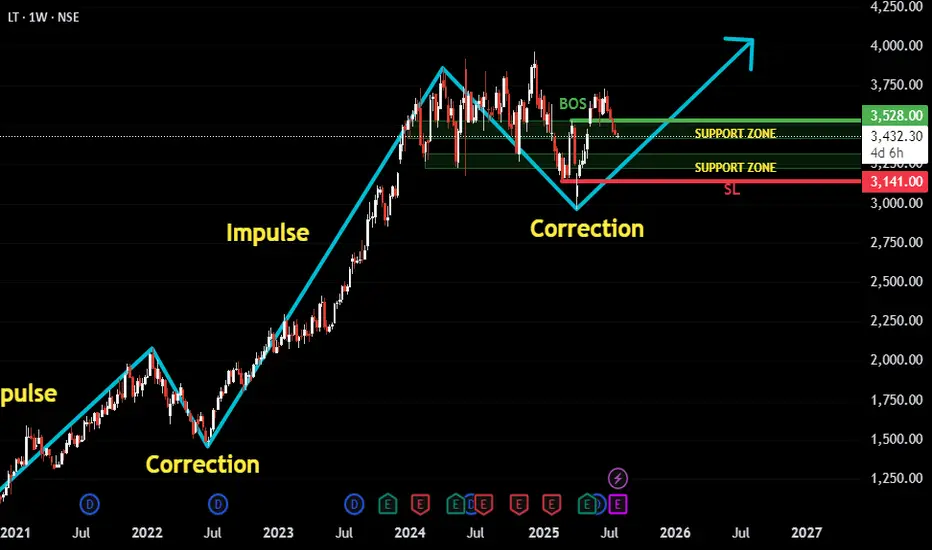
LT Following Classic Impulse-Correction Rhythm.This is a trend-following setup on LT (Larsen & Toubro) where we’ve observed a clear repeating pattern of Impulse → Correction → Impulse. The recent price action suggests that the latest correction has matured, and the structure now hints at a potential next impulse wave beginning.
Here’s the thought process behind the setup:
✅ The stock has been trending upward in a clean impulse-correction rhythm.
🕒 We waited patiently for the correction phase to develop fully and mature.
🔄 A Break of Structure occurred, signaling potential trend continuation.
🔁 Retest on support zones further strengthens the bullish case.
🧭 Support zones are drawn from the Daily chart for precision, though this post is based on the Weekly timeframe for broader trend visibility.
🛡️ Stop-loss can be maintained near ₹3141, just below key support.
🎯 Target is based on a 1:2 Risk-to-Reward setup, aligning with disciplined trading strategy.
Overall, this is a classic example of waiting for confirmation after correction before re-entering in the direction of the dominant trend.
As always, risk management is key. Watch how price behaves around the recent structure and support zones for validation.
GOAT Looks Bullish (12H)It seems that a wave A of a higher-degree structure has completed, and the price is forming a triangle at the bottom, preparing for an upward movement in the form of either a wave B or a new impulse wave. Since this wave belongs to a higher degree, we expect the upcoming bullish wave to take time and show a significant upward retracement.
Try to avoid entering during pumps, and instead focus on entries during price corrections.
As long as the green zone holds, the price has the potential to move upward.
A daily candle closing below the invalidation level will invalidate this outlook.
For risk management, please don't forget stop loss and capital management
When we reach the first target, save some profit and then change the stop to entry
Comment if you have any questions
Thank You

ALCH Looks Bearish (8H)ALCH is one of the altcoins that began its bullish rally earlier than others.
From the point where we placed the green arrow on the chart, it appears that an ABC correction has completed.
As long as the red box is maintained, price may move toward the FVG zone.
Targets are marked on the chart.
Additionally, a liquidity pool is forming below the candles, which is expected to be swept soon
A daily candle closing above the invalidation level would invalidate this bearish outlook.
For risk management, please don't forget stop loss and capital management
Comment if you have any questions
Thank You

EUR/USD – Testing Premium Zone, ECB & USD Macro Drive Next MoveEUR/USD – Testing Premium Zone, ECB & USD Macro Drive Next Move
EUR/USD is consolidating near 1.1770–1.1780, right inside the premium liquidity zone (0.786–0.886 Fib) and just below the Weak High at 1.1830. This level is critical for the next directional move.
Macro Landscape
ECB paused at 2.0% after eight consecutive cuts but may ease again in late 2025 as inflation trends toward 1.4% (ECB, 2025).
USD remains under pressure on expectations of Fed cuts, high fiscal deficits, and tariff concerns, creating a medium-term bias toward EUR strength (Reuters, 2025).
EU–U.S. trade deal at 15% tariff base reduces downside risks but does not fully remove growth headwinds (OECD, 2025).
Technical Outlook
Key Resistance: 1.1780–1.1830 (premium zone).
Upside Targets: 1.1905 (N) and 1.2085 (V) on breakout.
Support: 1.1680–1.1630 (Cloud/Kijun) and 1.1500 pivot for mean reversion.
VolanX DSS Signal:
Score: 58/100 (Neutral-to-Bullish)
Trend remains constructive but premium levels suggest a possible pullback unless the pair clears 1.1835 with momentum.
Plan:
Watch for a fade setup at 1.178–1.183 with stops >1.184.
A confirmed breakout above 1.1835 opens a run toward 1.19–1.21.
#EURUSD #Forex #MacroStrategy #ECB #CurrencyMarkets #TradingView
For educational purposes only. Not financial advice.

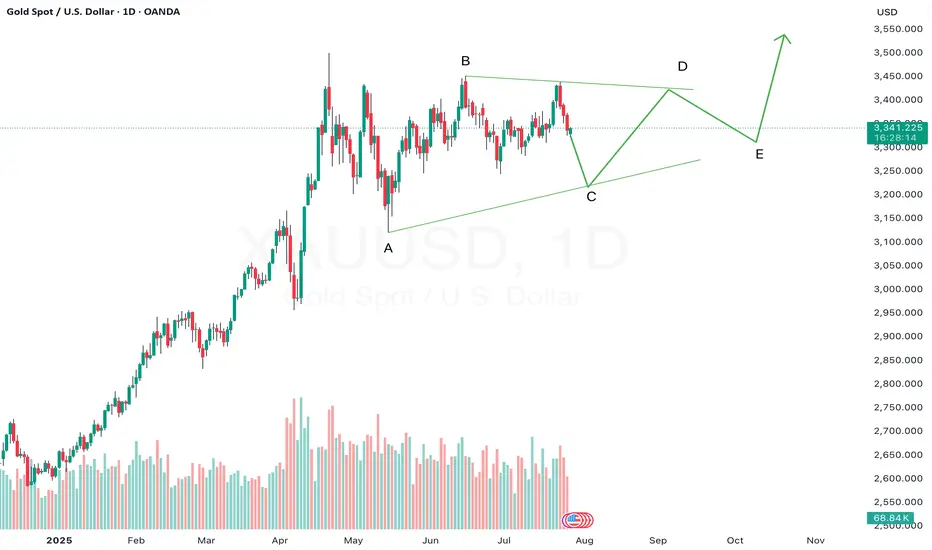
Gold may still be unfolding Wave C of a triangle — don’t rushGold appears to be forming a contracting triangle pattern, and we could currently be in the midst of Wave C. In a triangle structure (A-B-C-D-E), Wave C typically unfolds as a corrective move and is often mistaken for a potential breakout phase.
However, triangles are continuation patterns, and premature entries can lead to whipsaws or false breakouts. If Gold is indeed still in Wave C, we can expect further choppy, sideways movement before the pattern completes with Waves D and E.
Patience is key — let the structure mature. A more reliable opportunity may emerge after the triangle resolves and the larger trend resumes.
USD/JPY Technical Analysis - 4h Chart (Jul 24, 2025)
Key Observations:
Price Action (4h Close):
Open (O): 146.545
High (H): 146.660
Low (L): 146.448
Close (C): 146.473
Change: -0.036 (-0.028%) → Slight bearish momentum.
50% - Order Block:
Indicates a key retracement level where institutional traders may have placed orders.
Current price near 146.473 suggests potential consolidation or reversal if this level holds.
Profit Levels (Potential Targets):
Bullish Scenario (if USD strengthens):
147.170 → Minor resistance
147.956 → Stronger resistance
148.637 & 150.140 → Major upside targets
Bearish Scenario (if JPY strengthens):
146.450 → Immediate support
145.780 → Next key support
Context:
August Seasonal Trend: JPY often sees volatility in August due to fiscal flows and BoJ policy expectations.
Trading View Indicator: Likely referencing a custom strategy (e.g., breakout/mean reversion).
Trading Bias:
Neutral to Slightly Bearish (price closed below open, testing mid-range levels).
Watch 146.450 (support) and 147.170 (resistance) for breakout confirmation.
Key Levels:
Resistance Support
147.170 146.450
147.956 145.780
148.637
Actionable Idea:
A break below 146.450 could target 145.780.
A rebound above 147.170 opens path to 147.956.

SANTOS ANALYSIS (1D)Football-related tokens in the crypto market have been quiet for a while and seem to be dormant. One of the tokens that shows good inflow during its moves is SANTOS.
SANTOS appears to be forming a symmetrical triangle and is currently at the end of wave E. While there are multiple wave count scenarios for this token, it is sitting on a strong support zone.
As long as it holds the green zone, it has the potential to move toward the targets.
However, a daily candle closing below the invalidation level will invalidate this analysis.
For risk management, please don't forget stop loss and capital management
When we reach the first target, save some profit and then change the stop to entry
Comment if you have any questions
Thank You

GOLD Breakdown Setup | Clean Sell Targets Ahead!XAU/USD (Gold) Analysis – 2H Timeframe
After a clear rejection from higher levels, Gold has pulled back to retest the broken support zone around 3340–3350, which now acts as a resistance.
If the price sustains below this zone, we can expect a smooth move down toward clean liquidity areas below.
This is a textbook bearish continuation setup. 💥
🔻 Trade Idea – Short Setup:
• Sell Below: 3,340
• Target 1: 3,300
• Target 2: 3,280
• Stop Loss: 3,355 (above resistance zone)
🧠 Confluences:
• Bearish market structure
• Support zone retest
• Trend continuation
• High-impact USD news ahead (watch for volatility)
📅 Key Dates: July 30 – Aug 1
⚡ NY session could trigger the move!

Trading the Pullback on EURJPY My Trade PlanThe EURJPY is clearly in a strong bullish trend 📈, as shown by a consistent pattern of higher highs and higher lows on the 1H timeframe ⏱️. In this video, I’m looking to capitalize on a pullback as a potential buy opportunity 🎯.
We dive into my entry strategy, explore how to align with the prevailing trend, and break down key concepts such as price action, market structure, and smart pullback zones 🧠📊.
⚠️ As always, this is for educational purposes only — not financial advice.

VVV Looks Bullish (1D)From the point where we placed the red arrow on the chart, it seems that the bullish phase VVV has begun.
This phase can be considered as an ABC structure.
We appear to be in the late stages of wave B.
We have identified two entry points to join the continuation of the bullish phase VVV. The likelihood of Entry 2 being reached is low, but you should split the volume you want to invest in this coin into two parts and keep some for Entry 2.
The targets are marked on the chart.
A daily candle closing below the invalidation level will invalidate this analysis.
For risk management, please don't forget stop loss and capital management
When we reach the first target, save some profit and then change the stop to entry
Comment if you have any questions
Thank You

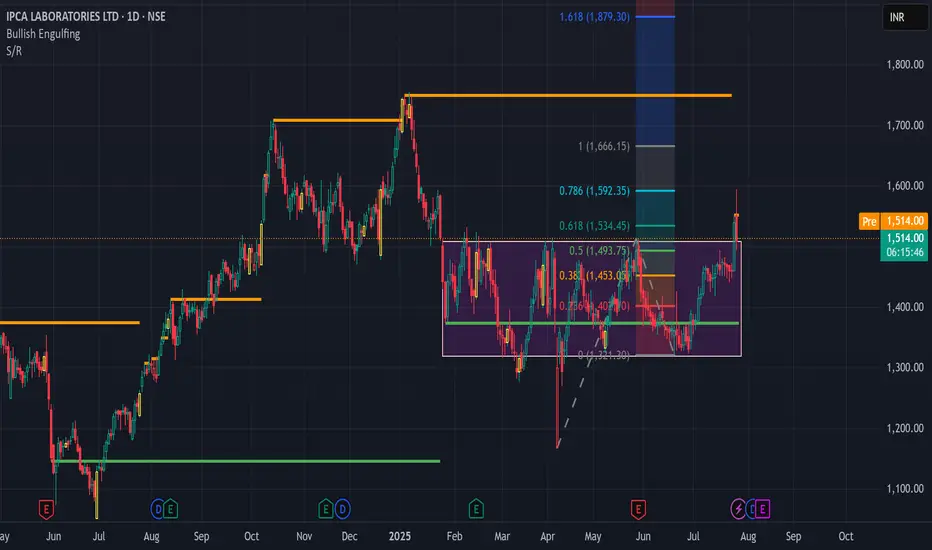
pcalabs BreakoutNSE:IPCALAB is making a Multi-month High. You can buy once it crosses 1552 and 1st Target would 1666. You can keep Second Target as 1800, provided try to achieve the same using Trailing Stoploss.
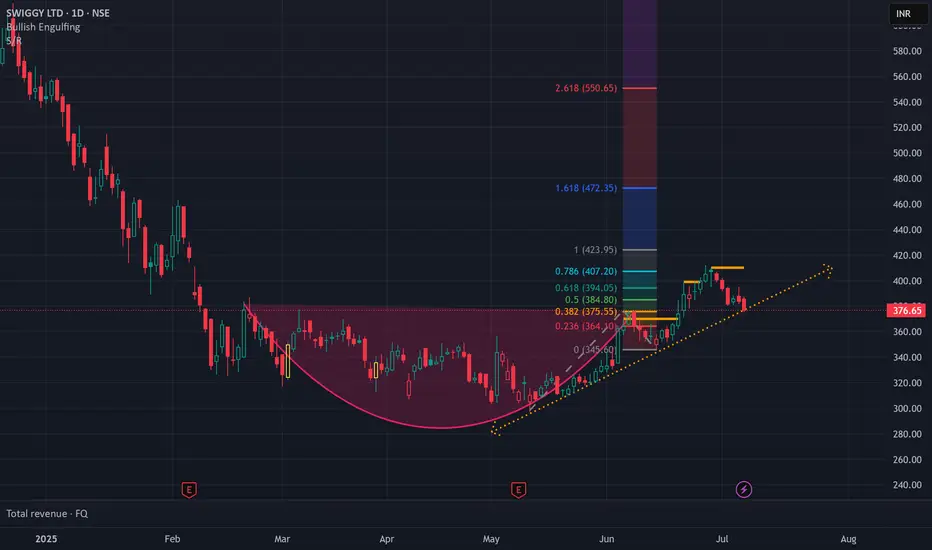
SWIGGY Breaking out of Rouding Bottom PatternNSE:SWIGGY is breaking out of Rouding Bottom Pattern. You can Buy at 398 and Target for 420. Keep Stop loss at 370. The Points that you will gain here is 22 points and since the stock price is less, you can invest a little more and try gaining more profit.
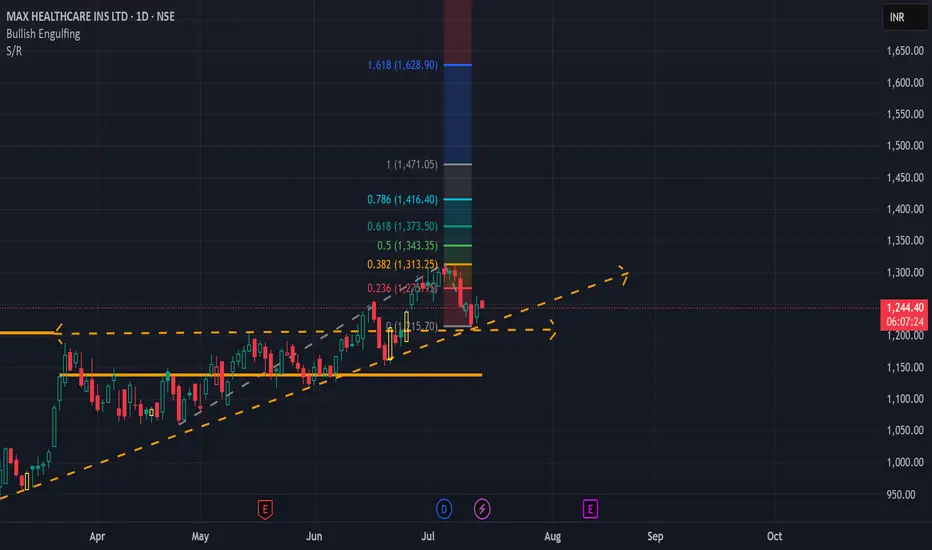
MAXHEALTH in BreakoutNSE:MAXHEALTH in breakout. You can Buy at 1265 and 1st Target would be 1470 and with trailing Stoploss you can achieve Second Target which would be 1600.
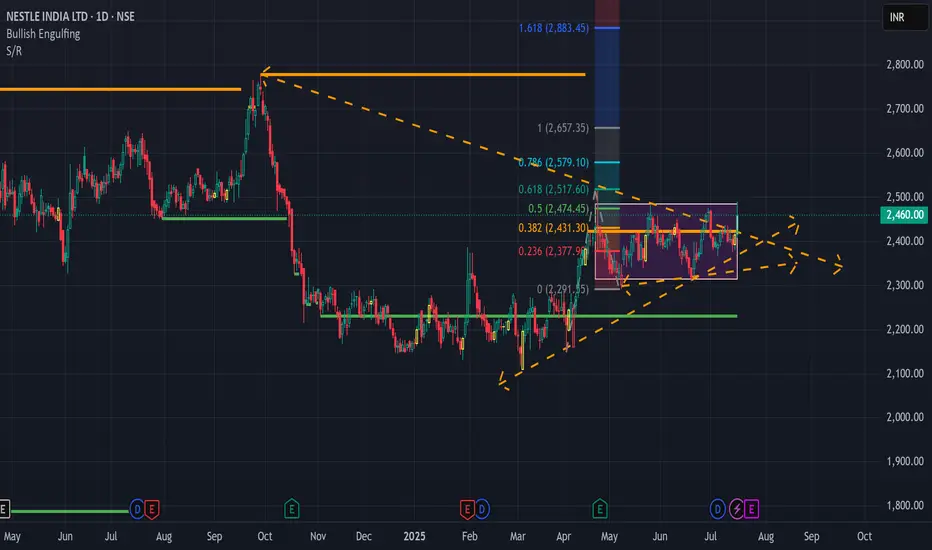
Nestle India in BreakoutNSE:NESTLEIND shows a breakout of a bullish ascending traingle trend. You can enter at 2460 and Target for 2640.
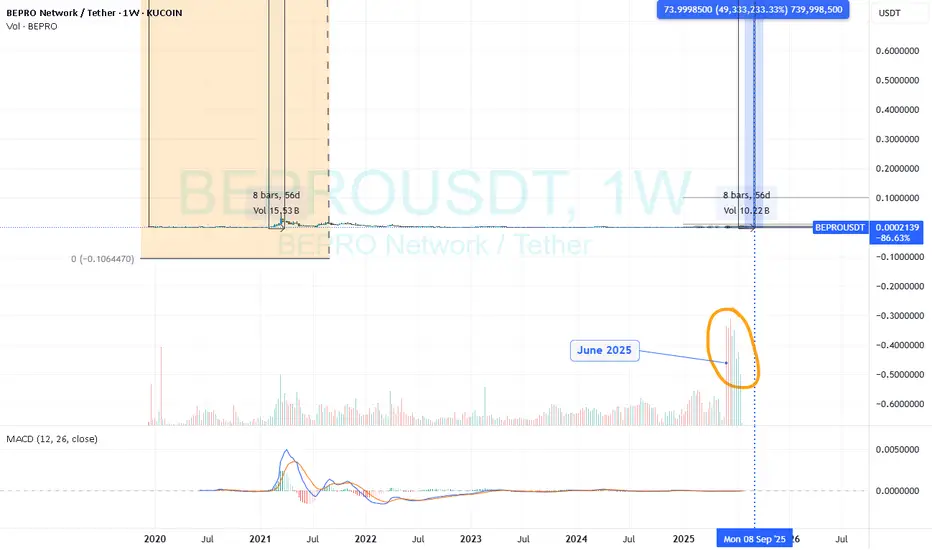
BEPRO ? Next GAMESTOP of cryptocurrencies
Hi
Watch it.
Is THIS the most underpriced speculating cryptocurrency?
www.kucoin.com
Listed : 18 Dec 2019
HIGH : 100$ per Bepro
Current : 0.0002000 approximate
GAMESTOP didn't have the sales numbers, but it had a lot of speculators.
From $2.57 to $483 in 2021
Market has always been unfair and irrational.
If you think it's fair .. how could BTC be priced at $0.06 /2010 $1.00 /2011
Digital picture for 1B$ .. what??
Speculation and crowd movement is real.
Since June 2025. We saw heavy purchases of Bepro (refer chart)
This momentum will build up and absorb sellers.
Below I had summary on Bepro.
Acc holder 30% :0xd6216fc19db775df9774a6e33526131da7d19a2c
Ref :https://coinmarketcap.com/currencies/bepro-network
Value: $500k ++
Background major hodl :https://etherscan.io/address/0xd6216fc19db775df9774a6e33526131da7d19a2c
Portfolio worth : $200m
This is a sophisticated trader/ investor.
Market cap Bepro: $2.06M as at 28/7/2025
Holders worldwide >10K.
Website : bepro.network
Previous owners Justin Wu : www.binance.com
www.tradingview.com
Type : Bepro real life users on google.
FB : bepro
Linkdn: bepro
NB: This is a speculation
Like I said all my post. I am not a guru.
You are masters of your own trades.
Do your own research.
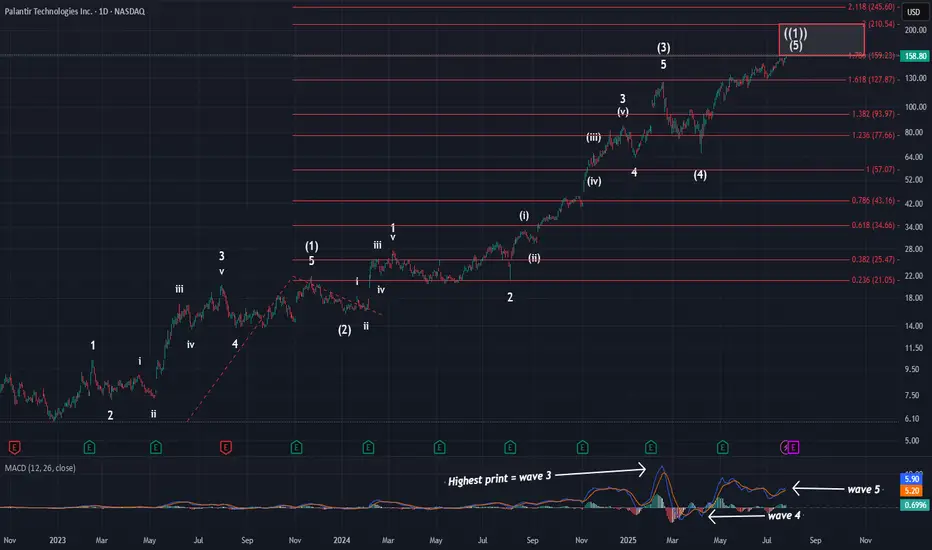
PalantirOn Friday, price hit the 1.236 extension and the larger red 1.786 extension @ $159. Tonight, I wanted to zoom out to show you where price is in the grand scheme of things. As you can see, we have all of the needed waves in place to consider this larger pattern complete. We have finally hit the standard target box for primary wave ((1)), and almost finished on what I am calling a smaller degree ED. This means that the reversal is soon at hand and that the initial move lower will be swift.
This primary wave ((1)) has lasted over 2.5 years. However, there is no way to predict exactly how long primary wave ((2)) will last. It could be short, or it could be long. Primary waves typically last months to even years to complete. Given the length of wave ((1)), I think it is safe to say wave ((2)) is likely to last over 1 year at the minimum. When our consolidation does kick off, we should be targeting the $50-$80 range for completion. Again, that won't happen fast. I will very likely take at least a year to complete.
For now, though, in the short term this pattern is putting the finishing touches on. Seeing this zoomed out picture again hopefully puts into perspective exactly how close we are to completion.
P.S: Looking at MACD, you can see I have labeled the larger waves. You can also see how much hidden bearish div we have at this time.
KEMANA GOLD KEDEPAN NYA ?📊 Technical Analysis – XAUUSD (July 28, 2025)
Elliott Wave Structure – Triangle (ABCDE):
The chart clearly shows a contracting triangle pattern (ABCDE), which commonly appears during corrective waves (usually Wave 4 or Wave B in a larger degree).
Currently, price seems to have just completed Wave E, and it's showing early signs of a bounce from the triangle's lower support.
If this wave count is valid, we could expect a bullish breakout soon, continuing the previous trend (most likely upward if this is part of Wave (5)).
🧭 Key Support and Resistance Levels:
Triangle Support (Wave E area):
Around $3,325 – $3,336 (price is currently testing this zone)
Potential Bullish Targets (if breakout occurs):
🎯 $3,374
🎯 $3,414
🎯 $3,498 – $3,500 (major resistance zone / Wave 5 target)
🧠 Fundamental Outlook Supporting Gold (Forward-Looking)
✅ Bullish Drivers:
Fed Rate Cut Expectations (Late 2025):
Slowing inflation → Rate cuts expected → Positive for gold.
Weaker US Dollar:
A weaker dollar makes gold cheaper for international buyers → Bullish.
Global Geopolitical Tensions:
Rising uncertainty supports gold as a safe haven asset.
⚠️ Bearish Risks:
Strong US economic data (e.g., NFP beats or rising inflation) could lead to the Fed staying hawkish → Negative for gold.
If price breaks below triangle support ($3,325), the triangle structure would be invalidated and a larger correction could unfold.
📝 Summary & Trading Strategy:
Direction Entry Area Stop Loss TP 1 TP 2 TP 3
✅ Buy (preferred) $3,330 – $3,336 Below $3,310 $3,374 $3,414 $3,498–$3,500
❌ Sell (if breakdown) Below $3,320 Above $3,340 $3,265 $3,245 $3,118

Is USDCHF Ready to Drop? Short Setup Explained📉 USDCHF Trade Idea Breakdown
Taking a close look at USDCHF, we’re currently in a clear downtrend 🔻. Price is under pressure on the higher timeframes, but on the lower timeframes (15m & 30m), we’re seeing a pullback 🌀.
What I’m watching for now is a rejection at resistance 🔄 followed by a bearish break in market structure ⛔️. If that confirms, I’ll be looking to take a short entry with targets set at the two previous lows marked out in the video 🎯📉.
Stop loss placement would be just above the recent swing high for risk management 🛑.
As always — this is not financial advice ⚠️.

Gold under pressure as USD strengthensGold is facing significant selling pressure as the US dollar regains momentum. Currently, XAU/USD is trading near $3,337, down over $31 from the session high, and pressing directly against the ascending trendline.
The stronger USD is making gold—an asset that yields no interest—less attractive to investors. If this dollar strength continues, the likelihood of a trendline break and further downside is very high.
On the economic front, U.S. jobless claims have fallen to their lowest level in three months, signaling a resilient labor market despite sluggish hiring. This stable jobs data is expected to support the Fed’s decision to hold interest rates steady at 4.25–4.50% in the upcoming policy meeting, even amid rising inflation pressure driven by President Donald Trump’s tariff policies.
At this moment, sellers are in control. Traders should closely watch upcoming support zones and trading volume to spot reasonable entry points.
Good luck!
