GOLD Is Going Down! Short!
Please, check our technical outlook for GOLD.
Time Frame: 2h
Current Trend: Bearish
Sentiment: Overbought (based on 7-period RSI)
Forecast: Bearish
The price is testing a key resistance 3,363.11.
Taking into consideration the current market trend & overbought RSI, chances will be high to see a bearish movement to the downside at least to 3,342.15 level.
P.S
Please, note that an oversold/overbought condition can last for a long time, and therefore being oversold/overbought doesn't mean a price rally will come soon, or at all.
Disclosure: I am part of Trade Nation's Influencer program and receive a monthly fee for using their TradingView charts in my analysis.
Like and subscribe and comment my ideas if you enjoy them!
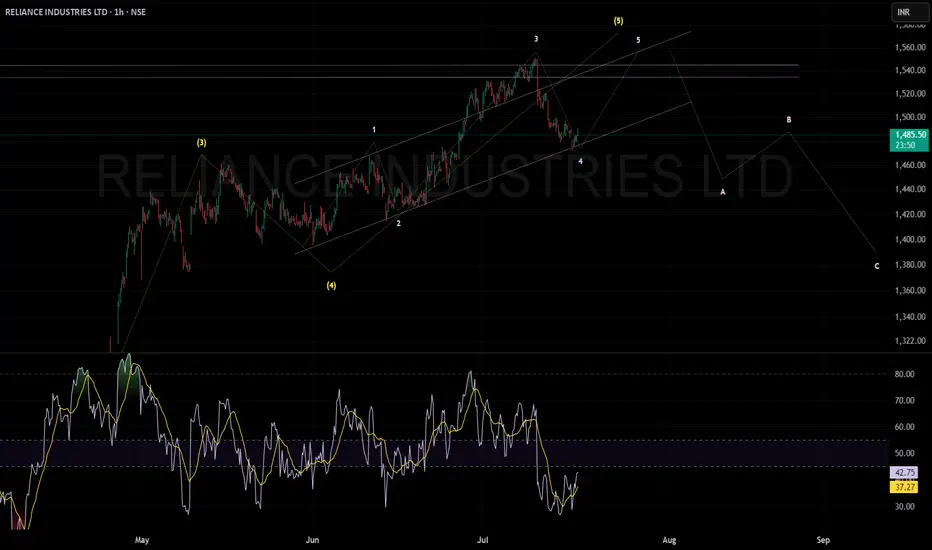
Wave Analysis

RELIANCE INDUSTRIES CAN MOVE UP IN 5TH WAVEReliance Industries appears poised to complete its final bullish wave with an upward move toward 1550, following which a corrective retracement is likely.
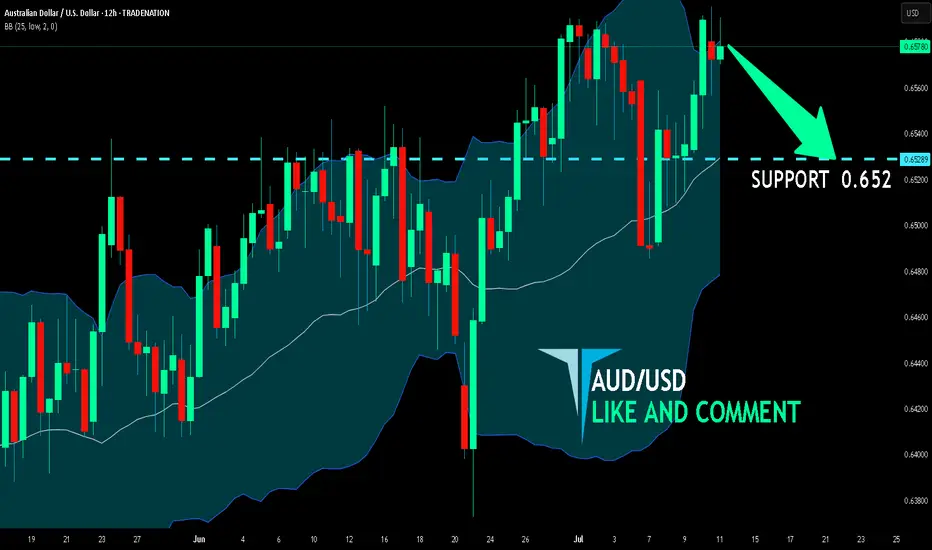
AUD/USD BEARS WILL DOMINATE THE MARKET|SHORT
Hello, Friends!
We are now examining the AUD/USD pair and we can see that the pair is going up locally while also being in a uptrend on the 1W TF. But there is also a powerful signal from the BB upper band being nearby, indicating that the pair is overbought so we can go short from the resistance line above and a target at 0.652 level.
Disclosure: I am part of Trade Nation's Influencer program and receive a monthly fee for using their TradingView charts in my analysis.
✅LIKE AND COMMENT MY IDEAS✅
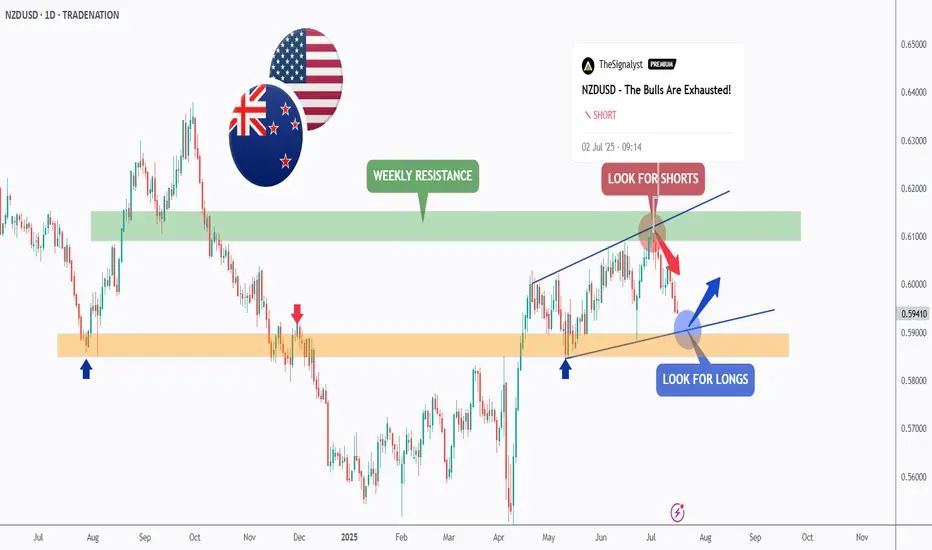
NZDUSD - It is Time!Hello TradingView Family / Fellow Traders. This is Richard, also known as theSignalyst.
As per our last NZDUSD analysis, attached on the chart, it rejected the upper bound of the blue wedge pattern and traded lower.
📈This week, NZDUSD is retesting the lower bound of the wedge.
Moreover, the orange zone is a strong weekly support.
🏹 Thus, the highlighted blue circle is a strong area to look for buy setups as it is the intersection of the lower blue trendline and orange support.
📚 As per my trading style:
As #NZDUSD approaches the blue circle zone, I will be looking for bullish reversal setups (like a double bottom pattern, trendline break , and so on...)
📚 Always follow your trading plan regarding entry, risk management, and trade management.
Good luck!
All Strategies Are Good; If Managed Properly!
~Rich
Disclosure: I am part of Trade Nation's Influencer program and receive a monthly fee for using their TradingView charts in my analysis.
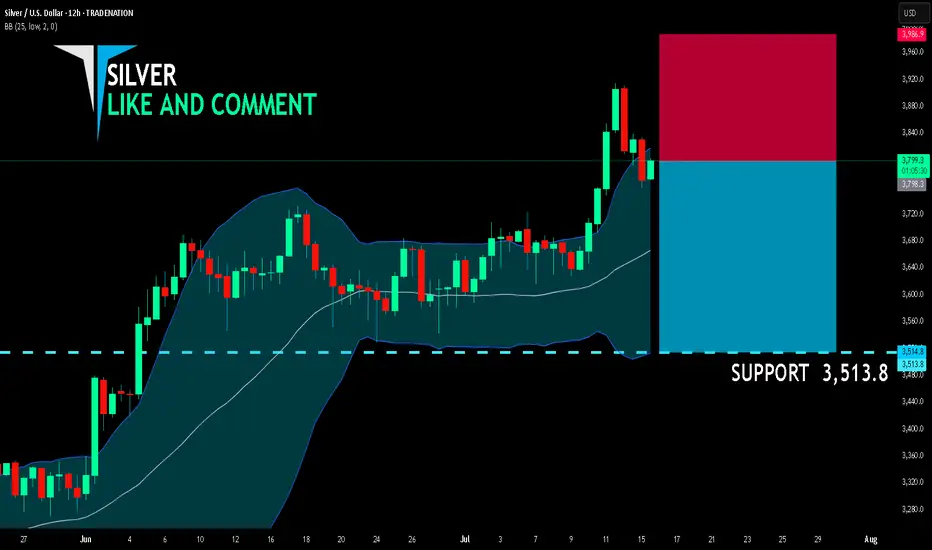
SILVER SELLERS WILL DOMINATE THE MARKET|SHORT
SILVER SIGNAL
Trade Direction: short
Entry Level: 3,798.3
Target Level: 3,513.8
Stop Loss: 3,986.9
RISK PROFILE
Risk level: medium
Suggested risk: 1%
Timeframe: 12h
Disclosure: I am part of Trade Nation's Influencer program and receive a monthly fee for using their TradingView charts in my analysis.
✅LIKE AND COMMENT MY IDEAS✅
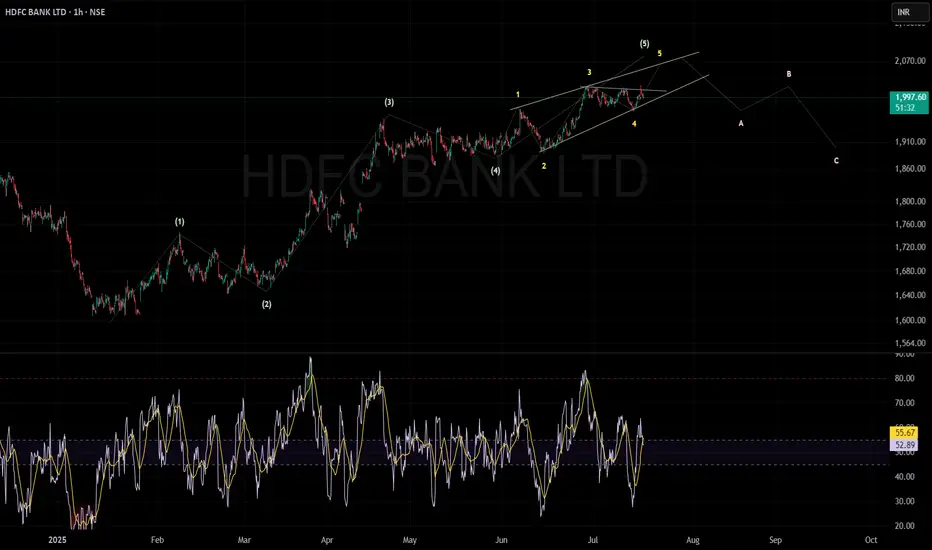
HDFC BANK can move 5th wave upHDFC Bank is currently in the last (5th) wave of an uptrend. This wave is moving inside a narrow, rising wedge pattern called an ending diagonal.
The price can move higher towards ₹2,050–₹2,100 before the trend finishes.
If the price breaks below the bottom of the wedge pattern (ending diagonal), it could confirm a trend reversal, likely leading to a correction.
After the peak, the chart suggests a three-step drop (A, B, and C waves), with possible support around ₹1,910 and then ₹1,850.
The RSI (Relative Strength Index) is around 53, meaning the trend isn't overbought or oversold yet.
In short: The uptrend is close to ending. Watch for a break below the wedge—this could start a move down toward ₹1,910 first, then maybe ₹1,850.
BTC Nearing Completion of Wave 3 – Correction Ahead?Bitcoin is approaching the end of its Wave 3 movement, which suggests a possible correction phase in the near future.
However, this is likely just a temporary pause before the next bullish wave continues the uptrend.
Stay patient and watch for key support levels to prepare for the next buying opportunity.

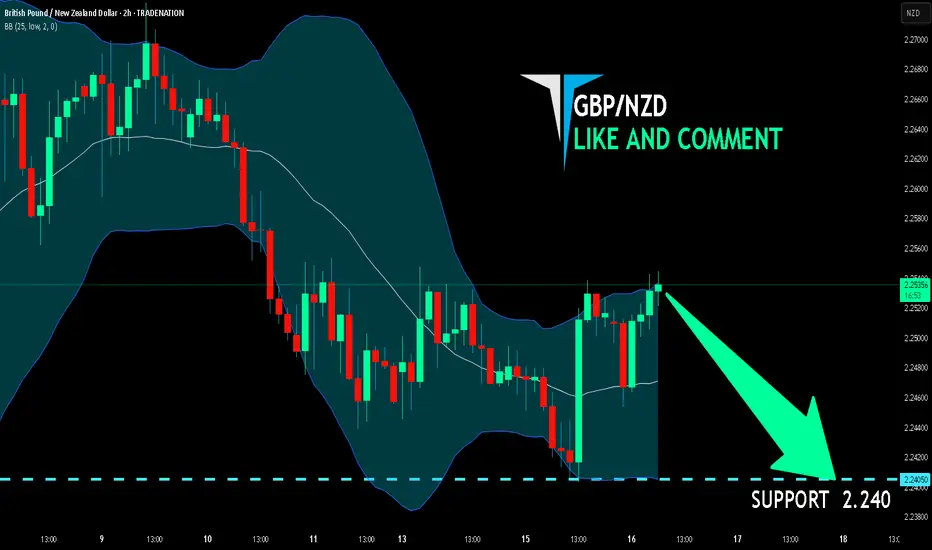
GBP/NZD BEST PLACE TO SELL FROM|SHORT
Hello, Friends!
It makes sense for us to go short on GBP/NZD right now from the resistance line above with the target of 2.240 because of the confluence of the two strong factors which are the general downtrend on the previous 1W candle and the overbought situation on the lower TF determined by it’s proximity to the upper BB band.
Disclosure: I am part of Trade Nation's Influencer program and receive a monthly fee for using their TradingView charts in my analysis.
✅LIKE AND COMMENT MY IDEAS✅
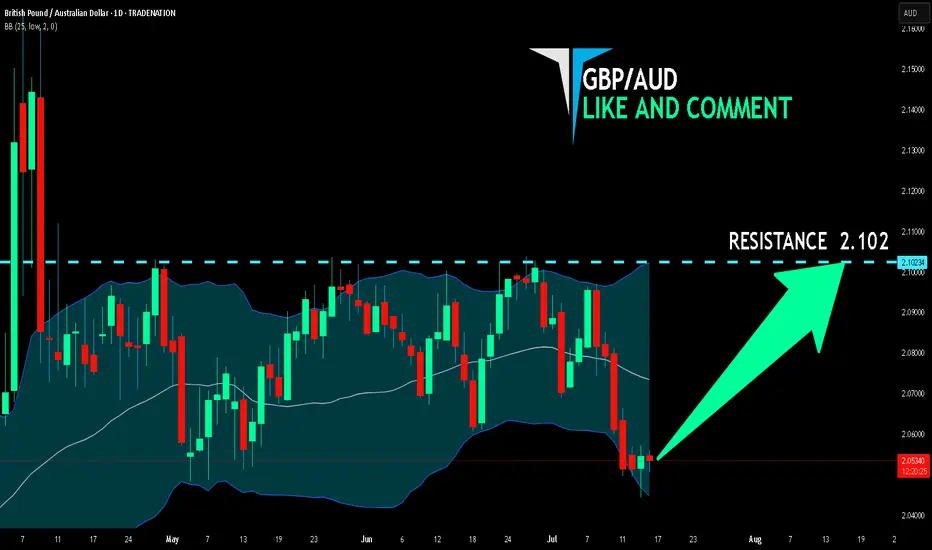
GBP/AUD BULLS ARE STRONG HERE|LONG
Hello, Friends!
Previous week’s red candle means that for us the GBP/AUD pair is in the downtrend. And the current movement leg was also down but the support line will be hit soon and lower BB band proximity will signal an oversold condition so we will go for a counter-trend long trade with the target being at 2.102.
Disclosure: I am part of Trade Nation's Influencer program and receive a monthly fee for using their TradingView charts in my analysis.
✅LIKE AND COMMENT MY IDEAS✅
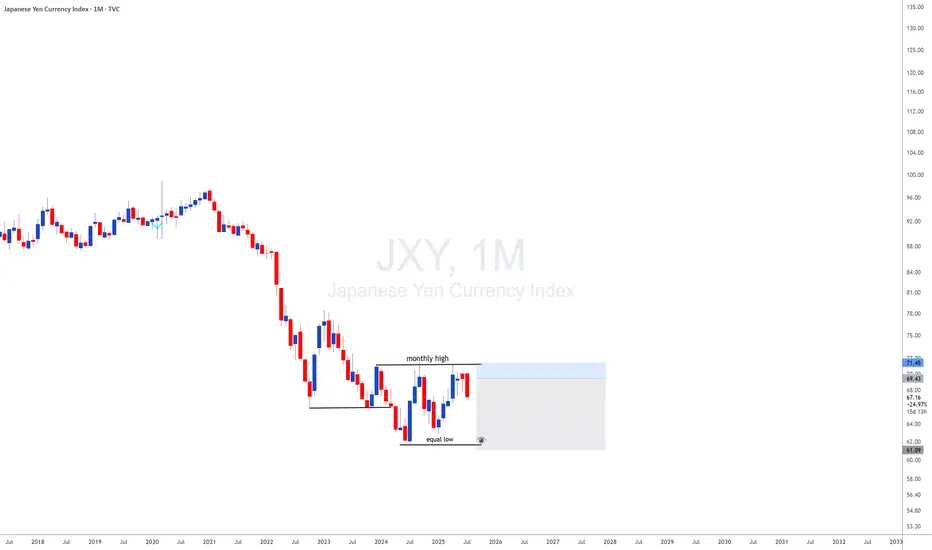
JXY with JXY looking monthly downside and DXY looing upside i will be looking for 35 years breakout of usdjpy meanning uj is a long therm upside
How to View the Assets in Japan
It should be noted that many of the assets the government owns are not marketable, or, if so, their
price can sharply drop in the case of fiscal crisis. Therefore, the financial situation should be assessed
first by gross debt.
In addition, the assets earmarked with the liabilities (such as pension reserves and FILP loans) are
not directly related to fiscal consolidation because they are not included in “Bonds outstanding of
central and local governments”, which is the benchmark of fiscal consolidation target
Buy Idea: FAUJI FERTILIZER CO LTD (PSX)🔷 Buy Idea: FAUJI FERTILIZER CO LTD (PSX)
Context:
Price tapped into a discount zone, swept liquidity below the recent lows, and formed a strong bullish engulfing candle. The setup aligns with a low resistance liquidity run toward the higher timeframe distribution zone.
✅ Entry Criteria:
Entry: Above the bullish candle close at ~366
Stop Loss: Below the recent swing low at ~323
Target: Monthly resistance / low resistance area at ~435
RR Ratio: ~1:2.5+
📊 Justification:
Liquidity Sweep: Price swept the previous low (creating inducement)
FVG Reaction: Immediate bullish reaction from the demand/FVG zone
Distribution Zone Targeted: Market is likely to grab liquidity from unfilled sell orders in the upper zone
No major resistance till 435 (clean traffic)
⚠️ Risk Notes:
Confirm daily candle closes above 366 before entry
Monitor any reaction at ~390-400 distribution zone

Gold is Moving Sideways – A Potential Triangle Formation?Gold is currently trading in a sideways pattern, potentially forming a triangle consolidation. This type of setup often precedes a strong breakout. At the moment, price action is showing hesitation near key resistance. Traders should wait for a confirmed breakout above the upper boundary of the triangle to validate a bullish continuation.
Patience is key—wait for the breakout before taking action.

Bitcoin Buy Bias – On-Chain Confidence Still Has Room to RunThe On-chain Confidence indicator is showing signs of increasing sell pressure and profit-taking, but it still remains well below the historical peaks seen in previous bull market tops (2017 & 2021).
👉 This is a composite indicator combining several key on-chain metrics like RHODL Ratio, Puell Multiple, and MVRV, among others.
📊 The current level resembles early 2024 and early 2025, suggesting we are not yet at extreme sentiment levels.
If this indicator continues to climb toward its previous cycle highs, it may signal that we’re entering the final leg of this bull run. For now, there’s still room for upside momentum.

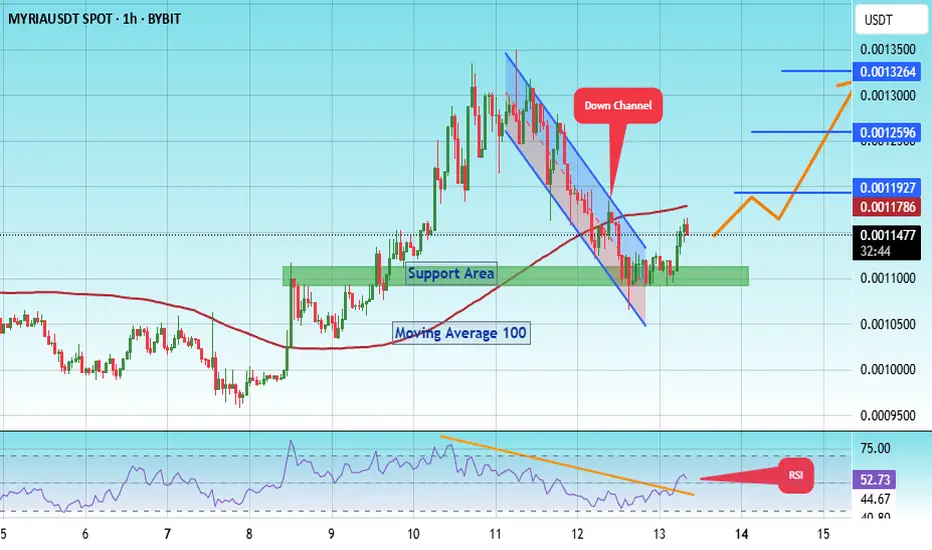
#MYRIA/USDT Ready to go up ?#MYRIA
The price is moving within a descending channel on the 1-hour frame, adhering well to it, and is on its way to breaking it strongly upwards and retesting it.
We have a bounce from the lower boundary of the descending channel. This support is at 0.0010600.
We have a downtrend on the RSI indicator that is about to break and retest, supporting the upward trend.
There is a key support area in green at 0.0010936, which represents a strong basis for the upward trend.
Don't forget one simple thing: ease and capital.
When you reach the first target, save some money and then change your stop-loss order to an entry order.
For inquiries, please leave a comment.
We have a trend of stability above the Moving Average 100.
Entry price: 0.0011500
First target: 0.0011900
Second target: 0.0012600
Third target: 0.0013264
Don't forget one simple thing: ease and capital.
When you reach the first target, save some money and then change your stop-loss order to an entry order.
For inquiries, please leave a comment.
Thank you.
us30 to break down us30 to break down
bears to take control - as shown in zigzag manne
swing low broken
volumes drying up
stoploss will be swing high

CAD JPY Trade setup of Cadjpy .... Dtf HH to Hl
Fib level of Dtf
Fib level of 1hr
and Fvg Gap
also Mention Entry level
Sl and tp

possibility bof uptrendIt is expected that some fluctuation and correction will form within the current resistance zone, then there is a possibility of a trend change and the start of a downtrend.
As long as the index does not stabilize above the green resistance zone, a downtrend is likely.

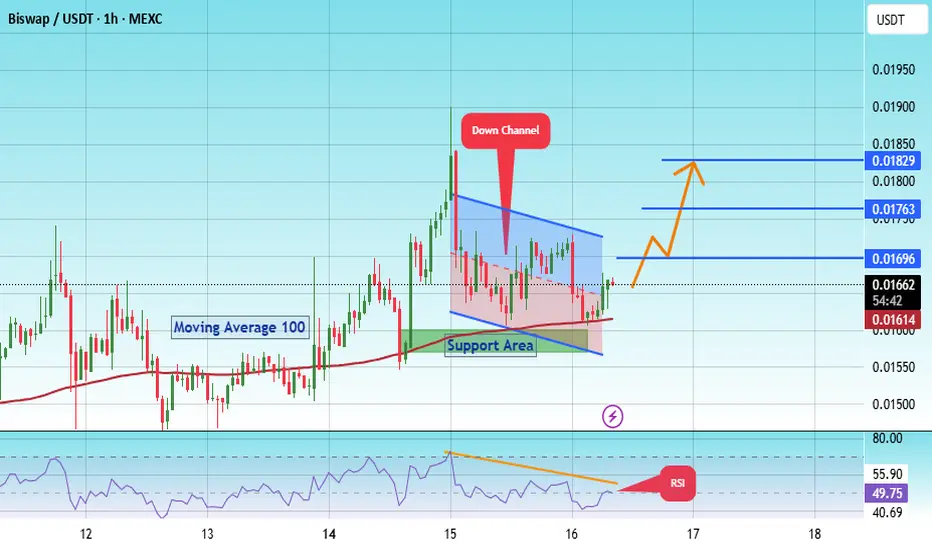
#BSW/USDT is bullish engulfing and also took ?#BSW
The price is moving within a descending channel on the 1-hour frame, adhering well to it, and is on its way to breaking it strongly upwards and retesting it.
We have a bounce from the lower boundary of the descending channel. This support is at 0.01580.
We have a downtrend on the RSI indicator that is about to break and retest, supporting the upward move.
There is a key support area in green at 0.01573, which represents a strong basis for the upward move.
Don't forget one simple thing: ease and capital.
When you reach the first target, save some money and then change your stop-loss order to an entry order.
For inquiries, please leave a comment.
We have a trend of stability above the Moving Average 100.
Entry price: 0.01650
First target: 0.01696
Second target: 0.01763
Third target: 0.01829
Don't forget one simple thing: ease and capital.
When you reach the first target, save some money and then change your stop-loss order to an entry order.
For inquiries, please leave a comment.
Thank you.
check the trendIt is expected that a trend change will form within the current support area and we will witness the beginning of the upward trend.
If the price breaks through the support zone, the continuation of the correction is likely.
If the price breaks through the support levels, the continuation of the downtrend is likely.

Sell eurjpyThis selling zone looking much strong
Daily and weekly already too overbought
6 continously weekly buy candels
Now bearish correction expected to change the trend
Wait for short time frame confirmation then enter into sell long term with minimum 700 pips target

uptrendGiven the support trend line being broken, it is expected that the upward trend will form up to the specified resistance area and then a trend change will be likely. Then the continuation of the downward trend will be possible.

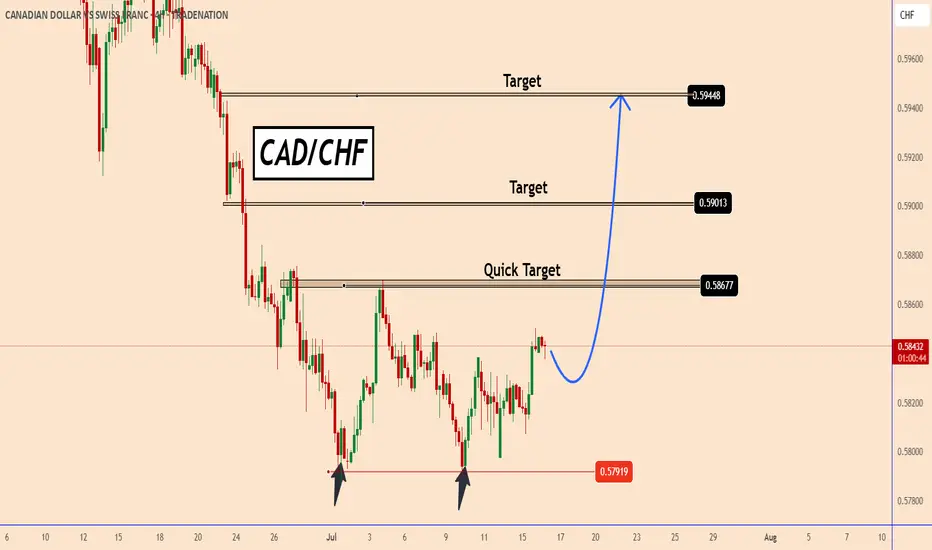
CADCHF found strong support zone near 0.5790CADCHF found a strong support zone near 0.5790
The chances are that the price already completed a doubt bottom pattern. It is not confirmed yet but the support zone is already too strong.
The price may face a strong resistance near the first target 0.5870 that is also the strongest target. Once the price moves above that zone it should rise further to the other targets near 0.5900 and 0.5945
You may find more details in the chart!
Thank you and Good Luck!
PS: Please support with a like or comment if you find this analysis useful for your trading day
Disclosure: I am part of Trade Nation's Influencer program and receive a monthly fee for using their TradingView charts in my analysis.
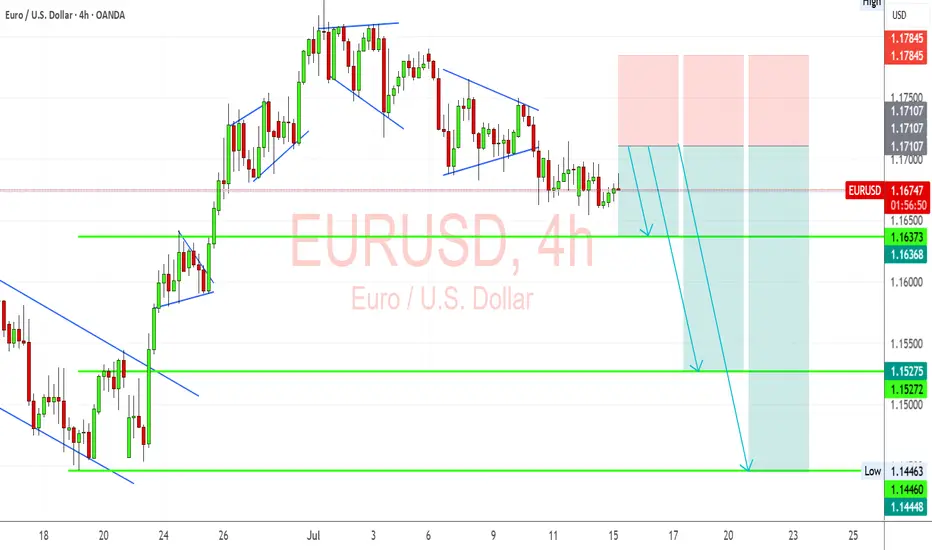
EURUSD Bearish Ahead as US Resilience Meets Eurozone FragilityEURUSD has shifted into bearish territory, pressured by growing divergence between a resilient US economy and a struggling Eurozone. The pair recently rejected the 1.1700 zone, forming multiple bearish structures on the 4H chart. With sticky US inflation, Trump’s renewed tariff agenda, and a dovish ECB, EUR/USD appears poised for a deeper move toward 1.1527 and possibly 1.1445 in the coming sessions. This setup is both technically and fundamentally aligned, but key event risk remains.
🔸 Technical Structure (4H)
Clear rejection from the 1.1700–1.1710 zone.
Bearish pennants and wedge patterns confirm continuation lower.
Downside targets:
🔹 First: 1.1637
🔹 Second: 1.1527
🔹 Final: 1.1445
Risk zone: Above 1.1785 (invalidates short bias if broken cleanly).
🧭 Key Fundamentals
🇺🇸 Dollar Strength: Sticky inflation, stable labor market, and geopolitical risk all favor USD demand.
🇪🇺 Euro Weakness: ECB dovish tone persists amid weak data, soft PMIs, and stagnating growth.
Yield Spread: US-Euro real yield spread supports further EUR/USD downside.
Tariff Pressure: Trump’s 50% tariff plan and tensions with the EU weigh on EUR.
⚠️ Risks to Watch
A surprise dovish pivot from the Fed.
Weak US CPI or disappointing retail sales.
Major risk-on flows that trigger broad USD weakness.
New EU fiscal stimulus or Germany/France recovery surprises.
📆 Key Events Ahead
🇺🇸 US Core CPI – A hot print supports USD strength.
🇺🇸 Retail Sales & Powell testimony – Watch tone on rate cuts.
🇪🇺 German ZEW Sentiment, Eurozone HICP inflation – Weak readings would further drag EUR.
🔄 Leader or Lagger?
EUR/USD is a lagger to GBP/USD, often following UK-driven USD moves.
Acts as a leader for EUR/JPY, EUR/AUD, EUR/CHF – weakness here cascades across EUR crosses.
Tracks broad USD sentiment – dovish Fed pricing boosts EURUSD, while rate hike fears drag it.
✅ Summary: Bias and Watchpoints
EUR/USD is bearish below 1.1700 as economic divergence, sticky US inflation, and rising geopolitical tensions favor the dollar. ECB policy remains soft, offering little support to the euro. Key risk lies in a dovish Fed pivot or softer US data. Watch US CPI and Powell for clues. This pair is likely to lag GBP/USD moves, but will lead EUR crosses lower if the downside momentum continues.