BTCUSDBTCUSD is correcting for more upside, last drop can happen just to complete the structure before upside starts again.
Disclosure: We are part of Trade Nation's Influencer program and receive a monthly fee for using their TradingView charts in our analysis.
Wave Analysis

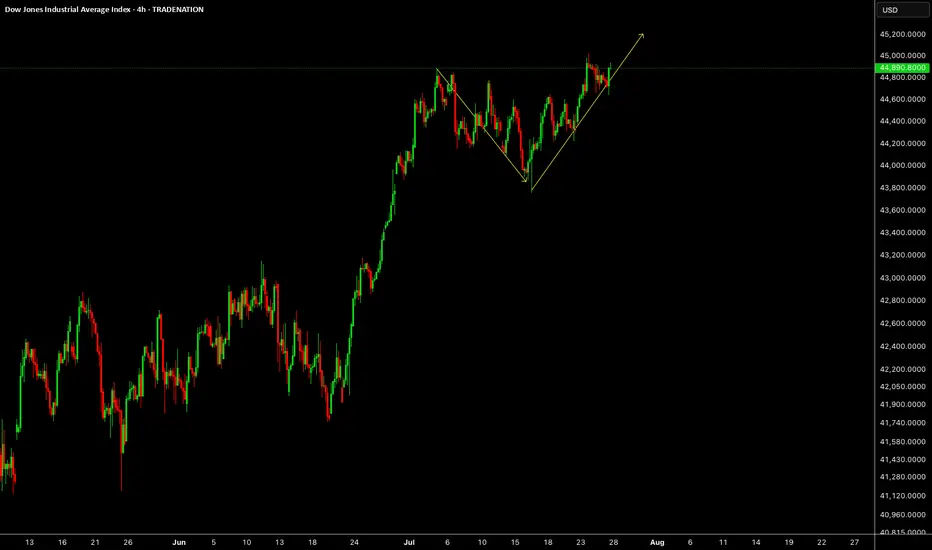
US30US30 needs some more upside short term towards 45.2K level.
Disclosure: We are part of Trade Nation's Influencer program and receive a monthly fee for using their TradingView charts in our analysis.
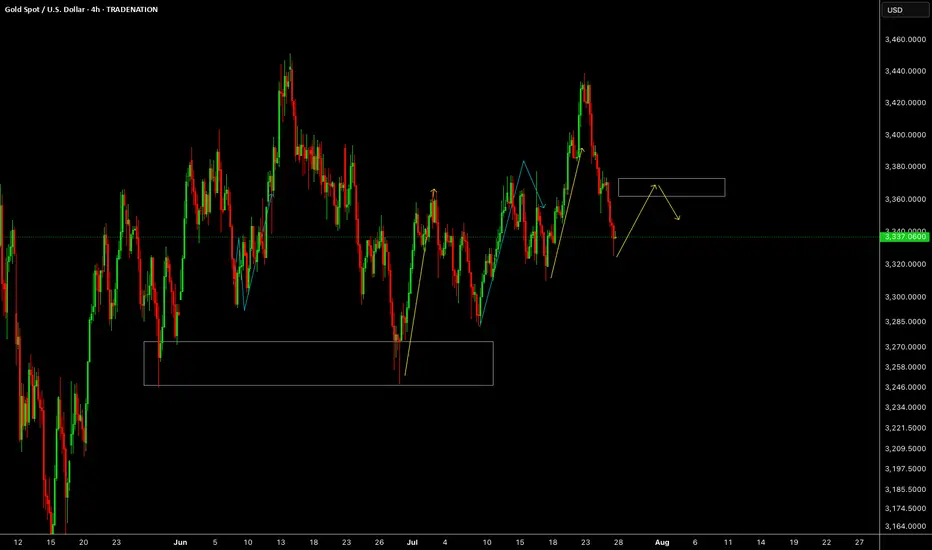
GOLDGOLD looks like it will be giving us correction or impulse up early part of this week. Reaction will be above 3360.
Disclosure: We are part of Trade Nation's Influencer program and receive a monthly fee for using their TradingView charts in our analysis.
GBPUSDGBPUSD needs small correction and one more drop before upside.
Disclosure: We are part of Trade Nation's Influencer program and receive a monthly fee for using their TradingView charts in our analysis.

EURUSDEURUSD needs one more up after correction to break last week's high.
Disclosure: We are part of Trade Nation's Influencer program and receive a monthly fee for using their TradingView charts in our analysis.

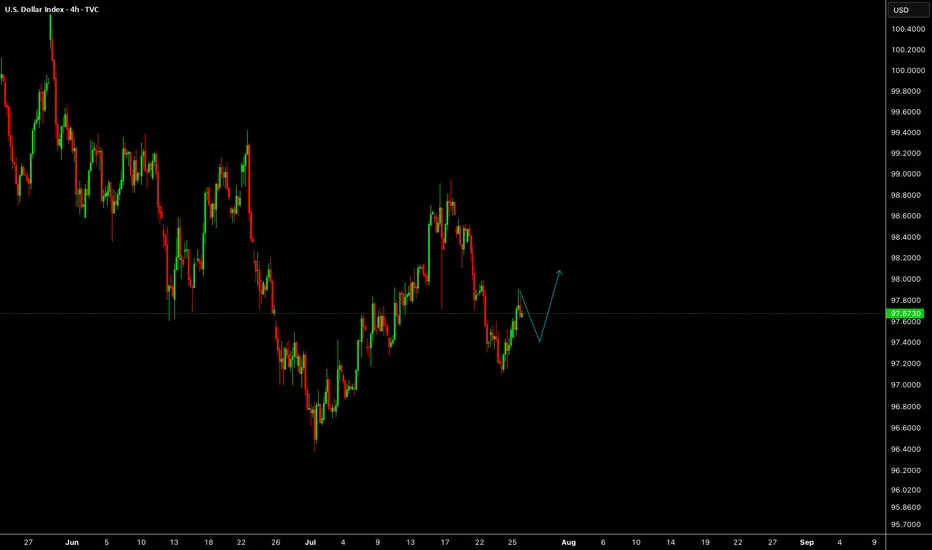
DXYDXY needs some more correction, if the correction is completed before Feds decision then a drop can follow otherwise Feds will push it up and NFP will drop it again.
Disclosure: We are part of Trade Nation's Influencer program and receive a monthly fee for using their TradingView charts in our analysis.
DR LALPATH LABS - LONGNSE:LALPATHLAB Weekly outperforming stock with active buyers. May be continue bullish rally one to three weeks more.

BTC Price Prediction and Elliott Wave AnalysisHello friends,
>> Thank you for joining me in my analysis. I think we have finished the 1st wave in B wave as Pink W, in this micro correction. In my opinion, we will watch 2nd & 3rd waves XY as in pink color, or Yellow B wave ended successfully, just I need to these confirmations:
* Day TF: Breaking 118451 for the next days and keep on above it, lead to ending B wave successfully.
* 4Hr TF: Breaking 118451 for the next hours and keep on above it, lead to ending W wave successfully ( maybe also B ?)
keep like and support me to continue, See you soon!
Thanks, Bros

WHO WILL WIN BITCOIN'S RANGE BATTLE? In this weeks analysis, Bitcoin has been stack in a tight range for almost two weeks now. Trading range between $115k and $120k. Trend is still holding up for Bullish continuation but indicators strongly cautions loud Sirens. A decisive daily close above $120,200 could be the winning whistle for Bullish Continuation, while I see selling pressure to continue to the Support Block of about 113k. Also the selling Volumes are huge but prices are always quickly absorbed suggesting an accumulation is happening more than a distribution. So my thesis for Bitcoin is sideways range bound until there is a clear market winner. I will be paying much attention to the bearish alarm and a breakdown will be confirmed when daily price decisively close below $115k confirming the divergences on the chart. Trading between the range is high risk.

Long Position on Dow Jones Industrial Average
Initiating a long position at 44,456, supported by robust economic data and stronger-than-expected corporate earnings. These indicators point to continued resilience in the U.S. economy, potentially allowing the Federal Reserve to consider rate cuts sooner than previously anticipated — a positive catalyst for equities.
📌 Entry: 44,456
🛑 Stop Loss: 44,207
🎯 Take Profit: 44,900
Monitoring price action closely as market sentiment continues to shift in response to macroeconomic developments.

Strategic Long Position on Ethereum (ETH)
Ethereum's funding rates have spiked, reflecting an overcrowded long side. Such conditions often precede a long squeeze, as the market seeks to shake out overleveraged traders.
Despite this risk, the current bullish momentum justifies a tiered entry approach:
First Entry (Market Order): 3,790
Second Entry (Limit Order): 3,550
🛑 Stop Loss (for both entries): 3,400
🎯 Take Profit Target: 4,200
This setup allows participation in the upward trend while leaving room

Potential Long on WTI
Crude oil is showing potential for a bullish move due to increasing speculation about a possible agreement between China and the United States.
As we approach August 1st – the date associated with Trump's proposed tariff actions – the chances of a diplomatic breakthrough are growing.
If the two economic giants reach any form of understanding, it could trigger a wave of optimism in the oil market, potentially leading to a strong upward move.
Market participants should closely watch developments related to the US-China negotiations over the coming days.

NIFTY50.....Miss a final sell-off!Hello Traders,
the NIFTY50 is moving within a sideways-range. It ranges from a possible wave ((iii)), with a green high @ 25116 and a low of 24508, the end of a wave z (pink) of a wave (w)/(a) of ((iv)) green!
What can we expect for the coming days?
I think, the final low is not in the cards yet! I miss a final "sell-off" that will take N50 down into the range of the rectangle, sky-blue, for the coming days. That means, a possible finale low would be around the 24473 to 23935 points.
If so to come, a break of the 25250 area probably would open the door to 25580 area in the next 2 weeks. If this high were to occur, it would end wave ((iii), in pink, with a wave (iv), pink, to follow. Seasonally, that would fit well into the structure 'til end of September/ mid-October!
Anyway! As can be seen at the 3h chart, there is a divergence at RSI (standard deviation 14). This, more often than not, indicates a change of trend, in this case to the upside! However, the daily RSI has room to decline for the reminder of the week.
So, again. The structure seems to be not done to the downside, and I expect a new low, below the Friday's low, to come.
Have a great week.....
Ruebennase
Please ask or comment as appropriate.
Trade on this analysis at your own risk.

#Bitcoin is in the early stages of its mega bull run!#btc follows past cycles steadily
focus on the big picture

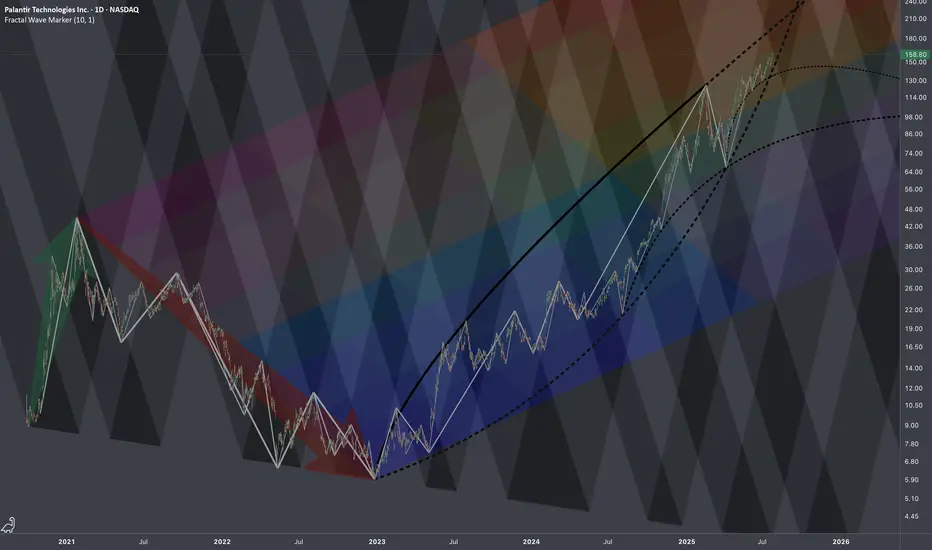
$PLTR: Regressive Heatmap🏛️ Research Notes
Technically this looks overbought, but fundamentally we know that under current administration this company is clear beneficiary (new contracts). Seems to explain why chart's dips were bought off extending bullish phases of cycle. However, there is still always a limit (as price keeps moving up, it alters the chances and magnitude of counter-move). Therefore, I'll test how wide range of 2021-2022yrs drop (prev cycle) can define the bullrun of current cycle. I'd say the very fact of anchoring the structure to actual chart points inherits its texture in next series of fractal based fib ratios.
All observed key coordinates build up into the following cross-cycle interconnections:
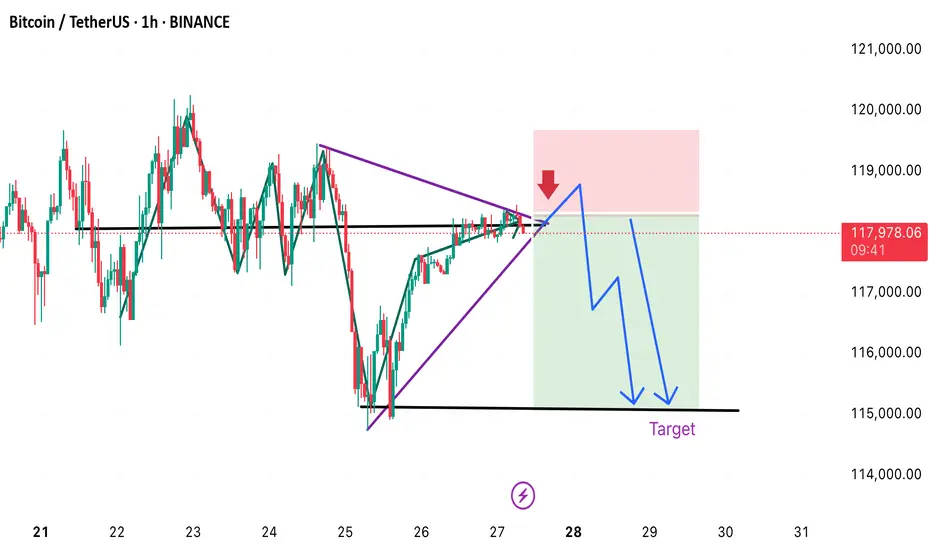
BTC 1H CHART LOOK OUTBitcoin breaks down from the triangle, the expected move is downward toward the $115,000 target. The trade setup reflects a short position, with risk clearly defined by the red stop-loss zone above ~$118,800.
USDJPY Will Fall! Short!
Take a look at our analysis for USDJPY.
Time Frame: 1D
Current Trend: Bearish
Sentiment: Overbought (based on 7-period RSI)
Forecast: Bearish
The price is testing a key resistance 147.661.
Taking into consideration the current market trend & overbought RSI, chances will be high to see a bearish movement to the downside at least to 145.139 level.
P.S
The term oversold refers to a condition where an asset has traded lower in price and has the potential for a price bounce.
Overbought refers to market scenarios where the instrument is traded considerably higher than its fair value. Overvaluation is caused by market sentiments when there is positive news.
Disclosure: I am part of Trade Nation's Influencer program and receive a monthly fee for using their TradingView charts in my analysis.
Like and subscribe and comment my ideas if you enjoy them!

AUDUSD Will Go Higher From Support! Buy!
Please, check our technical outlook for AUDUSD.
Time Frame: 12h
Current Trend: Bullish
Sentiment: Oversold (based on 7-period RSI)
Forecast: Bullish
The market is trading around a solid horizontal structure 0.656.
The above observations make me that the market will inevitably achieve 0.662 level.
P.S
We determine oversold/overbought condition with RSI indicator.
When it drops below 30 - the market is considered to be oversold.
When it bounces above 70 - the market is considered to be overbought.
Disclosure: I am part of Trade Nation's Influencer program and receive a monthly fee for using their TradingView charts in my analysis.
Like and subscribe and comment my ideas if you enjoy them!

Time to Wait and Watch
**"The $133K zone remains Bitcoin’s key resistance level.**
If Bitcoin fails to break this resistance for any reason and forms a **reversal candle** in this area,
I expect a **correction phase** to begin, with the market entering **panic sell mode.**
**First support** lies at **$110K.**
Further support levels are **$100K, $92K, and $88K** respectively.
If the price drops to the **$74K zone**, it’s time to **sell everything you’ve got** (yes, even your kidneys!) and **buy Bitcoin.**
However, if **$133K is broken to the upside**, we’re heading for **$140K, $150K, and $170K**… and **then** the real **panic selling** begins."

Ethereum monthly analysis Price Action & Structure:
• Ethereum is forming a symmetrical triangle, indicating a potential breakout or breakdown in the coming months.
• Key resistance levels:
• $4,698 (mid-term resistance)
• $5,640 (all-time high area)
• Key support levels:
• $2,235
• $1,600
Indicators:
• RSI (14): Currently around 50, showing neutral momentum but slightly recovering. No overbought or oversold condition.
• MACD (12,26): The blue line is attempting to cross above the orange line, a possible early bullish crossover. Histogram shows weakening bearish momentum.
• Volume: Decreasing volume inside the triangle pattern, typical before a breakout.
Outlook:
• A breakout above $4,698 with volume could target the $5,640 zone.
• A breakdown below $2,235 would open the door toward $1,600 or lower.
• Wait for a confirmed breakout from the triangle before major entries.

NG1! BEST PLACE TO BUY FROM|LONG
NG1! SIGNAL
Trade Direction: long
Entry Level: 3.111
Target Level: 3.357
Stop Loss: 2.946
RISK PROFILE
Risk level: medium
Suggested risk: 1%
Timeframe: 1D
Disclosure: I am part of Trade Nation's Influencer program and receive a monthly fee for using their TradingView charts in my analysis.
✅LIKE AND COMMENT MY IDEAS✅

NZD/JPY BEARS ARE STRONG HERE|SHORT
Hello, Friends!
Previous week’s green candle means that for us the NZD/JPY pair is in the uptrend. And the current movement leg was also up but the resistance line will be hit soon and upper BB band proximity will signal an overbought condition so we will go for a counter-trend short trade with the target being at 88.302.
Disclosure: I am part of Trade Nation's Influencer program and receive a monthly fee for using their TradingView charts in my analysis.
✅LIKE AND COMMENT MY IDEAS✅

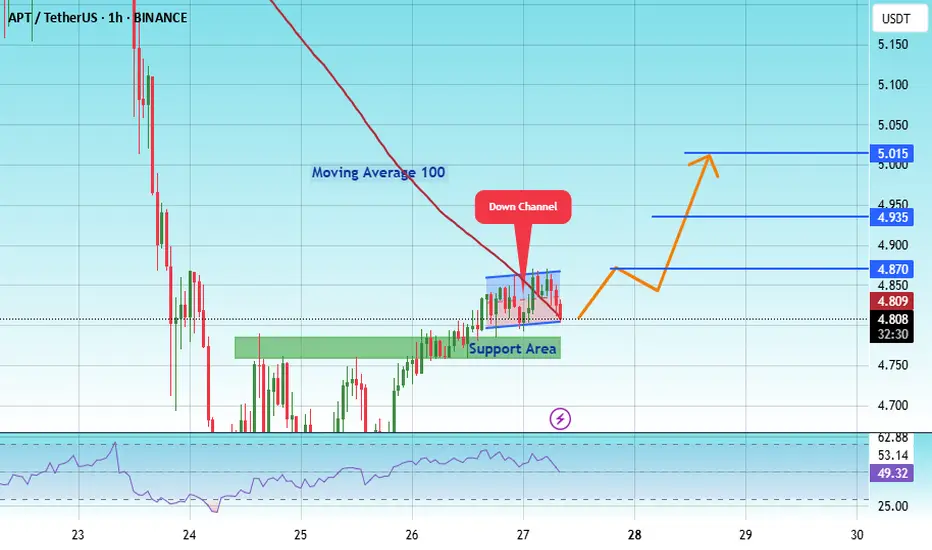
#APT/USDT#APT
The price is moving within an ascending channel on the 1-hour frame, adhering well to it, and is on track to break it strongly upwards and retest it.
We have support from the lower boundary of the ascending channel, at 0.1560.
We have a bearish trend on the RSI indicator that is about to break and retest, supporting the upside.
There is a major support area in green at 0.1555, which represents a strong basis for the upside.
Don't forget a simple thing: ease and capital.
When you reach the first target, save some money and then change your stop-loss order to an entry order.
For inquiries, please leave a comment.
We have a trend to hold above the 100 Moving Average.
Entry price: 0.1600
First target: 0.1640
Second target: 0.1677
Third target: 0.1719
Don't forget a simple thing: ease and capital.
When you reach your first target, save some money and then change your stop-loss order to an entry order.
For inquiries, please leave a comment.
Thank you.