ETH/USD – Macro Wave Map to $10,000? ETH/USD – Macro Wave Map to $10,000? 🚀🔥
Ethereum has broken out of its prolonged corrective structure, moving decisively above the equilibrium zone (~$3,500) and signaling the start of a potential macro impulsive wave (Elliott Wave 3 of 5).
Key Observations (Weekly Chart)
Wave Structure: The corrective (W)-(X)-(Y)-(Z) phase is complete, with ETH now forming the early stages of a wave (3) targeting $8,500–$9,000.
Equilibrium Flip: Price reclaimed the premium zone (~$3,500), indicating smart money accumulation.
Macro Target: If wave (3) plays out fully, wave (5) could extend toward $10,000+ by 2026.
Volume Spike: Sustained institutional demand confirms the bullish pivot.
Levels to Watch
Support (Re-entry Zone): $3,200 – $3,500 (previous resistance, now strong support) 🛡️
Primary Targets: $5,000 – $6,800 (wave 3 mid-range) 🎯
Extended Targets: $8,500 – $10,000 (wave 5 completion) 🏆
VolanX Macro Signal
Bias: Bullish as long as ETH stays above $3,200.
Risk Marker: A drop below $2,900 (200-week EMA) would invalidate this impulsive scenario.
Accumulation Strategy: DCA between $3,200 – $3,600 targeting $5,000+ in 2026.
VolanX View:
Ethereum’s current structure is primed for a multi-year expansion cycle, with smart money targeting untouched liquidity above $5K and potentially $10K. The roadmap remains bullish as long as we hold the reclaimed base zones.
Wave Analysis

CAD-CHF Local Rebound Ahead! Buy!
Hello,Traders!
CAD-CHF made a retest
Of the horizontal support
At 0.5797 from where we
Are already seeing a bullish
Reaction so we will be
Expecting a further local
Bullish move up
Buy!
Comment and subscribe to help us grow!
Check out other forecasts below too!
Disclosure: I am part of Trade Nation's Influencer program and receive a monthly fee for using their TradingView charts in my analysis.

#QS - 4HR [Will the last boost last or will it bust? With a new Volkswagen investment and partnership. Quantum Scape’s earnings were far from stellar with a 26% decrease in income compared to same time last year. They have, nevertheless, made advancements with their very promising lithium-Metal battery technology.
With fundamentals aside, I am curious to gauge how long-term investors have priced-in the company's stock price.
Technically, I see price moving to present yet another opportunity by EOY if not sooner. My count shows important levels to watch.
Go #QuantumScape, Go!!!
Check out my other chart ideas @CaxhPrince everywhere.

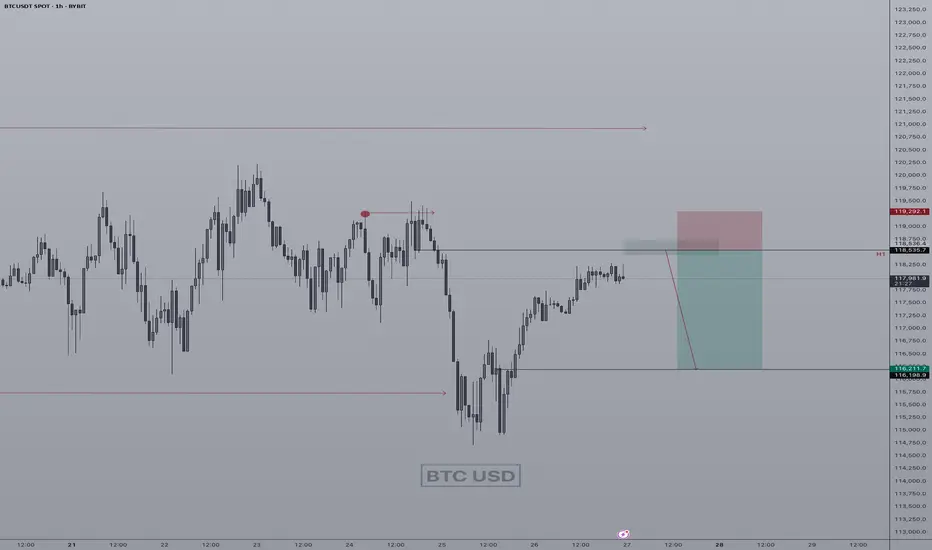
BTC SELL SHORT IDEA H1quick momentum short,to create weekly low manipulation for any masjor move, right now focus is on the sell move, following sub struture ltf trend pull back
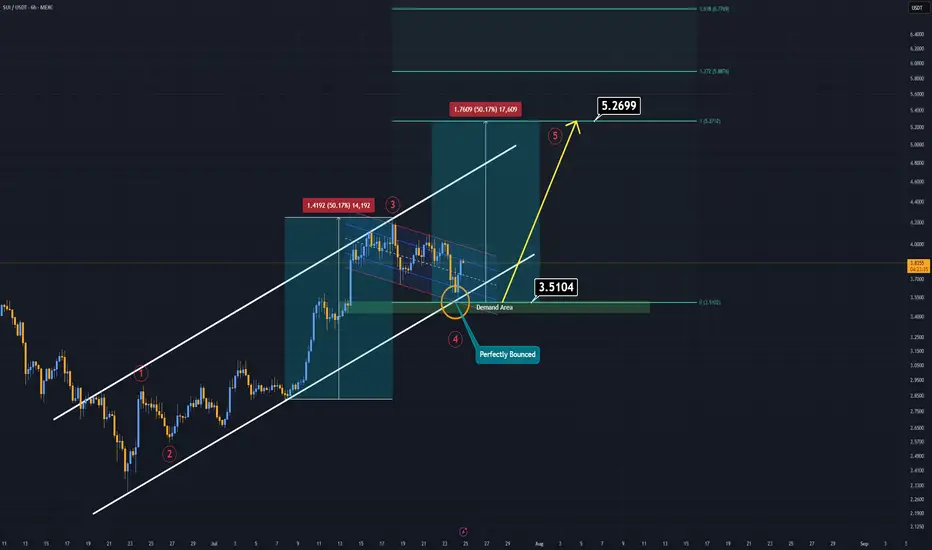
SUI Analysis (6H)If you're on the hunt for extreme risks and potentially high rewards — SUI might be calling your name.
Currently, SUI is trending within a well-respected ascending channel, and just today, it tapped both the demand zone and the lower boundary of this channel.
That’s what we call a double support, and it often signals a strong potential bounce.
SUI now appears to be forming a bullish flag pattern. If this formation breaks to the upside, it could trigger the fifth impulsive wave in line with Elliott Wave Theory.
In such a case, the main target is projected around $5.00–$5.20.
Extreme setups demand extreme conviction.
Good luck.
GBP-NZD Will Keep Falling! Sell!
Hello,Traders!
GBP-NZD keeps falling down
And the pair made a strong
Bearish breakout of the key
Horizontal key level of 2.2400
And the breakout is confirmed
So we are bearish biased and
We will be expecting a further
Bearish move down on Monday
Sell!
Comment and subscribe to help us grow!
Check out other forecasts below too!
Disclosure: I am part of Trade Nation's Influencer program and receive a monthly fee for using their TradingView charts in my analysis.

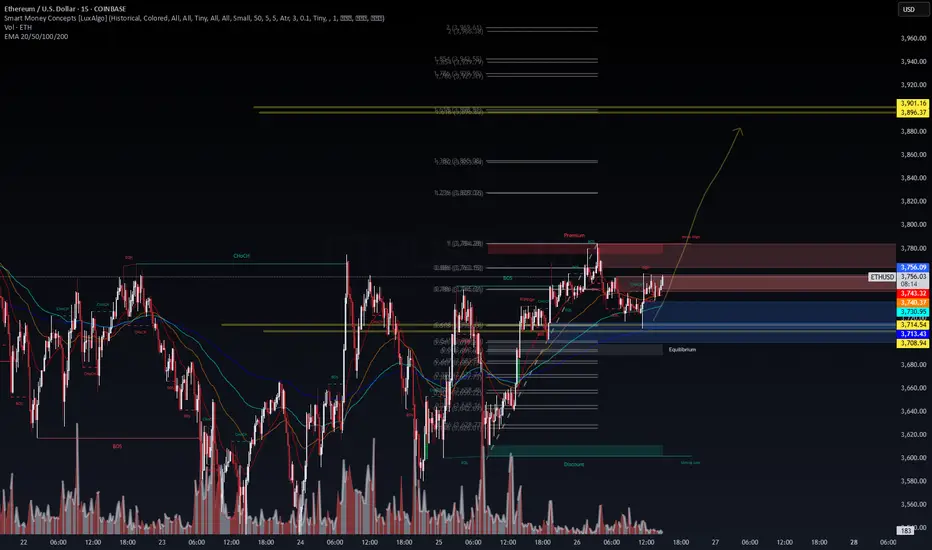
HAPPY BIRTHDAY Ethereum! Now let's go Looks like the move is about to happen right now. Target 10K !
CRYPTO ALT SEASON One blue box, two different stories:
Above - Bull season
Below - Bear season
Not a financial advice

ZORA/USDT -40% has delivered an explosive move since July 2025, rallying nearly +700% from its listing price. This kind of parabolic price action typically marks the climax of a strong impulse wave, especially for newly listed tokens on perpetual markets.
Currently, ZORA is showing early signs of exhaustion, with price stalling near recent highs. Momentum indicators are flattening out, and volume is starting to decline classic signs of distribution. Given the magnitude of the recent move, a healthy correction is likely before any potential continuation.

AT&T – Still Ringing?AT&T. The name alone evokes landlines, long-distance charges, and a time when phones had cords (and possibly rotary dials). But don’t let the vintage vibes fool you — this telecom titan might still have some signal left on the price chart.
Now, I’m not saying AT&T is about to moonwalk up the NASDAQ leaderboard — but I’ve seen slower giants pick up speed. And if you squint just right, the chart has been whispering, "Maybe I’m not dead yet."
From a chart perspective:
After what felt like years of sideways static, the price may finally be picking up a bar or two. Recent structure hints at a potential trend reversal — or at least a modest attempt to climb out of the basement. Support levels are holding like a stubborn dial-up connection, and the candles are starting to lean north.
Is this the beginning of a full-blown comeback or just a dead-cat bounce in a trench coat? Hard to say. But I’m watching with interest — and maybe a little nostalgic hope that this once-glorious phone company still has some long-distance strength left in it.
No guarantees, no predictions — just one person watching a chart and thinking: "This thing might still be ringing."
A lighthearted market musing, not financial advice!

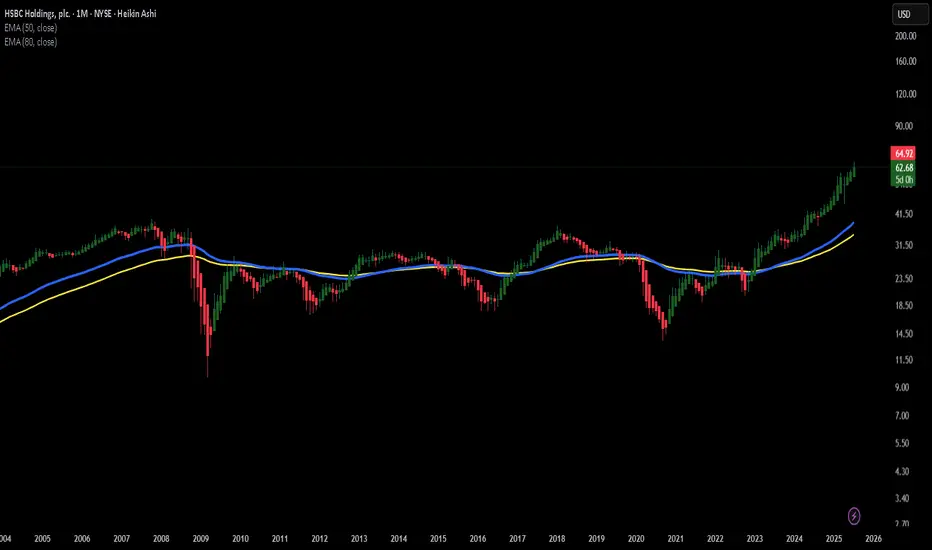
HSBC – Big Bank EnergyHSBC. The name alone sounds like it should be engraved in stone above a massive marble doorway somewhere in London, guarded by two lions in tuxedos. It’s one of those banks that’s been around forever – the kind of institution that probably has an emergency plan for a meteor strike… and a tea protocol for after.
And yet, when I look at the chart, I don’t just see a slow-moving financial giant. I see a potentially elegant bulldozer gently carving its way upward. Recent price action has been forming what looks like a series of higher lows, and we might just be watching a classic "big-bank-breakout" in slow motion.
From a chart perspective:
Price has been flirting with key resistance, perhaps like a banker flirts with risk – cautiously, from a safe distance, and only with proper documentation. But if momentum keeps building, it might finally stop sipping tea and actually make a move. Possibly upward. Possibly politely.
There’s no guarantee, of course. This isn’t a prediction – more like the market equivalent of a raised eyebrow and a curious “hmm.” I’ll be keeping an eye on HSBC to see if this old titan is ready to shake off the pinstripes and surprise us all.
A lighthearted market musing, not financial advice!
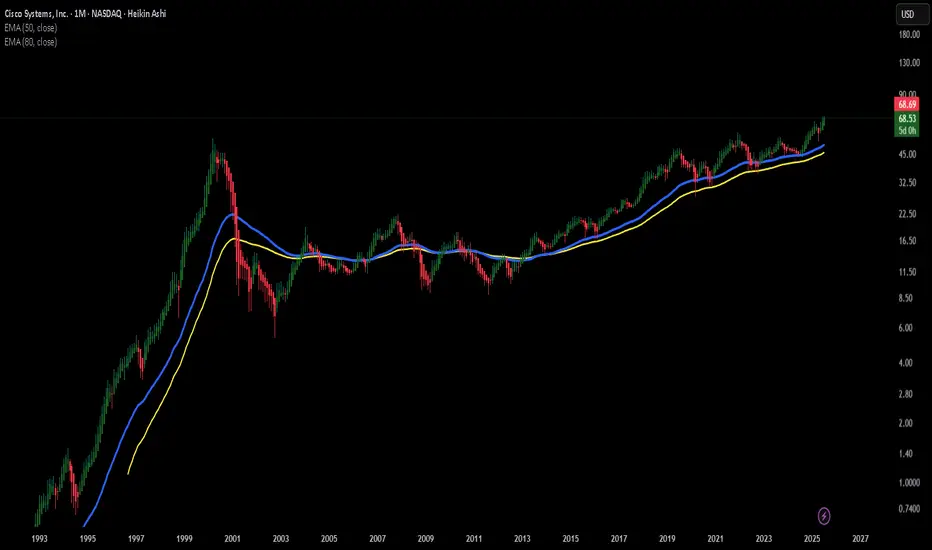
CSCO – Cisco’s Not Done Dancing Yet!
When I look at CSCO, I get the feeling that this old-school tech legend still has some rhythm left in its step. It’s like that uncle at the family wedding who’s been around the block but somehow still manages to pull off a surprisingly smooth move on the dance floor.
It may not be the flashiest stock on the NASDAQ, but there’s something about the way it moves – slow, steady, confident – that makes me think it might just be preparing for another swing to the upside.
From a chart perspective:
Recently, CSCO has been respecting a rising trendline and forming a sequence of higher lows – a classic sign of underlying strength. The price is now approaching a zone that has previously acted as resistance. If momentum builds, this level could turn into a launchpad. Of course, the market doesn’t always follow the script, but the setup looks promising from where I stand.
No predictions, no guarantees – just one trader’s interpretation of the chart. If Cisco keeps moving like this, I’ll be following the rhythm with curiosity (and maybe a fresh cup of coffee).
A lighthearted market musing, not financial advice!
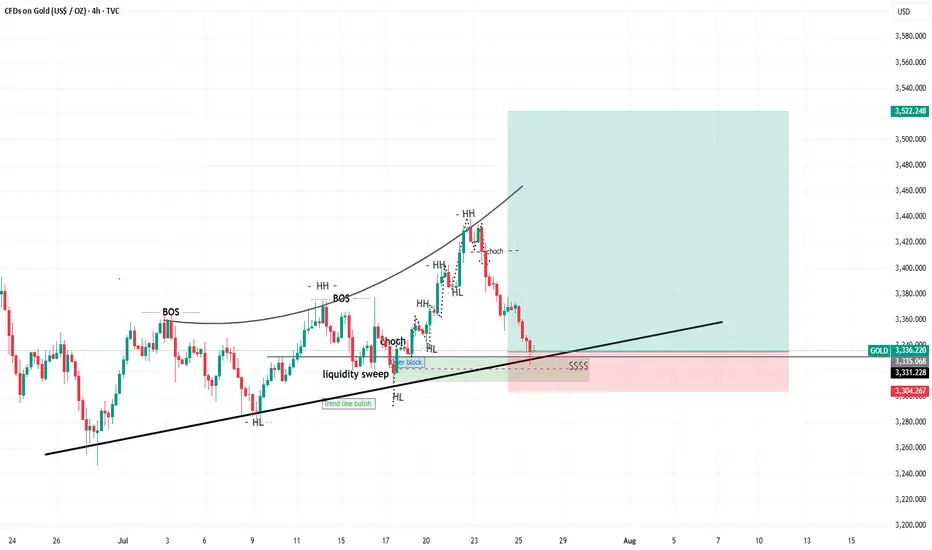
xauusd i think buy from here its not a bad ideatrend lines oder block fvg liquidity sweep choch higher high higher low.
Long term Bitcoin view: the path to $100kI think Bitcoin will make a correction in the short run. The next target price can be $42k.
However I predict further gains in price in the mid run. The target of $100k may be achieved then. Though it is a far stretched number, I still expect a price move to that level.
If fail, we can expect a complex correction for the next 2-3 years. Final long term target will be above $100k.
#BTCUSDTP

ETH - 4444 - 5000 + Hello Traders,
Using Fibs, Elliot Waves, Trend Regression Channels, and an Inverse H&S Patterns I show some possible ETH price targets and dates. Lets see how this plays out

XRP: Double zigzag correction scenario for Jun/July 2025 impulseA possible double zigzag pullback scenario correcting June & July's impulsive breakout, upon which normies & bears might say "head & shoulders" but then it climbs the wall of worry for a massive Wave 3 parabola.

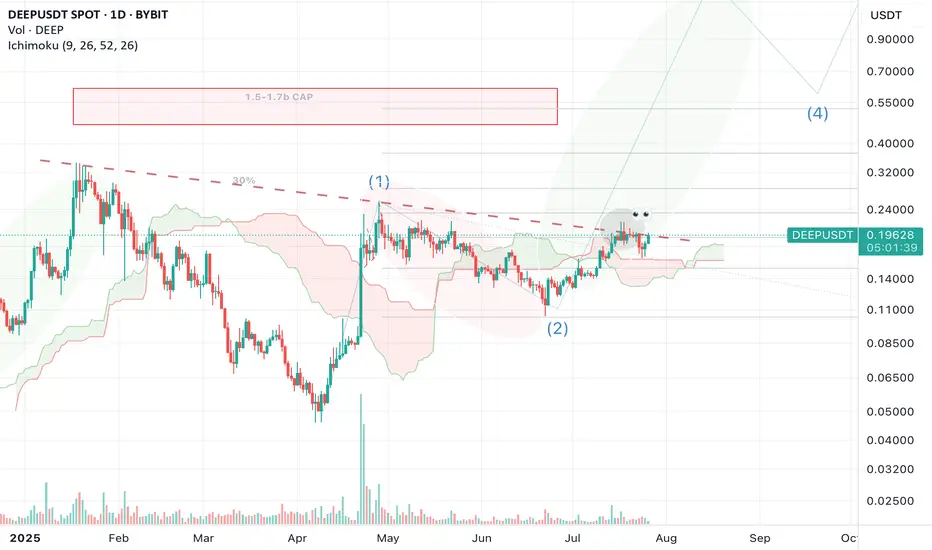
$DEEPIt's time to update the chart. It corrected for a few days, hit the Ichimoku Cloud support on the daily timeframe, and bounced back for an uptrend. If the market plays out well, I expect a nice pump. Let's see what happens!
Always DIOR ⚠
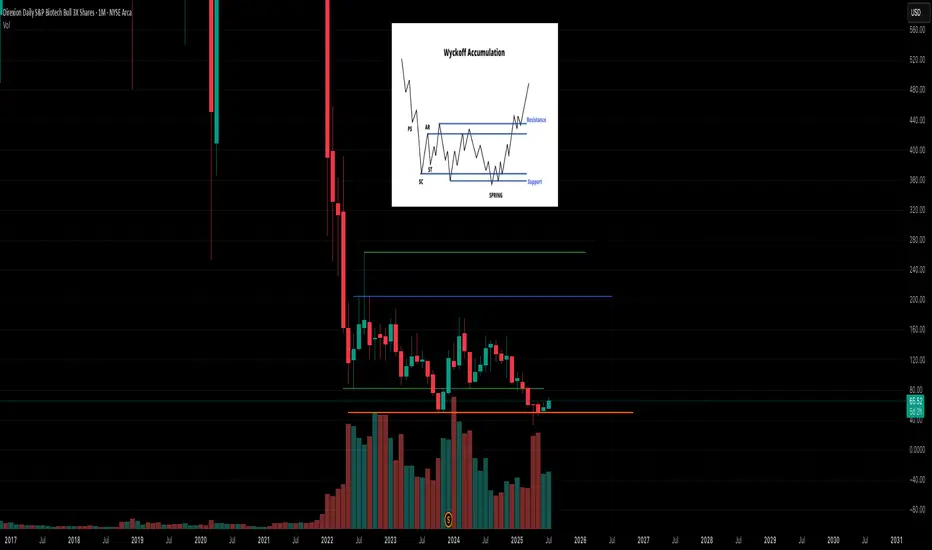
If you can hold for 2 years could be a nice entry around here haLooks to be in a very SLOW accumulation process. We will have a BIO-tech revolution it's inevitable; just make take years before it actually manifests in the sector. I have psoriasis and the should be a FKIN cure by now rofl. BS. AI will make it happen. MONTHLY CHARY
BTC 125k - $130KHello Traders,
Using Fibs and Elliot Waves I show possible BTC targets coming soon in the next leg up. Lets see how this plays out.

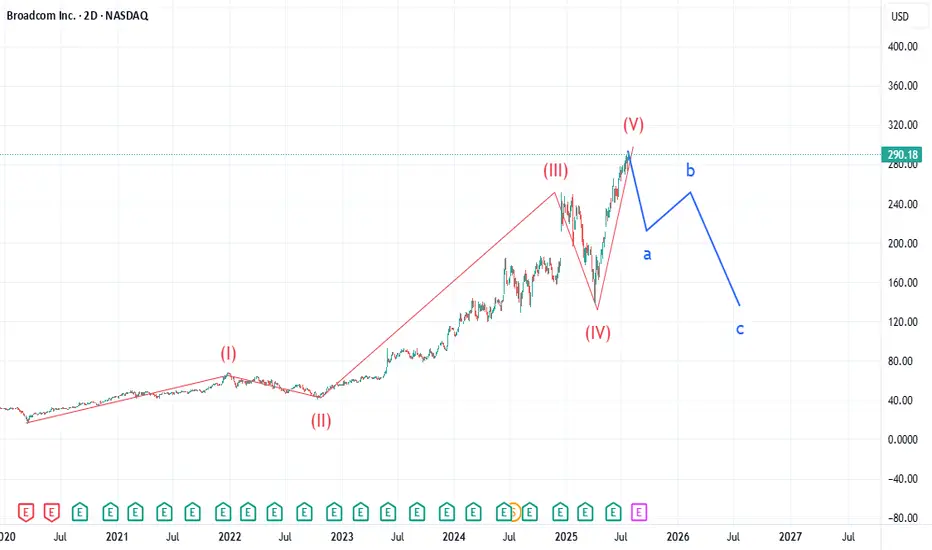
AVGO: Too Many Similarities Market WideLike my chart on BKNG, AVGO is showing an uncanny similarity to Booking.com's chart. Many indices are showing the end of 5 waves in a super cycle dating back to the drop of March 2020. AVGO pt1 is 211. Expecting selling to increase over the next 90 days. Not certain what the catalyst will be, but looking for a major drop in equities over the next 2 weeks. Check IBM chart. I called that drop last week and many stocks will have a similar gap down structure over the next 2 weeks from what I am tracking.
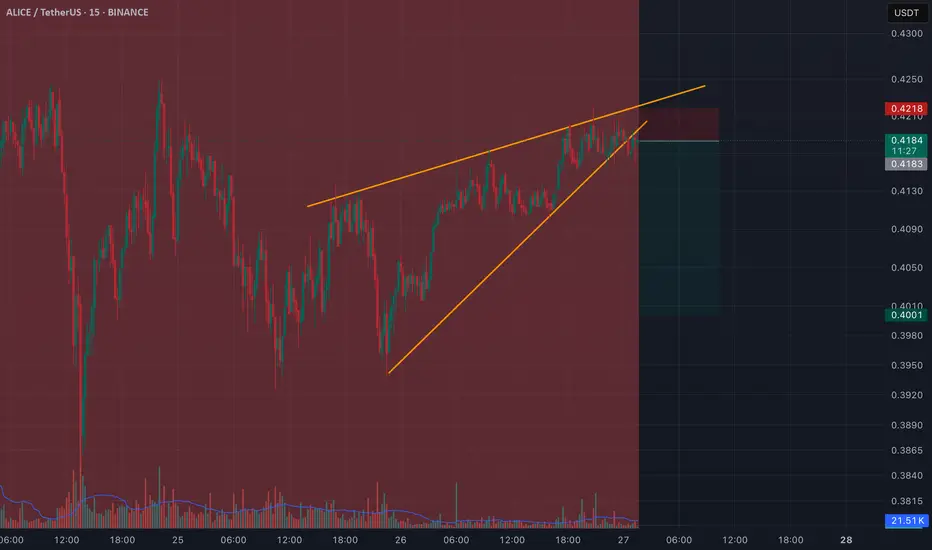
ALICEUSDT SHORT LFGA beautiful Rising Wedge.
IDK Tho, Just LFG
Entry, Stop Loss, and Take Profit are on the chart.
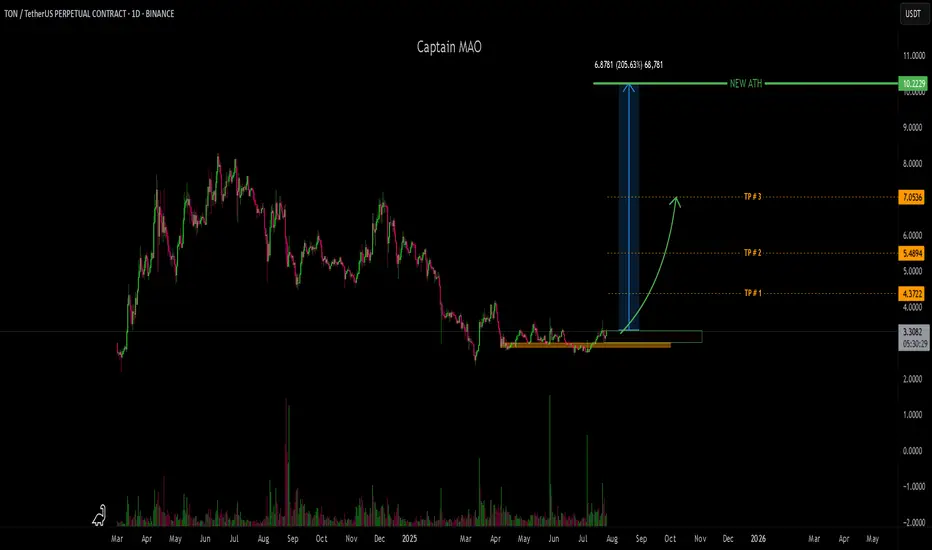
TON/USDT - ATH !!!TON/USDT has been in a sideways consolidation phase for over 100 days, tightly ranging between the $2.90–$3.50 zone. This prolonged accumulation is forming a solid base structure, often seen before major trend reversals in high-cap altcoins.
Recent price action is beginning to show early signs of bullish momentum, with buyers gradually stepping in and volume starting to rise. This area is historically significant and marks a high-probability entry zone, especially if the market confirms the breakout.
BKNG: Catalyst for the drop - EarningsBKNG has completed a super cycle 5 wave structure beginning at the completion of the March 2020 COVID drop. First target is 4030 by EOY to early next year. Many other stocks are showing a similar structure, so expecting selling volume to greatly increase over the next 90 days.
