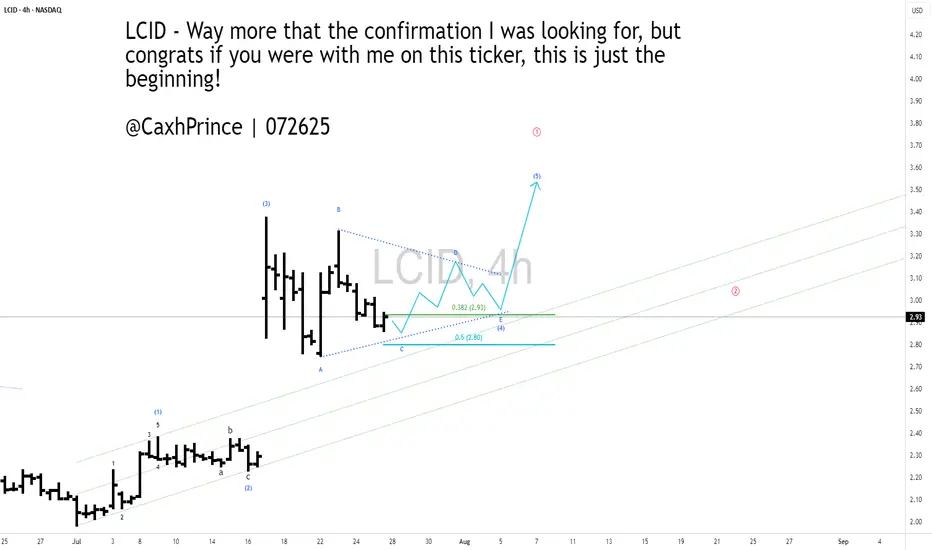
#LCID - 4HR [ A potential bullish view]Lucid blasted off last week with the collaboration of Uber and Robo-taxis. I think that blast infused more investors to the stock and I think it may never come back to take out its lows. If it does, I would load up more on it. I like their designs and the fact that they are now compatible with TESLA's Super Chargers make them even more attractive.
In my count here, I am sensing the current correction could form a triangular pattern for another high before one last correction for ABC down.
Go LCID, Go!!!
Check out my other chart ideas @CaxhPrince everywhere.
Wave Analysis

A 4HR Bullish view on #Lucid Motors ($LCID)Lucid blasted off last week with the collaboration of Uber and Robo-taxis. I think that blast infused more investors to the stock and I think it may never come back to take out its lows. If it does, I would load up more on it. I like their designs and the fact that they are now compatible with TESLA's Super Chargers make them even more attractive.
In my count here, I am sensing the current correction could form a triangular pattern for another high before one last correction for ABC down.
Go LCID, Go!!!
Check out my other chart ideas @CaxhPrince everywhere.
EUR-GBP Swing Short! Sell!
Hello,Traders!
EUR-GBP keeps growing in
A strong uptrend but the pair
Is locally overbought so after
The price hits a horizontal
Resistance level of 0.8764
We will be expecting a
Local bearish correction
Sell!
Comment and subscribe to help us grow!
Check out other forecasts below too!
Disclosure: I am part of Trade Nation's Influencer program and receive a monthly fee for using their TradingView charts in my analysis.

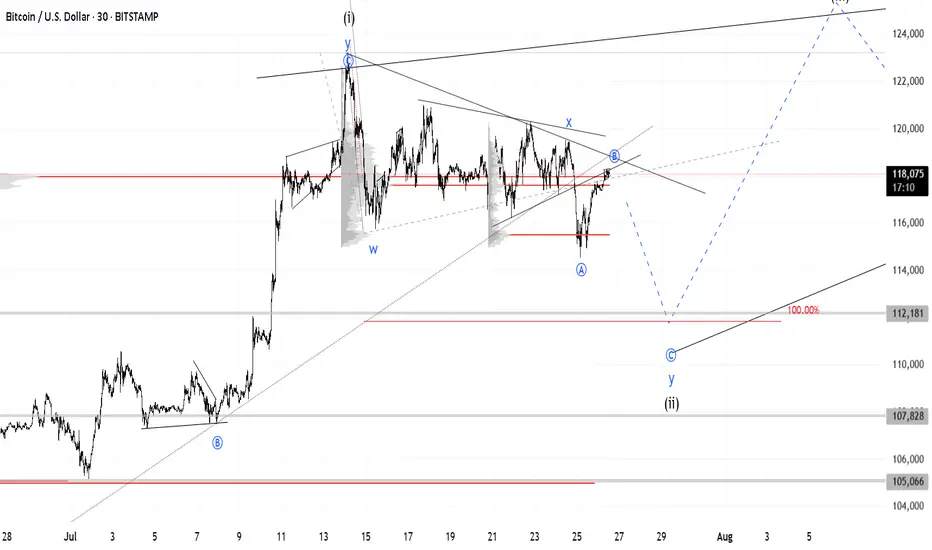
BTC at Multi-Factor Resistance: Wave Count Hints at Downside BTC is looking increasingly bearish as the price has risen to a resistance zone formed by multiple factors: trendlines, the POC (Point of Control), and moving averages.
The wave count also supports this bearish outlook / the bearish case.
BITCOIN Wait For Breakout!
HI,Traders !
#BITCOIN has formed a Bullish Wedge pattern
While trading in an uptrend As
we mentioned in a previous analysis
So we are bullish biased and
IF we see a bullish breakout
We will be expecting a
Further bullish move up !
Comment and subscribe to help us grow !

#JTO/USDT#JTO
The price is moving within a descending channel on the 1-hour frame and is expected to break and continue upward.
We have a trend to stabilize above the 100 moving average once again.
We have a downtrend on the RSI indicator that supports the upward move with a breakout.
We have a support area at the lower boundary of the channel at 1.84, acting as strong support from which the price can rebound.
We have a major support area in green that pushed the price higher at 1.88.
Entry price: 1.96.
First target: 2.00.
Second target: 2.12.
Third target: 2.22.
To manage risk, don't forget stop loss and capital management.
When you reach the first target, save some profits and then change your stop order to an entry order.
For inquiries, please comment.
Thank you.

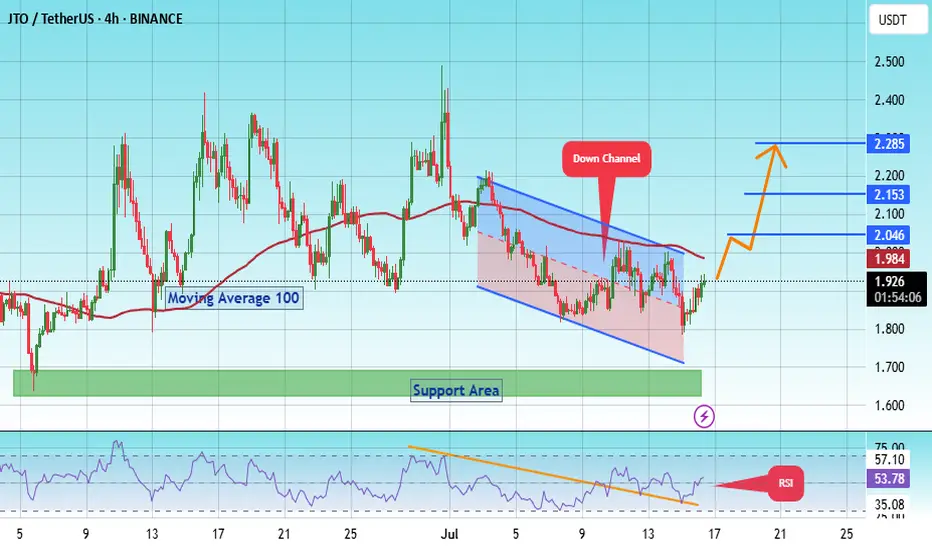
#JTO/USDT Forming Bullish Wave #JTO
The price is moving within a descending channel on the 1-hour frame, adhering well to it, and is on its way to breaking it strongly upwards and retesting it.
We have a bounce from the lower boundary of the descending channel. This support is at 1.73.
We have a downtrend on the RSI indicator that is about to be broken and retested, supporting the upside.
There is a major support area in green at 1.65, which represents a strong basis for the upside.
Don't forget a simple thing: ease and capital.
When you reach the first target, save some money and then change your stop-loss order to an entry order.
For inquiries, please leave a comment.
We have a trend to hold above the 100 Moving Average.
Entry price: 1.92.
First target: 2.046.
Second target: 2.15.
Third target: 2.28.
Don't forget a simple thing: ease and capital.
When you reach the first target, save some money and then change your stop-loss order to an entry order.
For inquiries, please leave a comment.
Thank you.
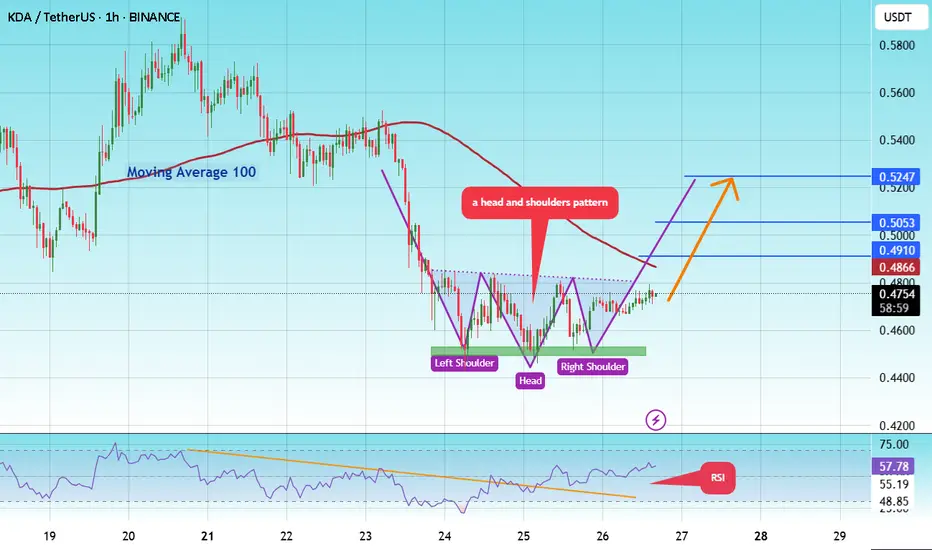
#KDA/USDT Stay Adaptive ! #KDA
The price is moving in a head and shoulders pattern on the 1-hour frame and is expected to break and continue higher.
We have a trend to stabilize above the 100 moving average once again.
We have a bearish trend on the RSI indicator, supporting the upward move with a break above it.
We have a support area at the lower boundary of the head and shoulders at 0.4545, acting as strong support from which the price can rebound.
We have a major support area in green that pushed the price higher at 0.4490.
Entry price: 0.4747
First target: 0.4910
Second target: 0.5053
Third target: 0.5247
To manage risk, don't forget stop loss and capital management.
When you reach the first target, save some profits and then change your stop order to an entry order.
For inquiries, please comment.
Thank you.
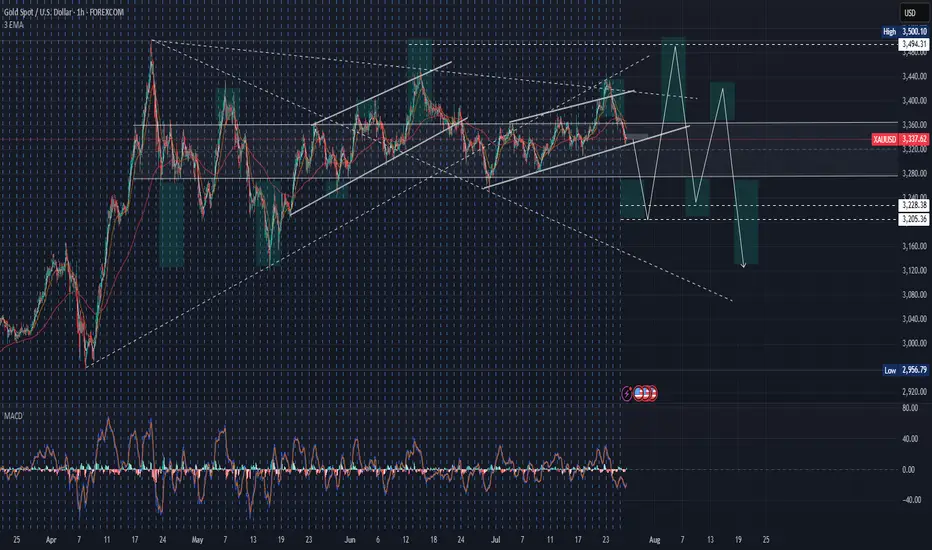
Gold move next weekoverall in a bearish trend, however currently in an over sold price area. Key level to watch 3345-3350, above will move to 3370, if respected, then may fall below 3320-3312 or further down to 3395-3390 before reversing to bullish.

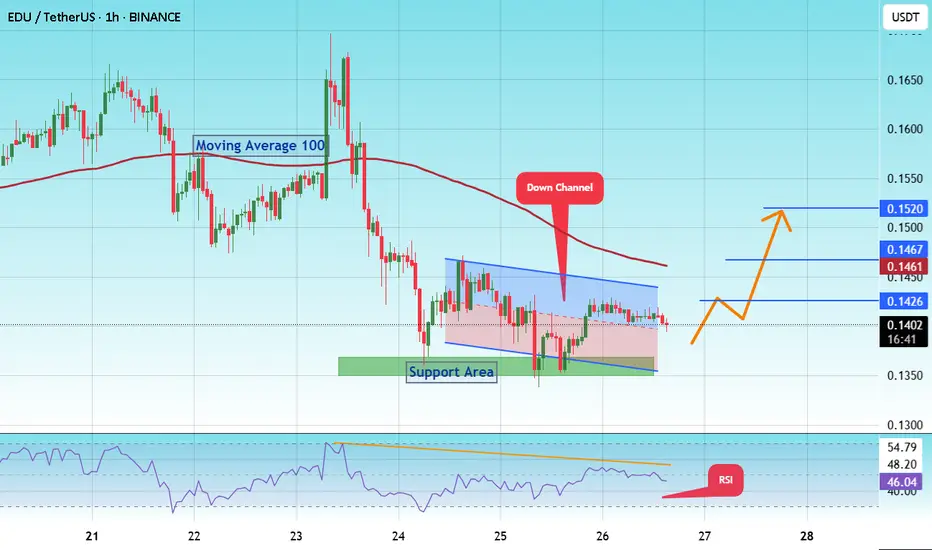
#EDU/USDT Forming Descending Triangle#EDU
The price is moving within a descending channel on the 1-hour frame and is expected to break and continue upward.
We have a trend to stabilize above the 100 moving average once again.
We have a downtrend on the RSI indicator that supports the upward break.
We have a support area at the lower boundary of the channel at 0.1300, acting as a strong support from which the price can rebound.
We have a major support area in green that pushed the price upward at 0.1350.
Entry price: 0.1400.
First target: 0.1426.
Second target: 0.1460.
Third target: 0.1520.
To manage risk, don't forget stop loss and capital management.
When you reach the first target, save some profits and then change your stop order to an entry order.
For inquiries, please comment.
Thank you.
"Something’s cooking with BTC…"btc i think it's going up... not just 'cause the technicals look good, but 'cause big funds are already expecting crazy prices. blackrock, fidelity and others have mentioned btc at 150k or even 250k in a few years. and if they’re saying that, it’s not just talk... it’s 'cause they’ve got info most of us don’t.
plus, there’s less btc after the halving, and ETFs are scooping it up like crazy… you already know what that could mean.

Nasdaq Short: Completion of 5 waves with wave 5=wave 1Over here, I present a short case for Nasdaq (and S&P500 by default since their correlations are high). The main reasons are:
1. Completion of 5 waves structure both on the high degree and on low degree, as shown in the chart.
2. Fibonacci measurement where wave 1 = wave 5.
The stop of this idea is to be placed slightly above the high, in this case, I placed it at around 23320. The take profit target is at the bottom of primary wave 4, around 20685.
Take note that this is a positional short, meaning the strategy is to short and hold and periodically adjust your stop loss based on unfolding on wave structure. Sizing is based on your risk tolerance.
Good luck!

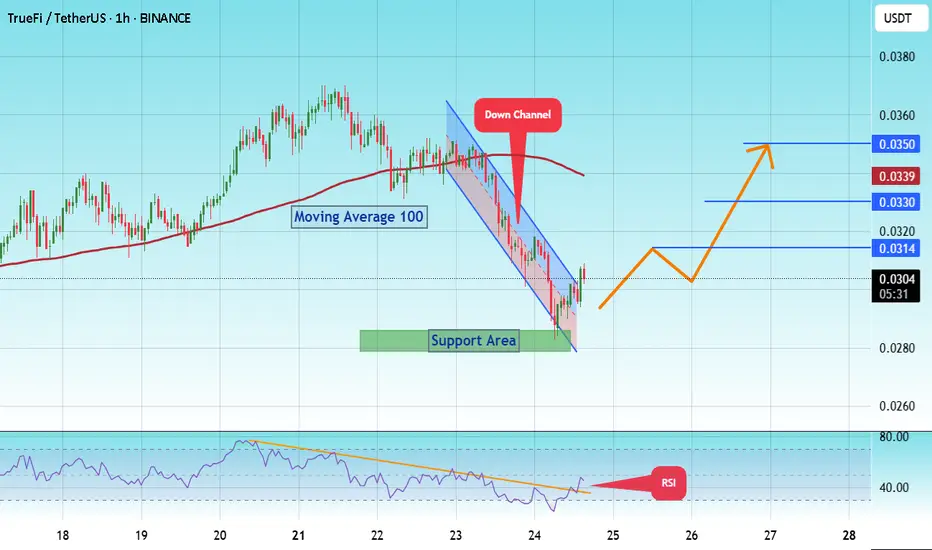
#TRU/USDT Low Risk vs High Rewards#TRU
The price is moving within a descending channel on the 1-hour frame and is expected to break and continue upward.
We have a trend to stabilize above the 100 moving average once again.
We have a downtrend on the RSI indicator that supports the upward break.
We have a support area at the lower limit of the channel at 0.0285, acting as strong support from which the price can rebound.
We have a major support area in green that pushed the price upward at 0.0280.
Entry price: 0.0300
First target: 0.0314
Second target: 0.0328
Third target: 0.0350
To manage risk, don't forget stop loss and capital management.
When you reach the first target, save some profits and then change the stop order to an entry order.
For inquiries, please comment.
Thank you.
Bitcoin Long: Completion of Sub-wave 4, riding wave 5I updated the Elliott Wave counts for Bitcoin and we should have completed sub-wave 4 and is currently onto sub-wave 5. Based on my counts, sub-wave 3 has extended and is slightly more than 1.618x of wave 1, thus I expect sub-wave 5 to NOT extend. Based on Fibonacci extensions, the price target is around $124,600.
The stop loss for this idea is around $114,600.
Towards to end of the video, I zoomed out for Bitcoin and observed that Cycle level wave 1 and 3 are HUGE (red font) and the current Cycle Wave 5 looks too small. Thus, the entire 5-wave structure of what we are going through now may be just a Sub-Wave 1 of Cycle Wave 5. And that means that longer-term, Bitcoin may really go to $200,000 and beyond. But for traders, keep our foot on the ground and trade what is in front of us.
Good luck!

GBPAUD: Bullish Forecast & Outlook
Balance of buyers and sellers on the GBPAUD pair, that is best felt when all the timeframes are analyzed properly is shifting in favor of the buyers, therefore is it only natural that we go long on the pair.
Disclosure: I am part of Trade Nation's Influencer program and receive a monthly fee for using their TradingView charts in my analysis.
❤️ Please, support our work with like & comment! ❤️

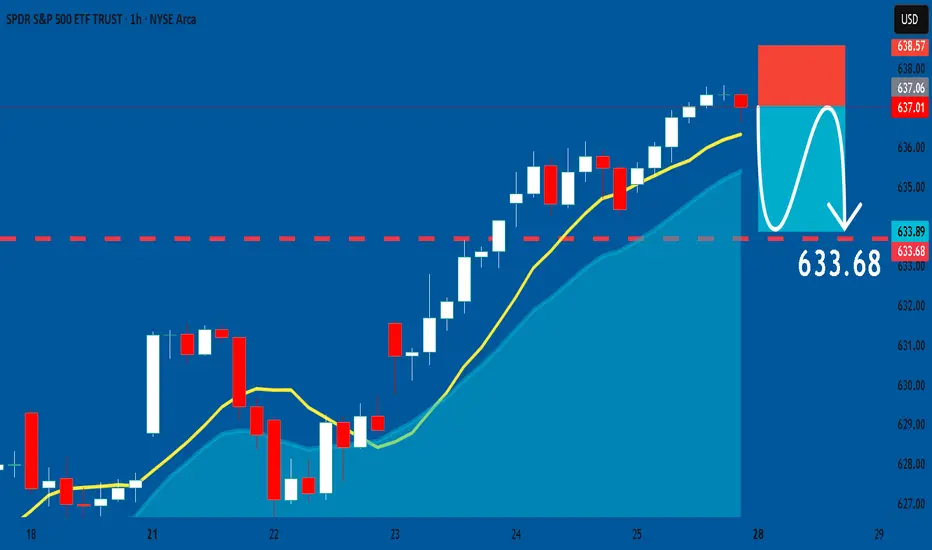
SPY: Bearish Continuation & Short Signal
SPY
- Classic bearish setup
- Our team expects bearish continuation
SUGGESTED TRADE:
Swing Trade
Short SPY
Entry Point - 637.01
Stop Loss - 638.57
Take Profit - 633.58
Our Risk - 1%
Start protection of your profits from lower levels
Disclosure: I am part of Trade Nation's Influencer program and receive a monthly fee for using their TradingView charts in my analysis.
❤️ Please, support our work with like & comment! ❤️
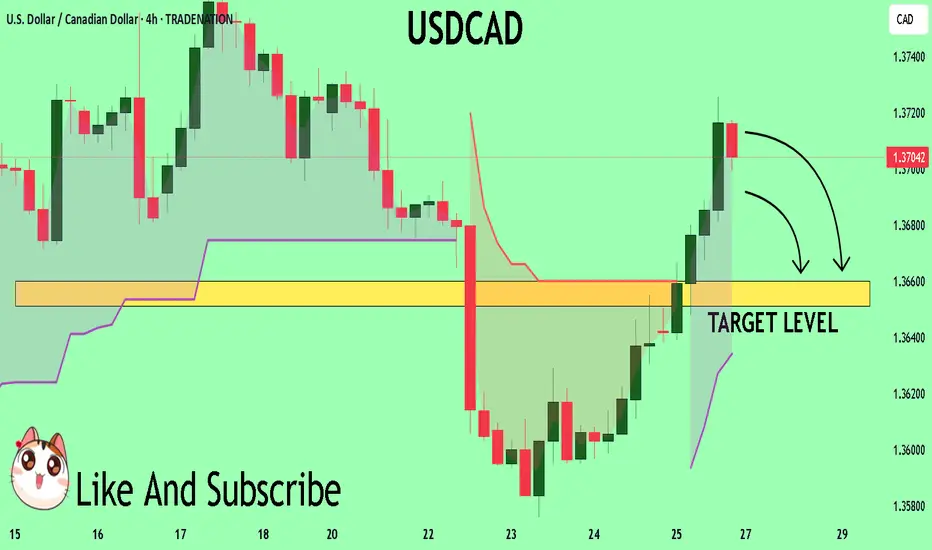
USDCAD Buyers In Panic! SELL!
My dear subscribers,
This is my opinion on the USDCAD next move:
The instrument tests an important psychological level 1.3704
Bias - Bearish
Technical Indicators: Supper Trend gives a precise Bearish signal, while Pivot Point HL predicts price changes and potential reversals in the market.
Target - 1.3660
About Used Indicators:
On the subsequent day, trading above the pivot point is thought to indicate ongoing bullish sentiment, while trading below the pivot point indicates bearish sentiment.
Disclosure: I am part of Trade Nation's Influencer program and receive a monthly fee for using their TradingView charts in my analysis.
———————————
WISH YOU ALL LUCK
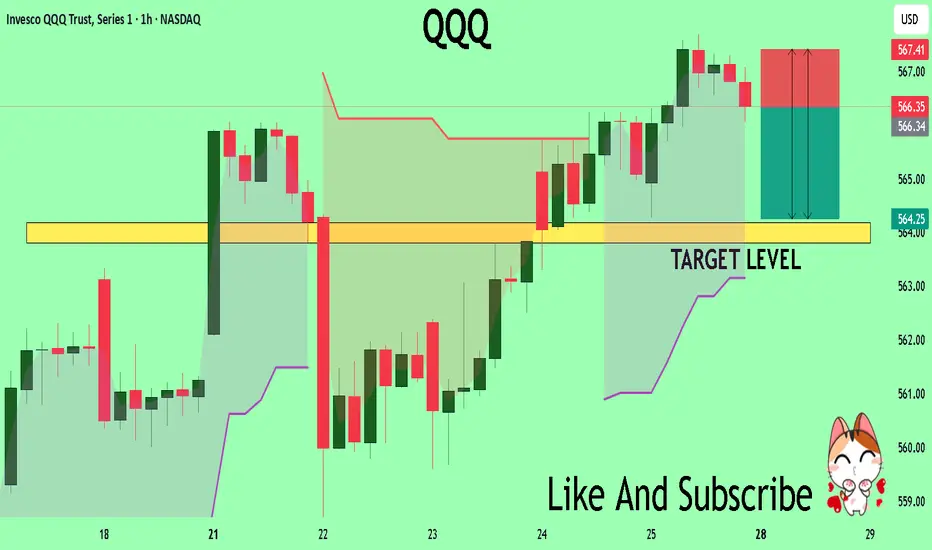
QQQ Massive Short! SELL!
My dear followers,
This is my opinion on the QQQ next move:
The asset is approaching an important pivot point 566.35
Bias - Bearish
Safe Stop Loss - 567.41
Technical Indicators: Supper Trend generates a clear short signal while Pivot Point HL is currently determining the overall Bearish trend of the market.
Goal - 564.18
About Used Indicators:
For more efficient signals, super-trend is used in combination with other indicators like Pivot Points.
Disclosure: I am part of Trade Nation's Influencer program and receive a monthly fee for using their TradingView charts in my analysis.
———————————
WISH YOU ALL LUCK
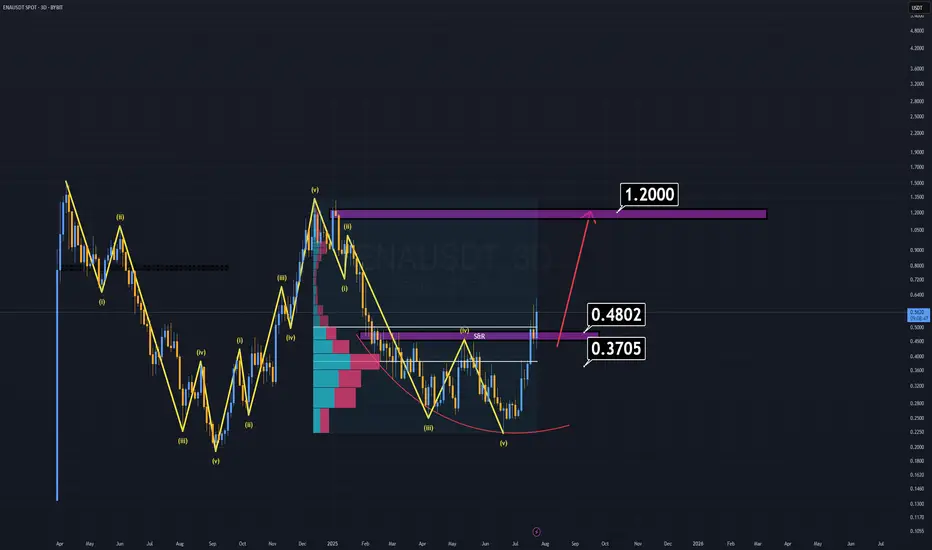
ENA Analysis (3D)ENA has been outperforming many altcoins for weeks, yet it still appears undervalued based on its fundamentals and recent investor interest.
Where to buy?
Right now, buying at current levels is extremely risky, as the ideal buy-back zones are significantly below the market price.
First major support: $0.48 — considered a "cheap" entry.
Dream entry (low probability): $0.37–$0.38 — at that point, ENA would feel almost free.
Notably, BlackRock and its partners are actively investing in ENA, which speaks volumes about its long-term credibility. That alone justifies keeping it on your radar.
Minimum target: $1.00–$1.20
Remember, that’s just the beginning. We may see even more once momentum kicks in.
Sometimes, the best trade is the one you're waiting for.
Good luck.
SILVER: Expecting Bullish Continuation! Here is Why:
The charts are full of distraction, disturbance and are a graveyard of fear and greed which shall not cloud our judgement on the current state of affairs in the SILVER pair price action which suggests a high likelihood of a coming move up.
Disclosure: I am part of Trade Nation's Influencer program and receive a monthly fee for using their TradingView charts in my analysis.
❤️ Please, support our work with like & comment! ❤️

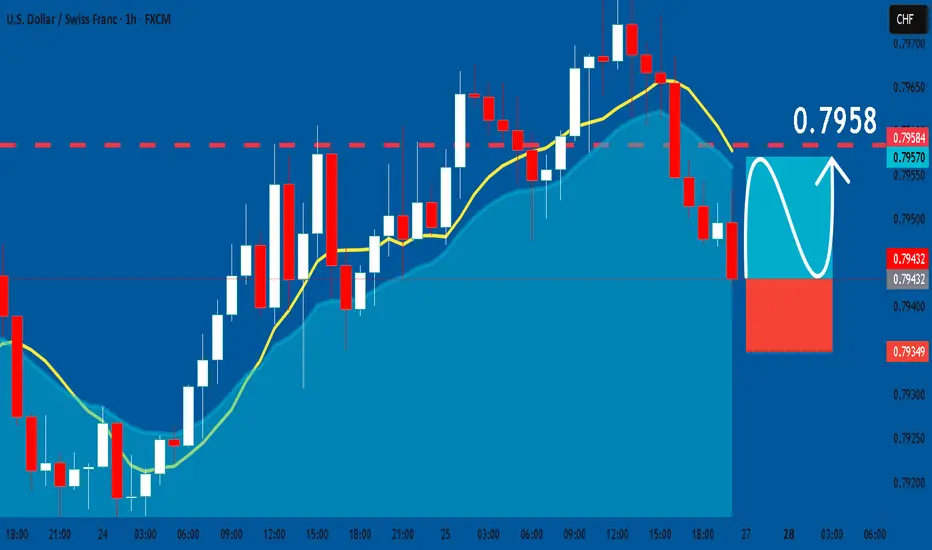
USDCHF: Long Signal Explained
USDCHF
- Classic bullish formation
- Our team expects pullback
SUGGESTED TRADE:
Swing Trade
Long USDCHF
Entry - 0.7943
Sl - 0.7934
Tp - 0.7958
Our Risk - 1%
Start protection of your profits from lower levels
Disclosure: I am part of Trade Nation's Influencer program and receive a monthly fee for using their TradingView charts in my analysis.
❤️ Please, support our work with like & comment! ❤️