BTCUSD What Next? BUY!
My dear friends,
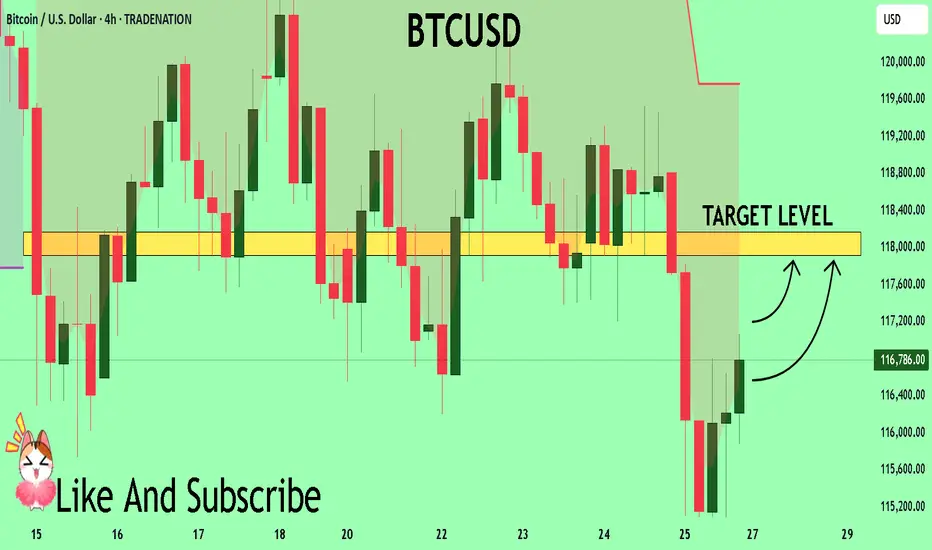
Please, find my technical outlook for BTCUSD below:
The price is coiling around a solid key level - 11678
Bias - Bullish
Technical Indicators: Pivot Points High anticipates a potential price reversal.
Super trend shows a clear buy, giving a perfect indicators' convergence.
Goal - 11791
About Used Indicators:
The pivot point itself is simply the average of the high, low and closing prices from the previous trading day.
Disclosure: I am part of Trade Nation's Influencer program and receive a monthly fee for using their TradingView charts in my analysis.
———————————
WISH YOU ALL LUCK
Wave Analysis
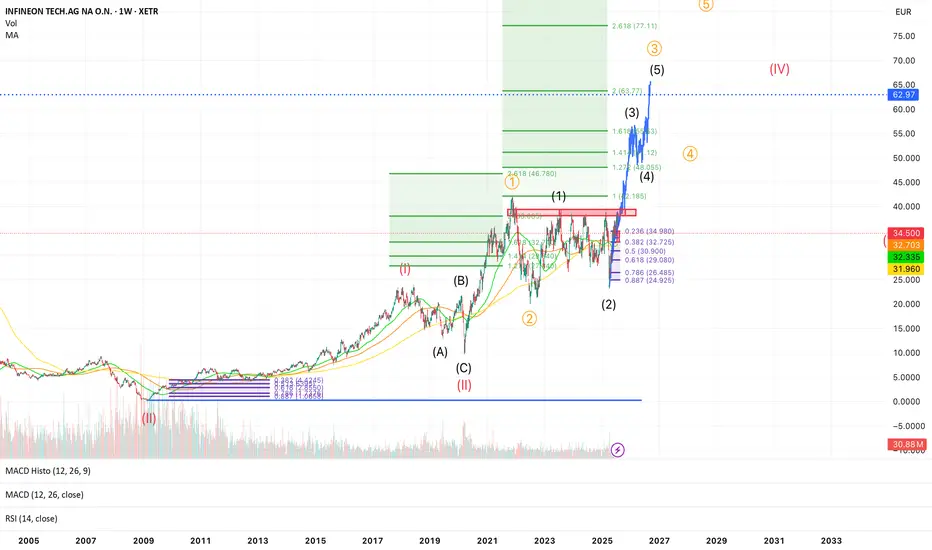
Infineon wave 3 to 62€ Gann-Methode🧠 Infineon (IFX.DE) - Massive Wave 3 in Progress 🚀 | Long-Term Elliott Wave Setup
Ticker: XETR:IFX
Exchange: XETRA 🇩🇪
Chart: Weekly (W1)
Technical Framework: Elliott Wave + Fibonacci + MA + RSI + MACD
🧩 Context:
Infineon has completed a massive corrective wave II (labelled in red) and is now in the early stages of a multi-year impulsive wave III. The price recently rejected at the 0.236 retracement (~35€) and is currently back-testing key moving averages. This zone could represent a wave (2) low of the internal (1)-(2)-(3)-(4)-(5) structure of orange wave ③.
🔎 Structure Breakdown:
✅ Wave (II) (in red) ended as a WXY-Flat-Correction, possibly in 2020
✅ Wave 1 and 2 of wave (III) are complete
✅ Current projection: we are in blue wave (3) of orange wave ③
📈 Fibonacci extensions suggest:
1.618x of wave (1) = ~53.83 €
2.0x = ~63.77 €
2.618x = ~77.11 € – ultimate long-term target for wave ③
🟦 Major resistance: 35–36 €, now acting as support
🟢 Key Moving Averages:
MA (32.7), MA (32.3), MA (31.96) are clustered — strong support zone
📊 Indicators:
MACD: Turning bullish, histogram just crossed above 0
RSI: Neutral (51), still lots of upside potential
Volume: Recent spike suggests accumulation during pullback
🔔 Key Levels:
Level Description
32.7 € Strong support (Fib 0.382 + MA)
39 € Fib 0.5 retracement
46.78 € 2.618x extension of orange wave ①
53.83 € Target: 1.618x of current wave (1)
63.77 € Major resistance / Wave (3) top?
77.11 € 2.618x extension of wave ③
🧠 Thesis:
If the recent low was wave (2), Infineon could be entering a parabolic wave (3) move with +50–100% upside potential over the next 12–18 months. The setup is supported by Elliott Wave structure, MA support, and volume confirmation.
⚠️ Risks:
Breakdown below ~30 € (0.5 Fib) would challenge this count
Macro events (e.g., chip cycle, geopolitics) may affect the timing
✅ Strategy:
I’m watching for confirmation of the local low around 32 €, and then adding during retracements. Targets are scaled into at 46 €, 54 €, and 63 €. Final wave (5) of ③ may push up to 77 €.
USOIL My Opinion! BUY!
My dear friends,
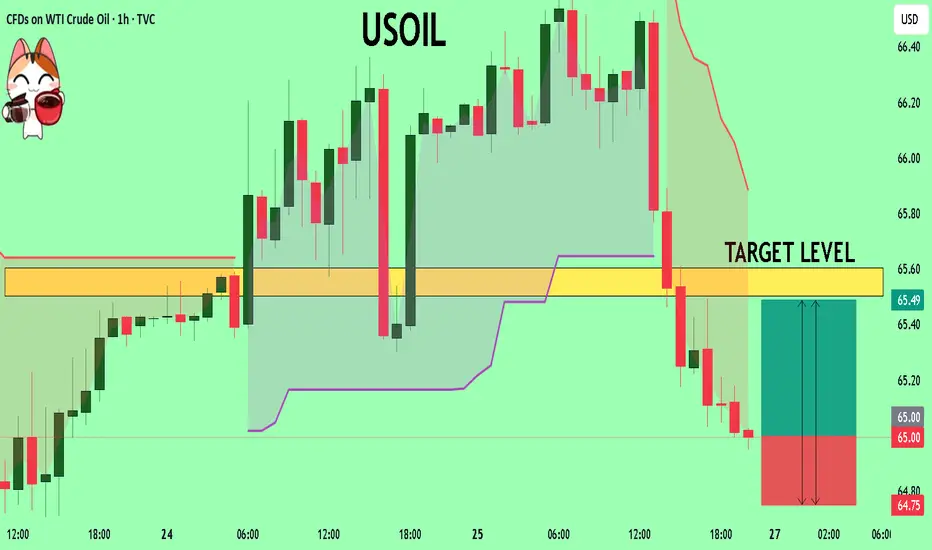
Please, find my technical outlook for USOIL below:
The instrument tests an important psychological level 65.00
Bias - Bullish
Technical Indicators: Supper Trend gives a precise Bullish signal, while Pivot Point HL predicts price changes and potential reversals in the market.
Target - 65.50
Recommended Stop Loss - 64.75
About Used Indicators:
Super-trend indicator is more useful in trending markets where there are clear uptrends and downtrends in price.
Disclosure: I am part of Trade Nation's Influencer program and receive a monthly fee for using their TradingView charts in my analysis.
———————————
WISH YOU ALL LUCK

WXY structure with a double topTesla has been in a uptrend with a corrective structure WXY. I am not sure if the WXY is a part of wave 5 terminal structure or a B wave. However expecting a double top or 78.6 retrace to 425-430 range as a minimum. For this scenario, an impulsive upside move is expected within the next few weeks. However the price needs to move back into the channel next week as a first step.

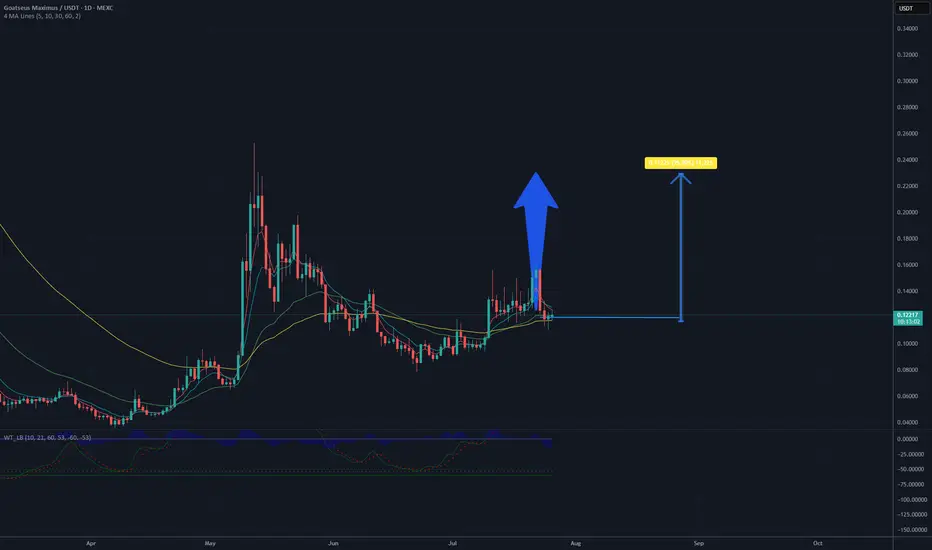
IS it a time for GOATUSDT? 100% potential profit TP - 0.24 $After an extended downtrend, the 4-hour chart of Goatseus Maximus (GMAX) / USDT is showing signs of stabilization and a potential trend reversal. The price has found support in the $0.11–$0.12 range, where accumulation appears to be taking place — characterized by higher lows and an early structure of upward movement.
The WaveTrend (WT_LB) indicator is currently in the oversold zone and beginning to turn upward. This behavior often suggests that selling pressure is weakening and the market may be preparing for a bullish move. A green cross on this indicator can be interpreted as an early buy signal.
Additionally, the moving averages (MA 10, 30, 60, and 120) are starting to flatten out, indicating a potential transition out of the previous downtrend. If the price can break and hold above these averages, it may trigger increased buying interest and momentum.
From a technical standpoint, the $0.14 level remains a key short-term resistance. A successful breakout above this level could open the way for a move toward $0.18, followed by a potential run-up to $0.24, which previously acted as a significant resistance zone and rejection point.
In summary, the current technical setup suggests that if bullish momentum continues and key resistance levels are broken, a move toward $0.24 is achievable in the mid-term.
Potential TP: 0.24 USD
$BTC Wave 4 correction completed -- alternate count.This is not financial advice.
In my previous post, I suggested that Minor Wave 4 could go all the way down to 0.618 fib:
However, after doing a deeper dive into the long squeeze in the last day and looking at its recovery, I think CRYPTOCAP:BTC has completed its corrective Minor Wave 4.
This means that we're looking up towards an impulsive Minor Wave 5.
If Minor Wave 5 completes, in my bullish main Elliot Wave count, we would get a full picture for Intermediate Wave 1.
We would then be able to expect an Intermediate Wave 2 correction.
However, while Wave 2 usually corrects 0.618 fib, this time round, CRYPTOCAP:BTC has shown inclination and strength to correct between 0.236 and 0.328 levels.
And then we will be making that Impulsive Wave 3 up.
That will be bonkers.
ETH | USDHello! This is my bearish scenario for ETH. If we get a weekly or monthly candle close below the red lines above, I’ll be expecting a downward phase toward the 1930 levels within 1–2 months. However, if we can close July above 3725, then my bullish outlook will remain intact.
CRYPTO:ETHUSD BINANCE:ETHUSDT BINANCE:ETHUSDT.P CRYPTOCAP:ETH.D BINANCE:ETHBTC CRYPTOCAP:ETH INDEX:ETHUSD BINANCE:ETHUSDT

Titanwhale: Interest in BTC reaches record high amid $115,000Bitcoin’s market volatility once again made headlines this week as its price dipped sharply to $115,000, marking the most significant single-week correction in nearly a year. Yet behind the price action lies a more telling development: open interest in Bitcoin futures reached an all-time high, crossing the $41 billion mark.
Analysts at Titanwhale emphasize that this dynamic reflects not panic but rather the growing institutionalization of crypto markets, where derivatives are used for strategic hedging and structured exposure.
Rising Open Interest Reflects Institutional Strategy
Despite the 12% price correction from recent highs of $131,000, institutional interest remains robust. Open interest on regulated platforms like the Chicago Mercantile Exchange (CME) surged 38% in Q3, accounting for over $9 billion of total volume.
“We’re seeing a clear shift from speculation to risk management,” said Ethan Ryu, Head of Macro Strategy at Titanwhale. “Derivatives are no longer just trading tools—they’re core components of institutional crypto portfolios.”
Leverage Risks and Market Maturity
The sharp price dip triggered over $1.2 billion in liquidations, particularly among retail traders using high leverage. Still, the overall market structure remains stable: funding rates are neutral, and the options market shows a moderate bullish bias for Q4.
“This is a textbook pullback in a bullish trend. Market structure suggests cooling—not capitulation,” Ryu noted.
Macro Forces and Bitcoin’s Outlook
The correction coincides with renewed inflation concerns and central bank uncertainty. Yet on-chain data from Titanwhale shows that long-term holders are not moving their coins, and exchange outflows suggest continued accumulation.
With the next Bitcoin halving in early 2026 and steady inflows into spot ETFs, analysts at Titanwhale maintain a base-case price recovery to $140,000–$150,000 by Q4 2025, assuming macroeconomic conditions stabilize.
Titanwhale’s Conclusion
The record-high open interest amid a price drop is not a contradiction—it is a sign of market maturity. Bitcoin is no longer just a speculative asset but a structural part of institutional risk strategies.
At Titanwhale, we view the current dip as a potential entry point for sophisticated investors—offering not just upside, but insight into how far the crypto market has evolved.

Is This the Ultimate Bullish Signal for BTC and XRP?In a market often driven by hype and volatility, identifying true bullish signals for digital assets like Bitcoin (BTC) and XRP can be elusive. Yet, a growing convergence of macro, regulatory, and structural market factors may now point to one of the strongest combined bullish setups for these two digital assets in recent memory.
While BTC and XRP differ significantly in purpose and infrastructure—Bitcoin as a decentralized store of value, and XRP as a bridge asset for institutional cross-border payments—they may be aligning in a way that reflects maturing investor confidence and long-term viability.
Institutional Flows Accelerate
Perhaps the clearest bullish indicator lies in the surge of institutional capital into regulated crypto products. Bitcoin ETFs have seen a resurgence in net inflows, surpassing $2.5 billion over the past 30 days, with increased allocations from pension funds and sovereign wealth managers.
At the same time, XRP’s recent regulatory clarity—following the 2023 U.S. court decision stating that XRP is not a security when traded on public exchanges—has prompted renewed interest from financial institutions exploring cross-border payment solutions.
“Regulatory clarity is acting like a springboard for XRP,” said Claire Donovan, Senior Markets Strategist at Atlantic Ridge Digital. “Meanwhile, Bitcoin’s macro narrative—scarcity in an inflationary world—continues to resonate.”
On-Chain Signals Strengthen
On-chain metrics reinforce the optimism. Bitcoin’s hash rate has reached an all-time high, a sign of miner confidence and long-term network security. Simultaneously, the percentage of BTC supply held by long-term holders (LTH) is now above 70%, suggesting strong conviction.
For XRP, active wallet growth and ODL (On-Demand Liquidity) transaction volumes have jumped significantly over the past quarter. According to data from Ripple, ODL volumes grew by 61% quarter-over-quarter—primarily driven by demand from Asia-Pacific and Latin American corridors.
“ODL is no longer experimental—it’s mission-critical infrastructure,” said Donovan. “The market is beginning to reflect that.”
Cross-Market Momentum and Retail Resurgence
Another potentially bullish alignment is emerging from the return of retail sentiment, driven by social media engagement, higher search volumes, and renewed interest in altcoins. XRP has reclaimed a top-5 position by market cap, while Bitcoin dominance remains stable despite an expanding altcoin market.
The macro backdrop also matters. With inflation stabilizing and rate cuts on the horizon in key economies, risk assets are enjoying renewed favor. Bitcoin and XRP, once viewed as speculative, are increasingly seen as part of a diversified portfolio strategy.
Final Thoughts
BTC and XRP may finally be entering a synchronized bullish phase—one rooted not in speculation, but in structural adoption and maturing market dynamics. While both assets face different headwinds, the combination of institutional inflows, regulatory clarity, and strong on-chain metrics may represent the ultimate bullish signal for the rest of 2025.
Investors would do well to watch not just price action, but the convergence of adoption, utility, and trust—elements that now increasingly support both Bitcoin and XRP.

Spot Ether ETFs Log $453M in Inflows, Extend Streak to 16 DaysThe momentum behind Ethereum continues to build as spot Ether exchange-traded funds (ETFs) in the United States and abroad recorded another impressive influx of capital, attracting $453 million in net inflows over the past week. This marks the 16th consecutive day of inflows, underscoring a growing institutional appetite for the second-largest cryptocurrency by market capitalization.
While Bitcoin has long dominated the digital asset ETF landscape, Ether is increasingly capturing the attention of sophisticated investors. Analysts attribute the sustained interest to a combination of macroeconomic factors, evolving regulatory clarity, and Ethereum’s unique position within the decentralized finance (DeFi) ecosystem.
Institutional Endorsement Grows
Several major asset managers, including BlackRock and Fidelity, have reported increased client demand for Ether exposure in recent months. According to data compiled by Bloomberg, the $453 million inflow in Ether ETFs this week is the largest since the products launched, bringing total assets under management (AUM) across major Ether funds to $3.2 billion.
“These consistent inflows are a clear sign that Ether is becoming institutional-grade,” said Mira Taylor, head of digital asset research at Keystone Capital. “It reflects a shift in how the market perceives Ethereum—not just as a tech platform, but as a core financial infrastructure.”
This shift comes amid Ethereum’s continued progress toward scalability, including its transition to proof-of-stake (PoS) and the implementation of Layer-2 scaling solutions such as Optimism and Arbitrum. These upgrades improve network efficiency and reduce gas fees, making Ethereum more attractive for enterprise-level use cases.
Regulatory Developments Provide Tailwind
The surge in investor confidence is also linked to increasing regulatory clarity. The SEC’s tacit approval of spot Ether ETFs in key jurisdictions, including the United States and Europe, has provided the legitimacy many institutions required before allocating capital.
Moreover, Ethereum’s perceived decentralization and utility have helped it avoid the same level of scrutiny that other altcoins have faced. While Ripple’s XRP and Solana remain entangled in legal ambiguities, Ethereum benefits from its early position as a non-security in the eyes of regulators.
Market Outlook
Despite recent volatility in the broader crypto markets, Ethereum has shown resilience. ETH is currently trading around $3,550, up nearly 12% month-over-month. Analysts suggest the inflows into spot Ether ETFs could act as a support mechanism for price, dampening downside volatility.
“ETF inflows often act as a price stabilizer, particularly in a risk-on environment,” said Noah Wexler, macro strategist at Apollo Digital. “If inflows persist, Ethereum could revisit the $4,000 level by Q4.”
Investors and analysts alike will be watching closely to see whether the inflow streak continues into a 17th day. Regardless of short-term price action, the structural trend appears clear: Ethereum is solidifying its role as an investable, institutional-grade asset.
GBPJPY Potential UpsidesHey Traders, in the coming week we are monitoring GBPJPY for a buying opportunity around 197.900 zone, GBPJPY is trading in an uptrend and currently is in a correction phase in which it is approaching the trend at 197.900 support and resistance area.
Trade safe, Joe.

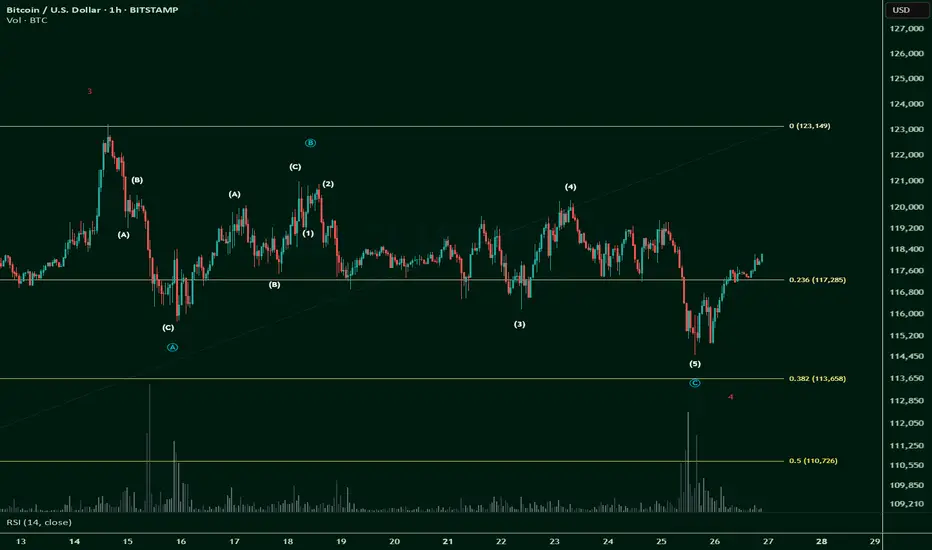
[SeoVereign] BITCOIN BULLISH Outlook – July 26, 2025The previous idea did touch the average TP price, but showed a rather disappointing rebound, so I will once again attempt to capture the starting point of the rebound. It is still considered that one more upward wave remains.
Accordingly, the TP is suggested at 118,057 USDT.
As always, I will carefully observe how the chart develops over time and update this idea with further explanations by organically integrating its specific interpretations and underlying rationale.
Thank you.

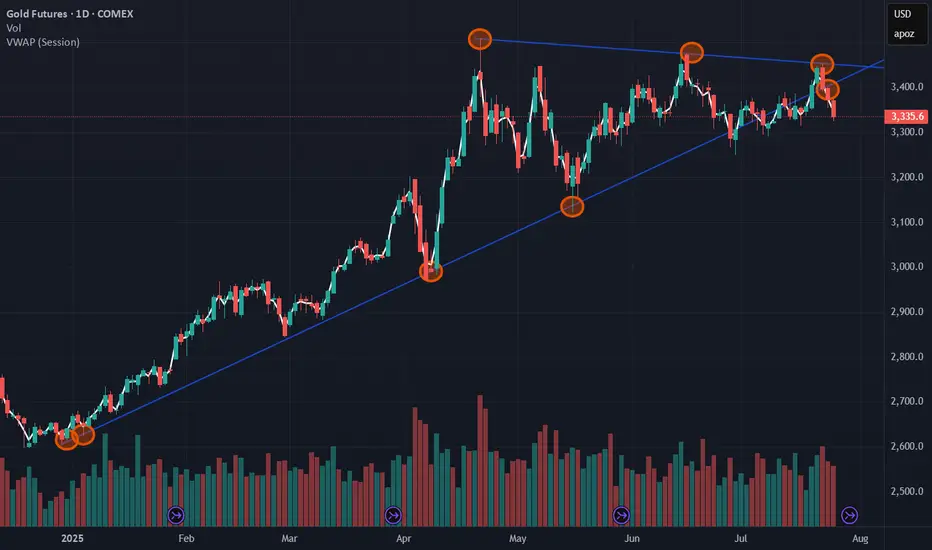
Is GC1! GOLD At A Turning Point - Idea On Short DirectionProbably Gold is not going to be cheaper in the near future but we have seen some points that hold in the past break recently...
This is a view on the Gold chart that is explanatory by itself.
Probably tracing some support horizontally under the price at key level with the idea of, if it break follow the trend in short direction side...
GOLD → Countertrend correction, retest of 3345 before growthFX:XAUUSD , undergoing a deep correction after a false breakout of local resistance at 3433, has reached the support of the upward trend. Will the bulls be able to maintain the trend?
Gold held below $3,400 on Friday, rebounding from $3,350, and is poised to end the week higher. Investors are watching the conflict between Thailand and Cambodia, which is boosting demand for safe-haven assets, and are also awaiting decisions from the Fed and the Bank of Japan next week. The markets received additional support from US trade deals with Asian countries and progress in negotiations with the EU, easing fears of a tariff war.
As part of the correction, gold is testing trend support and the 3345-3337 zone of interest. A false breakdown, lack of downward momentum, and bulls holding prices above 3345 could trigger growth and a continuation of the main upward trend.
Resistance levels: 3375, 3383
Support levels: 3345, 3337, 3330
Technically, the support level of 3345 plays a fairly important role in the market. If, during the correction, the bulls manage to hold their ground above this zone, the prospects for recovery will be high, especially against the backdrop of geopolitical problems.
Best regards, R. Linda!

GBPUSD → Retest of previously broken resistance...FX:GBPUSD has entered a correction phase after breaking through the local downtrend. If the price remains in the 1.3450–1.346 zone, this will confirm the formation of a new trading range...
The market is entering a correction phase due to the dollar. A countertrend retest of the support zone is forming. Earlier, the currency pair broke the local trend and is entering a flat phase. The retest of support may end with a recovery. If, within the local movement and after a false breakout of the 1.345 - 1.3467 zone, the bulls keep the price above the buying zone, then in the short and medium term, we can expect growth to continue.
Support levels: 1.3467, 1.345
Resistance levels: 1.35, 1.3584
A false breakdown of support at 1.3467 will confirm a change in the local trend (correction). The market may return to the recovery phase of the global trend.
Best regards, R. Linda!

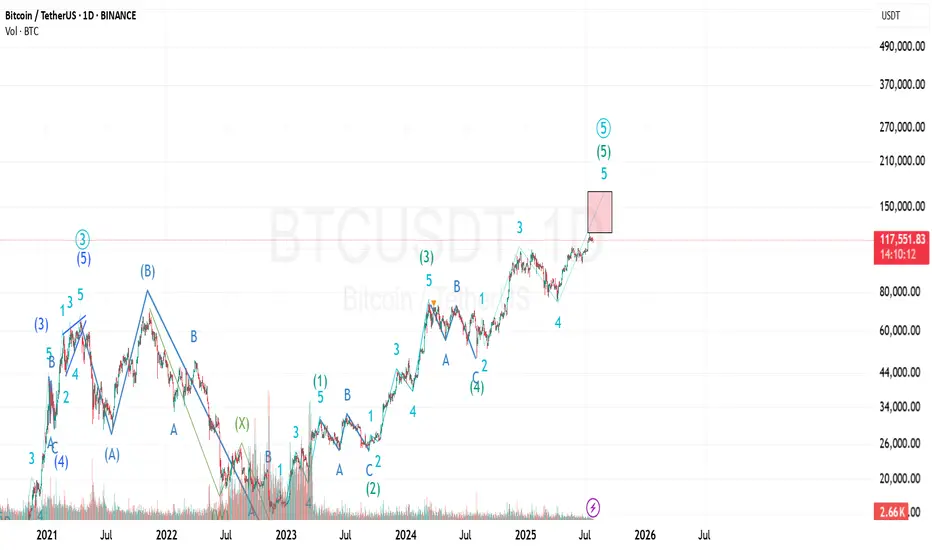
Bitcoin Prediction UpdateI've just modified the wave count and still the previous analysis is valid...
I'm not sure about the target of the last wave (the 5th of 5th wave) because it can be an extended wave...
The shown box is where I'll investigate to find any ending pattern...
XAUUSD Update July 2025 - PLAN B - Bulls RejectionAfter Hard fall from 3439 ( 3450 rejection ), Gold will retest 3310 support.
If bounce from here, it will move upside and retest 3373 resistance.
If any hard rejection from 3373 resistance area, its a sign that price will move to make a lower low.
Becarefull in this accumulation zone.
Bearish movement still hiding before it break 3120 support.
Have a blessing day !


Wyckoff ReaccumulationCurrent range looks like another reaccumulation range. Spring has just occurred and looking for a move back and then above the top of the range.
Bearish if we breakout then retrace forming an upthrust after distribution (UTAD).

Gold Trade SetupI will risk!!!
It seems we are near at the end of correction wave...
The first target R/R is 2 and the second is 4...

BTC - Trap, Tap, and Blast Off!BTC has been overall bullish, trading within the rising blue channel (1). After reaching a local high, it entered a short-term correction, forming a falling red channel (2).
👀All eyes are now on the key demand zone (3), which aligns with the lower bound of both the red channel and the rising blue structure.
🔎As long as this confluence holds, we anticipate a potential bullish impulse in August.
A retest of the $111,500–$112,000 zone could serve as the trigger for the next leg toward $128,000. Let’s see if BTC is gearing up for another breakout or if a deeper correction is in play.
🔔 Disclaimer: This analysis is for educational and informational purposes only. It does not constitute financial advice or a recommendation to buy or sell any asset. Always do your own research and manage your risk accordingly.
📚 Always follow your trading plan => including entry, risk management, and trade execution.
Good luck!
All strategies are good, if managed properly.
~ Richard Nasr

Review on the 1st 3 Elite PairYou can follow us for more Analysis(Images and Videos) with Precise definition of the Financial Market.ENJOY!!!
