ETHUSD Will Go Down From Resistance! Sell!
Here is our detailed technical review for ETHUSD.
Time Frame: 1D
Current Trend: Bearish
Sentiment: Overbought (based on 7-period RSI)
Forecast: Bearish
The market is testing a major horizontal structure 3,641.87.
Taking into consideration the structure & trend analysis, I believe that the market will reach 2,871.15 level soon.
P.S
Overbought describes a period of time where there has been a significant and consistent upward move in price over a period of time without much pullback.
Disclosure: I am part of Trade Nation's Influencer program and receive a monthly fee for using their TradingView charts in my analysis.
Like and subscribe and comment my ideas if you enjoy them!
Wave Analysis

GBPUSD Will Go Higher! Long!
Take a look at our analysis for GBPUSD.
Time Frame: 4h
Current Trend: Bullish
Sentiment: Oversold (based on 7-period RSI)
Forecast: Bullish
The market is approaching a key horizontal level 1.344.
Considering the today's price action, probabilities will be high to see a movement to 1.351.
P.S
Please, note that an oversold/overbought condition can last for a long time, and therefore being oversold/overbought doesn't mean a price rally will come soon, or at all.
Disclosure: I am part of Trade Nation's Influencer program and receive a monthly fee for using their TradingView charts in my analysis.
Like and subscribe and comment my ideas if you enjoy them!

EURCAD Will Go Down! Short!
Please, check our technical outlook for EURCAD.
Time Frame: 15m
Current Trend: Bearish
Sentiment: Overbought (based on 7-period RSI)
Forecast: Bearish
The market is approaching a significant resistance area 1.608.
Due to the fact that we see a positive bearish reaction from the underlined area, I strongly believe that sellers will manage to push the price all the way down to 1.607 level.
P.S
The term oversold refers to a condition where an asset has traded lower in price and has the potential for a price bounce.
Overbought refers to market scenarios where the instrument is traded considerably higher than its fair value. Overvaluation is caused by market sentiments when there is positive news.
Disclosure: I am part of Trade Nation's Influencer program and receive a monthly fee for using their TradingView charts in my analysis.
Like and subscribe and comment my ideas if you enjoy them!

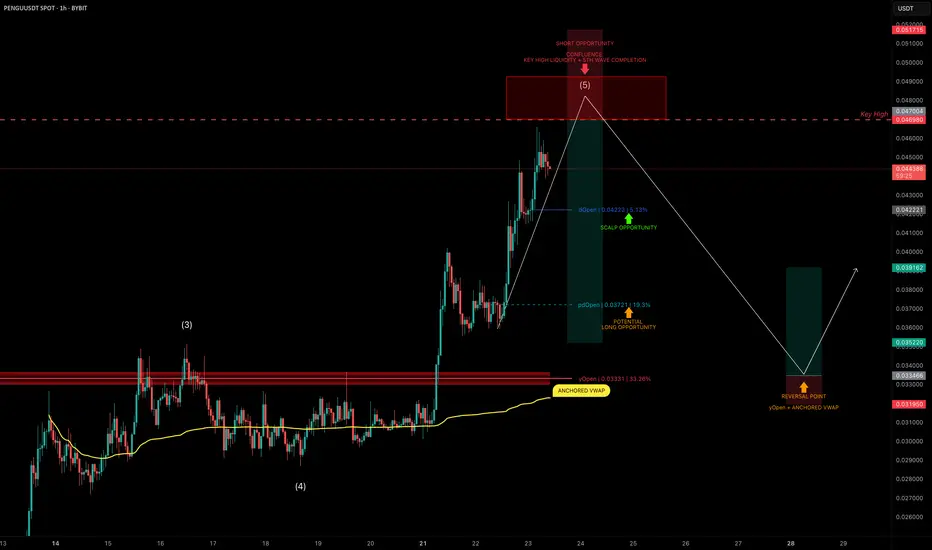
PENGU Topping Out? Targeting 30% Downside After Liquidity SweepPENGU has had an explosive run, but it now looks to be nearing completion of wave 5 of its current Elliott impulse.
We’re approaching a key high at $0.04698, a likely liquidity grab zone — and potentially a great area to position for a short trade.
🧩 Short Setup Overview
➡️ Wave 5 Completion Incoming:
Price is showing signs of exhaustion as it approaches $0.04698, where liquidity is likely stacked above the previous high.
➡️ SFP Trigger Zone:
Watch for a swing failure pattern (SFP) at $0.04698 — confirmation for a potential short entry.
➡️ Psychological Resistance:
The $0.05 level also sits just above — a classic psychological barrier that may get tapped or wicked into.
🔴 Short Trade Setup
Entry: After a confirmed SFP at $0.04698–$0.05
Target (TP): Yearly Open (yOpen) — potential move of ~30%
Stop-loss: Above post-SFP high
R:R: Excellent asymmetry if setup confirms
🛠 Indicator Note
In this analysis I'm using my own indicator called "DriftLine - Pivot Open Zones ", which I recently published.
✅ It helps highlight key open levels, support/resistance zones, and price structure shifts — all critical for confluence-based trade planning.
Feel free to check it out — you can use it for free by heading to my profile under the “Scripts” tab.
💡 Educational Insight: How to Trade Wave 5 Liquidity Sweeps
Wave 5 tops often trap late longs, especially when paired with psychological levels and key highs.
➡️ Patience is key — wait for a rejection pattern or SFP before entering.
➡️ Liquidity sweeps first — then the move.
Final Thoughts
PENGU is pushing toward $0.04698–$0.05, but this may be its final move up before correction.
With the yearly open as a logical target, and clear confluence via DriftLine, this setup offers a clean short opportunity — if confirmation comes.
Stay sharp, let price lead, and trade the reaction — not the prediction.
_________________________________
💬 If you found this helpful, drop a like and comment!
Want breakdowns of other charts? Leave your requests below.
EU possible buy idea?7 days ago, I shared a bullish idea that remains valid despite price failing to hold above 1.04321.
Current Market Analysis:
Price appears to be forming an Elliot Wave 2 (a-b-c) correction.
Key Levels to Watch:
- 38.2% Fibonacci retracement level (minimum required for Wave 2)
- 88.7% Fibonacci retracement level (maximum allowed for Wave 2 to maintain bullish bias)
Trade Plan:
With my initial position at break-even, I'll employ dollar-cost averaging for additional buys targeting 1.065 :
1. 50% Fibonacci retracement level
2. 61.8% Fibonacci retracement level
3. 78.6% Fibonacci retracement level
Stop Loss: 1.017
This is not a financial advice but if you must take the trade, apply proper risk and money management while scaling into the trade.

CAD/JPY BEARS WILL DOMINATE THE MARKET|SHORT
Hello, Friends!
CAD-JPY uptrend evident from the last 1W green candle makes short trades more risky, but the current set-up targeting 106.478 area still presents a good opportunity for us to sell the pair because the resistance line is nearby and the BB upper band is close which indicates the overbought state of the CAD/JPY pair.
Disclosure: I am part of Trade Nation's Influencer program and receive a monthly fee for using their TradingView charts in my analysis.
✅LIKE AND COMMENT MY IDEAS✅

AUD/JPY SENDS CLEAR BEARISH SIGNALS|SHORT
Hello, Friends!
AUD/JPY pair is in the uptrend because previous week’s candle is green, while the price is clearly rising on the 4H timeframe. And after the retest of the resistance line above I believe we will see a move down towards the target below at 96.380 because the pair overbought due to its proximity to the upper BB band and a bearish correction is likely.
Disclosure: I am part of Trade Nation's Influencer program and receive a monthly fee for using their TradingView charts in my analysis.
✅LIKE AND COMMENT MY IDEAS✅

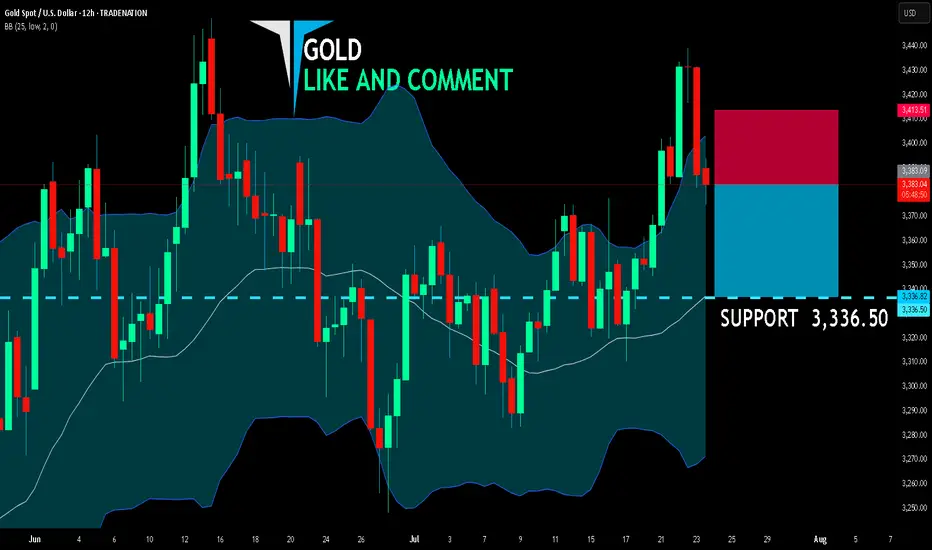
GOLD BEARS ARE STRONG HERE|SHORT
GOLD SIGNAL
Trade Direction: short
Entry Level: 3,383.09
Target Level: 3,336.50
Stop Loss: 3,413.51
RISK PROFILE
Risk level: medium
Suggested risk: 1%
Timeframe: 12h
Disclosure: I am part of Trade Nation's Influencer program and receive a monthly fee for using their TradingView charts in my analysis.
✅LIKE AND COMMENT MY IDEAS✅
BTC DOMINANCE Update (1D)It seems that Bitcoin dominance may soon experience upward corrections, as it has broken through several support zones to the downside without any reaction and is now close to another support area. Usually, when the market maker pushes the price through multiple supports without a reaction, the price can retrace from a nearby support.
The price may soon move to complete wave G.
We have considered two different scenarios for the fluctuations of this index. However, note that this chart is a derivative chart, and the fluctuations may not follow the schematic exactly, but this analysis gives us a good view of the support and resistance zones and the probable path.
For risk management, please don't forget stop loss and capital management
Comment if you have any questions
Thank You
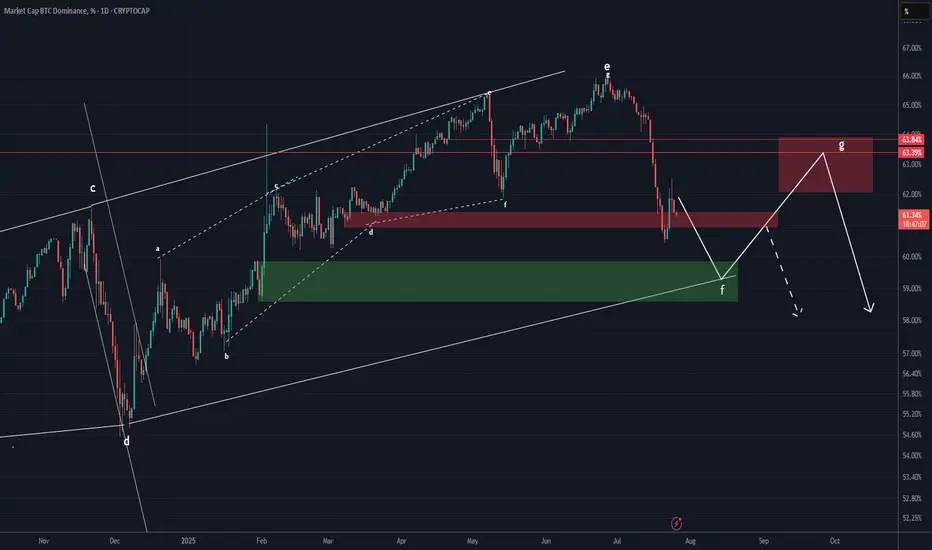
BTC DOMINANCE Looks Bearish (1D)Bitcoin Dominance seems to have completed its bullish structure.
An order block is forming and has been broken to the downside, a trigger line has been lost, and wave g has come to an end.
If Tether dominance also declines, altcoins may remain in the green.
The 62 level is the target drop zone for this index.
For risk management, please don't forget stop loss and capital management
Comment if you have any questions
Thank You

BTC should have one more leg upAccording to Elliot waves BTC should have one more impulse leg up to complete final wave of this cycle. Both daily and weekly RSI charts show bearish divergence, suggesting momentum is weakening even as price attempts to climb. A drop below $110000 would invalidate the current wave count and suggest a shift in market structure.
. Need to watch out reactions at target levels 136-150.

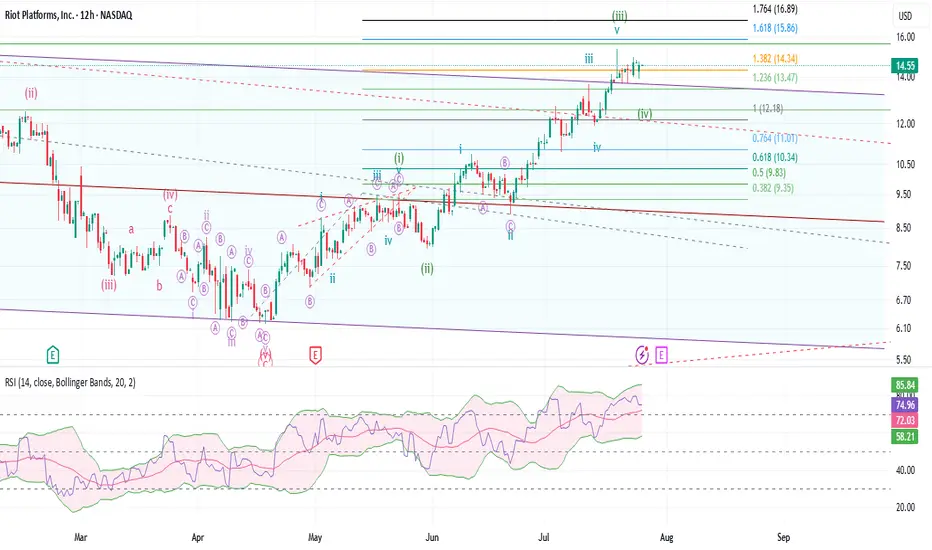
RIOT: Sideways is goodRIOT has broken above a very important downward channel dating back July of 2023. It is imperative that RIOT stays above the channel. The sideways consolidation while BTC and the crypto market corrects is a pretty good sign. Next week might be more of the same, maybe a bit more down to gain the momentum back for the last leg up. If we get the final move up, it will confirm a 5 waves sequence. The target would be between 2 to 2.618 extension between $18.68 to $24.33.
On the flip side, going back inside the channel would be a sign of weakness. Going back to $11 would be a confirmation of bull run end. All will depend on how the broader crypto market performs for the next 2 weeks or so.
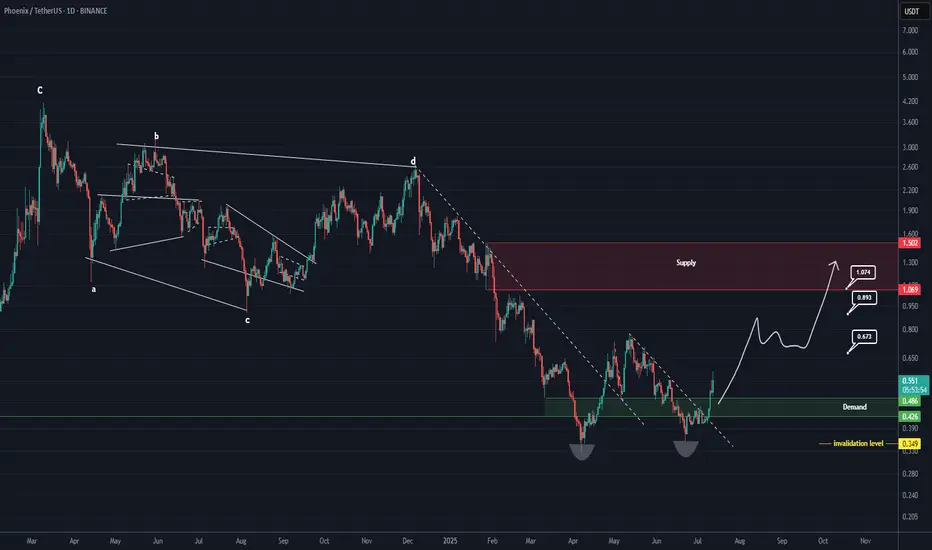
PHB Looks Bullish (1D)It appears that wave E has ended after a long consolidation and the formation of a double bottom. A key trigger line has been broken, and the price has reclaimed the flip zone (marked in green).
As long as the green zone holds, the price can move toward the targets and the red box.
The targets are marked on the chart.
A daily candle closing below the invalidation level will invalidate this analysis.
For risk management, please don't forget stop loss and capital management
Comment if you have any questions
Thank You
Weekly Range for nifty (applicable till the expiry)This are mathematical calculation not based on important level of fib or support level that are derived by most of the Technical trader.
just trade the level with few point stop loss. for grabbing greater points.
please do check out sensex where few greater points are explained.

FILUSDT trading ideaFILUSDT broke down from a bearish formation and has since been trading within a descending channel, carving out what appears to be a 3-wave corrective structure (ABC) to complete wave W of a broader corrective pattern.
Price is now approaching a critical zone where wave X is expected to develop. If price manages to break above the projected sell-off zone, bullish momentum could reclaim control, opening the path toward the next major target at $18.308.
However, a rejection at this key resistance would likely trigger another downward leg, pushing the price back into the immediate demand zone. A failure to hold this support would significantly increase the risk of a deeper breakdown toward the projected wave Y target around $0.995, completing the extensive correction structure.
This is a pivotal moment for FILUSDT, We should closely monitor price action around the sell-off zone for clues on whether bulls can reclaim dominance or if the correction will deepen further.

Xvgusdt buy opportunity you don't want to miss!!!!Xvgusdt is currently trading within a potential ascending setup following a 5-leg drop, signaling a potential upward breakout.
We have identified a clear setup for potential accumulation and recommend establishing a stop loss level to manage risk in the event of a reversal.
Your engagement is valuable, so if you find this setup helpful, please consider liking the post and sharing your comments.
Thank you for your support.

CAD-JPY Rebound Ahead! Buy!
Hello,Traders!
CAD-JPY made a retest
Of the horizontal support
Of 107.400 from where we
Are already seeing a bullish
Rebound and we will be
Expecting a further bullish
Move up
Buy!
Comment and subscribe to help us grow!
Check out other forecasts below too!
Disclosure: I am part of Trade Nation's Influencer program and receive a monthly fee for using their TradingView charts in my analysis.

Don’t miss this Move on LTBRLTBR forming a classic cup and handle with confluence in the timing of recent institutional exposure.
The chart speaks for itself

Bitcoin on the edge – Is a sharp drop coming?Bitcoin is keeping investors on edge as price action remains volatile and primed for an explosive move once news or capital flows ignite the market.
🌍 Latest market updates:
– Whales are back in accumulation mode, with on-chain data showing large wallets growing rapidly.
– The U.S. government has just transferred a significant amount of BTC to exchanges — is a dump coming?
– U.S. spot Bitcoin ETFs are witnessing record inflows after CPI came in lower than expected, fueling hopes that the Fed will pause further rate hikes this year.
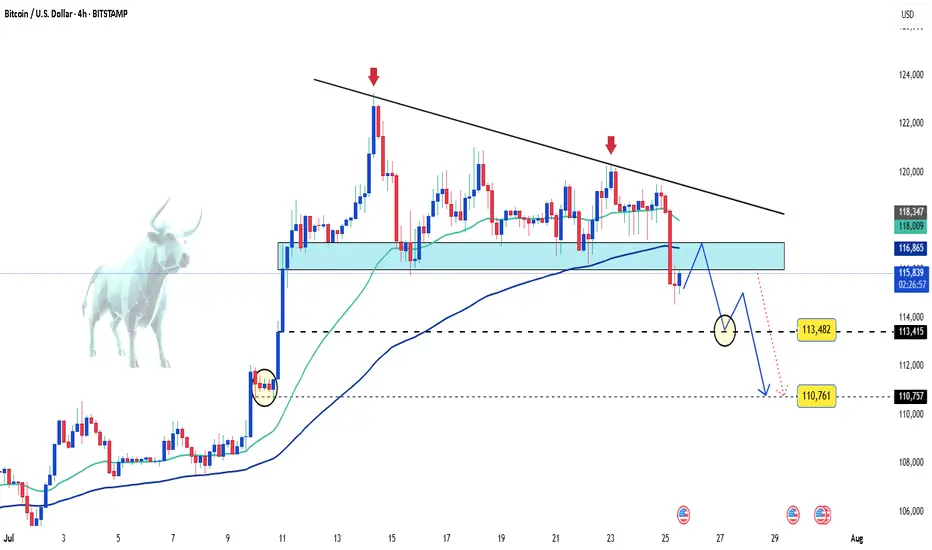
📉 Technical outlook:
– On the H4 chart, BTC formed a tightening wedge pattern, which has now broken to the downside.
– A steep drop toward the 113,000 to 110,000 USD zone is entirely possible.
This looks like a classic break-retest setup — a golden window for strategic entries. If sell volume surges, it could be the perfect moment for bears to strike.
Stay sharp — and good luck!
Btcusd outlook
Price tapped into our area and showed strong reaction.
Now watching how it behaves around 118.4k and 120.7k.
If bulls stay in control, 122k could be next.
Let’s see how it unfolds. 🔍📈

DRS this ATM machine may need a breatherGreat stock great company, just think is time to consolidate, still has some final waves to form top.

XAUUSD clean to dropXAUSD CLEAN TO DROP for the next 3 weeks
I will bee waiting for this set up and now all that we need is patience

XRP to 2.80So, conjugate waveform or Elliot wave retracement is 5 steps. With 3 being the longest. 5 obviously the lowest. Once a demand or supply zone is tapped/broken into, they want the extreme of that zone. That's why I think 2.80 low.
With, 1234 break on Z out of the bearish Pennant into the demand. Forming the bottom of the, now larger C&H.
And aAaAway we go!
