OceanPal Inc.Stock on triggering level now .
Target price above 3$
Positive Powerful wave on its way now any moment 💯
Highly recommended for Buying now as much as you can 🔊 👍
Wave Analysis

Healthcare Triangle Inc.Stock on Triggering mode . And Target price 6.73$ ( D ) .
At that level a distribution level will reach .
Highly recommended for Buying Now , as much as you can 🔊 👍

AUDNZD: Short Signal Explained
AUDNZD
- Classic bearish formation
- Our team expects fall
SUGGESTED TRADE:
Swing Trade
Sell AUDNZD
Entry Level - 1.0926
Sl - 1.0929
Tp - 1.0920
Our Risk - 1%
Start protection of your profits from lower levels
Disclosure: I am part of Trade Nation's Influencer program and receive a monthly fee for using their TradingView charts in my analysis.
❤️ Please, support our work with like & comment! ❤️

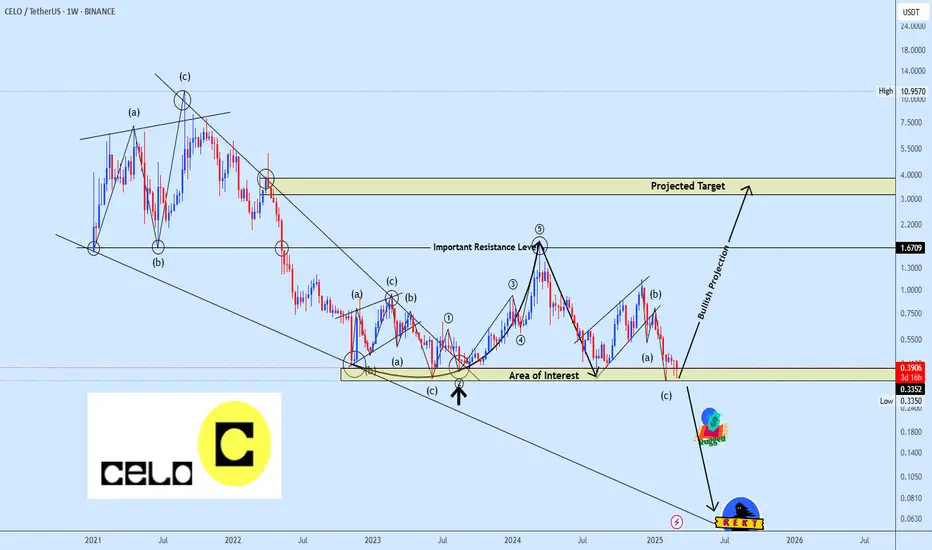
Celousdt trading ideaCELOUSDT initially broke out bullish from a falling wedge but faced strong rejection at the critical $1.67 resistance level, triggering a significant sell-off that retraced the entire breakout move.
Price has now retested the initial bottom, positioning the market for a potential double-bottom formation, contingent on the $0.3352 support holding firm. If confirmed, the projected upside target extends towards the $4 region, aligning with key structural levels.
However, a breakdown below this crucial support would invalidate the bullish scenario, exposing the asset to deeper losses and amplifying downside risks.
Market reaction at this zone will dictate the next major move.
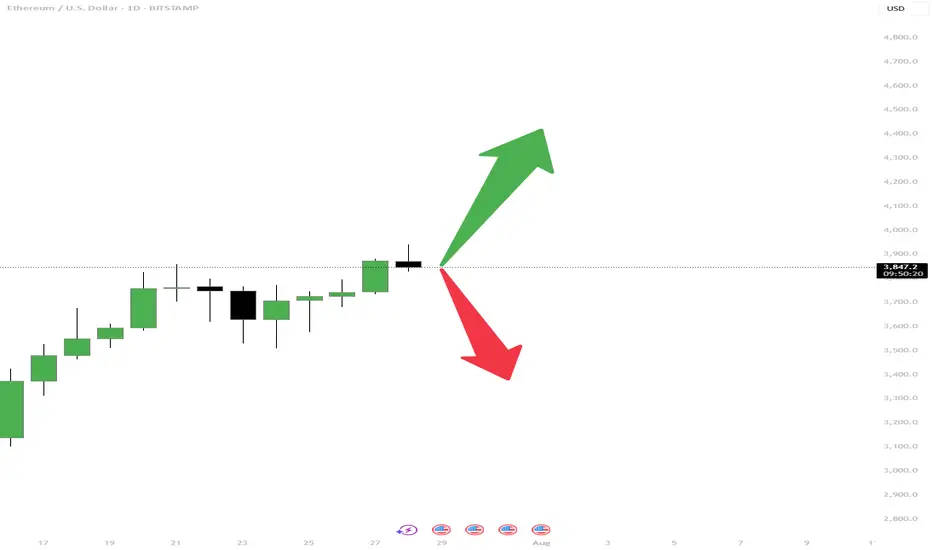
ETH is at a turning point — What would you do?Hey traders, how's everything going with you?!
The price has been increasing for days, but now it’s slowing down. From here, ETH can either:
🟢 Go higher and continue the uptrend
🔴 Or drop and start a pullback
This is a key moment. Some traders are preparing to buy the breakout, others are waiting to sell the drop, and some are watching for more clues.
👉 If this were your chart, would you do:
Buy?
Sell?
Wait?
Comment below and let’s learn from each other 👇. I would also appreciate it if you could hit the boost and follow!
Have a great day, everyone!
-Neo
Bitcoin Dominance: 2021 vs. 2025History repeats itself... 🔄
🧘♂️ The most important thing is to stay calm and approach this with a clear head. Don’t assume that just because #altcoins did a 2x in a month, they’ll immediately do another 10x without any pause or correction.
🪜 Markets move in stages — two steps up, one step down. That’s exactly how it played out in 2021: after the first major BTC.D drop, we spent two months in a range, which turned out to be the final pause before the altseason. 🔥
I’m confident we’ll see something similar now — and don’t forget, August is traditionally the slowest month of the year. On top of that, the Dollar Index (see this morning’s update) looks ready for a rally, which could temporarily stall crypto momentum.
I’m not trying to scare anyone — just encouraging you to assess the situation rationally and avoid falling into FOMO. 🐋 Patience pays off !

NASDAQ Potential UpsidesHey Traders, in today's trading session we are monitoring NAS100 for a buying opportunity around 23,140 zone, NASDAQ is trading in an uptrend and currently is in a correction phase in which it is approaching the trend 23,140 support and resistance area.
Trade safe, Joe.

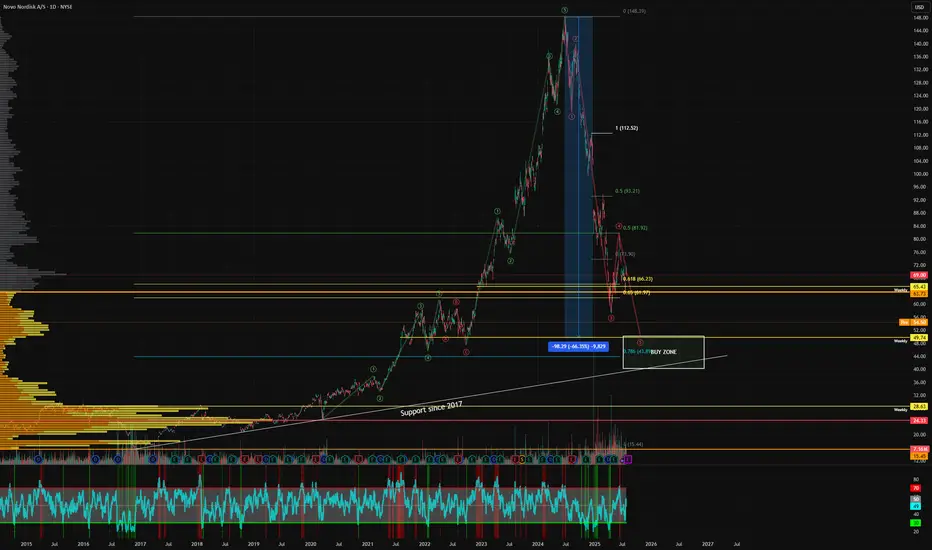
Final Drop?This looks like the final puke of wave 5. It could end up anywhere between $40-50. I have taken a position at $50 and I intend to load up more if we retest the historical support trendline.
Not financial advice, do what's best for you
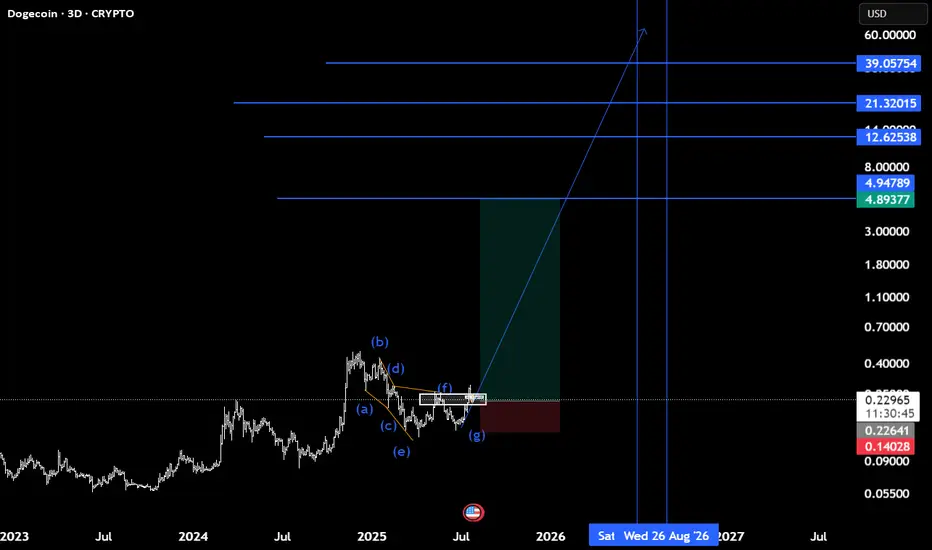
Doge(based on NEo wave)confirmation of finishing the E wave of triangle is here now.
it takes about 400 days for all targets to pass.
see the related last chart of doge.
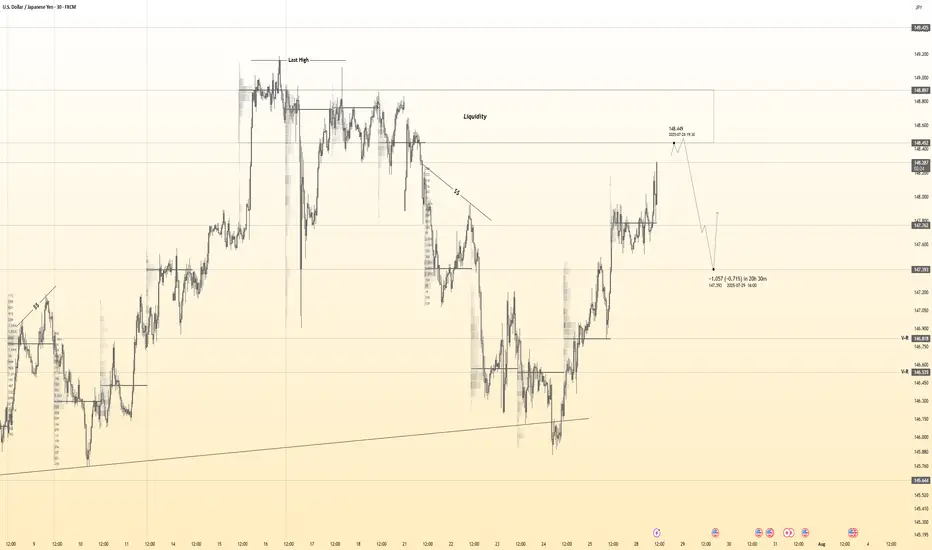
USDJPY 30Min Engaged (Buy & Sell Reversal Entry's Detected )Time Frame: 30-Minute Warfare
Entry Protocol: Only after volume-verified breakout
🩸Bullish Reversal - 148.350
🩸Bearish Reversal - 148.370
➗ Hanzo Protocol: Volume-Tiered Entry Authority
➕ Zone Activated: Dynamic market pressure detected.
The level isn’t just price — it’s a memory of where they moved size.
Volume is rising beneath the surface — not noise, but preparation.
🔥 Tactical Note:
We wait for the energy signature — when volume betrays intention.
The trap gets set. The weak follow. We execute.

NASDAQ Potential UpsidesHey Traders, in today's trading session we are monitoring NAS100 for a buying opportunity around 23,300 zone, NASDAQ is trading in an uptrend and currently is in a correction phase in which it is approaching the trend at 23,300 support and resistance area.
Trade safe, Joe.

$TSLA: Breakout Wave Dimensions🏛️ Research Notes
Apart from known compression patterns for Tesla, there is another squeeze happening on smaller scale:
That area will be processed to derive the chart-based levels and see how market reacts to them.
Triangle
Breakout Expansion

GBPCAD - Long-Term Long!Hello TradingView Family / Fellow Traders. This is Richard, also known as theSignalyst.
📈GBPCAD has been overall bullish trading within the rising wedge pattern marked in blue.
This week, GBPCAD has been retesting the lower bound of the wedge.
Moreover, the red zone is a strong weekly structure.
🏹 Thus, the highlighted blue circle is a strong area to look for buy setups as it is the intersection of the lower blue trendline and red structure.
📚 As per my trading style:
As #GBPCAD approaches the blue circle zone, I will be looking for trend-following bullish reversal setups (like a double bottom pattern, trendline break , and so on...)
📚 Always follow your trading plan regarding entry, risk management, and trade management.
Good luck!
All Strategies Are Good; If Managed Properly!
~Rich
Disclosure: I am part of Trade Nation's Influencer program and receive a monthly fee for using their TradingView charts in my analysis.

USDJPY 30Min Engaged ( Bearish Reversal Entry Detected )Time Frame: 30-Minute Warfare
Entry Protocol: Only after volume-verified breakout
🩸Bearish Retest - 148.450
➗ Hanzo Protocol: Volume-Tiered Entry Authority
➕ Zone Activated: Dynamic market pressure detected.
The level isn’t just price — it’s a memory of where they moved size.
Volume is rising beneath the surface — not noise, but preparation.
🔥 Tactical Note:
We wait for the energy signature — when volume betrays intention.
The trap gets set. The weak follow. We execute.
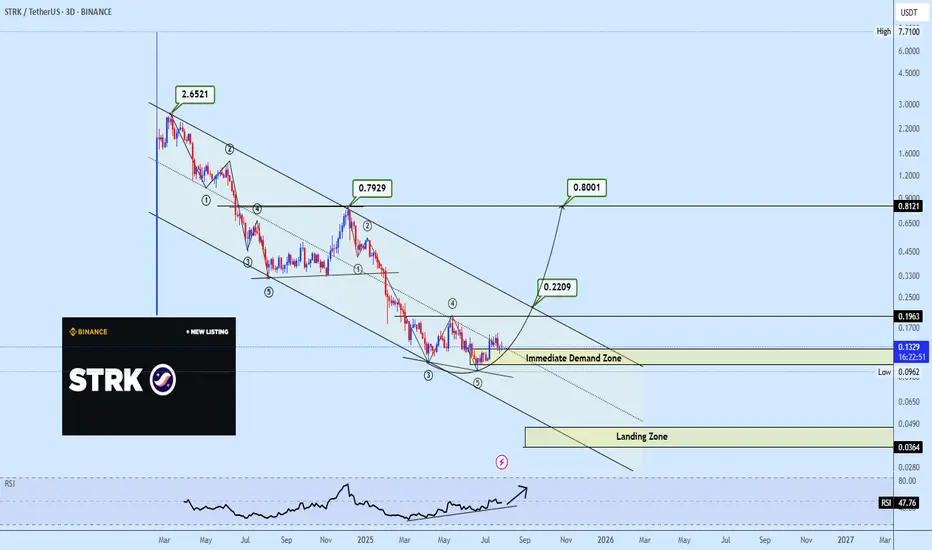
Descending Channel in Play STRK’s Next Move Could Be ExplosiveSTRKUSDT continues its decline within a well-defined descending channel, with the most recent bounce coming directly off the bottom boundary of the channel. This rebound aligns with a confirmed bullish divergence on the RSI, suggesting the current move may mark a key inflection point.
As price climbs, attention now shifts to the upper boundary of the channel, which serves as a key structural resistance. A break above this upper trendline would signify a reversal from the prevailing downtrend, validating the first higher high in the micro to mid-term, with upside potential toward $0.2422 and $0.7856, as shown on the chart.
However, failure to clear the upper boundary could trigger a sharp rejection and initiate another round of sell-off, potentially dragging price into a deeper landing zone below the demand level.
XAUUSD SELL Don’t Miss This MoveAnalyzing market structure and liquidity using Price Action and Smart Money Concepts. Focuse
d on key supply/demand zones and institutional order flow

gold 4hour say: put sellstop in lowpersonaly i predict mini crash on gold and waiting for it , now we have powerfull 3angel pattern we must put sellstop in last low , buystop on last high
sellstop stoploss = last high
if sellstop open like new traders , dont close it soon , wait minimum 2 week ,understand?
ALERT= if gold can break last high , it can start new up trend, wave , so if you have old sells ,you must put SL or hedge buystop in last low
if sell
wishhhhhhhhhhhhhh youuuuuuuuuuuuuuuu win

SELL CHFJPY for bullish trend reversal SELL CHFJPY for bullish trend reversal
STOP LOSS : 185.38
Trade trade is based on false breakout and divergence.....
First what is false breakout, A false breakout in Forex occurs when the price breaks through a key level (like support or resistance) but quickly reverses and returns to its original range, often trapping traders who were expecting a continuation of the breakout. It's essentially a false signal, indicating a potential trend reversal or continuation, but the price doesn't follow through....
Secondly what is divergence ,In forex trading, divergence occurs when the price of a currency pair moves in one direction, while a technical indicator (like an oscillator) moves in the opposite direction. This mismatch can signal a potential trend reversal or weakening trend. There are two main types: bullish and bearish divergence.
On this trade we are taking it because we saw regular bearish divergence
Regular Bearish Divergence
In case of Regular Bearish Divergence:
* The Indicator shows Lower Highs
* Actual Market Price shows Higher Highs
We can see a strong divergence on the RSI already and There is a strong trend reversal on the daily time frame chart.....
The daily time frame is showing strength of trend reversal from this level resistance so we are looking for the trend reversal and correction push from here .....

Nasdaq Short: Catching a rising knife. Stop loss at 23500.Hi everyone, here I am trying to catch the peak of Nasdaq again. As mentioned, the previous idea was stopped out at 23,320. Now, for this idea, I am attempting another short with a 30 points risk for Nasdaq. The stop for this idea is fixed at 23,500. The take profit is 22,650.
This is a positional trade and I will re-evaluate as the waves unfolds. So the strategy will mainly be trailing the stop periodically.
Thank you and good luck!

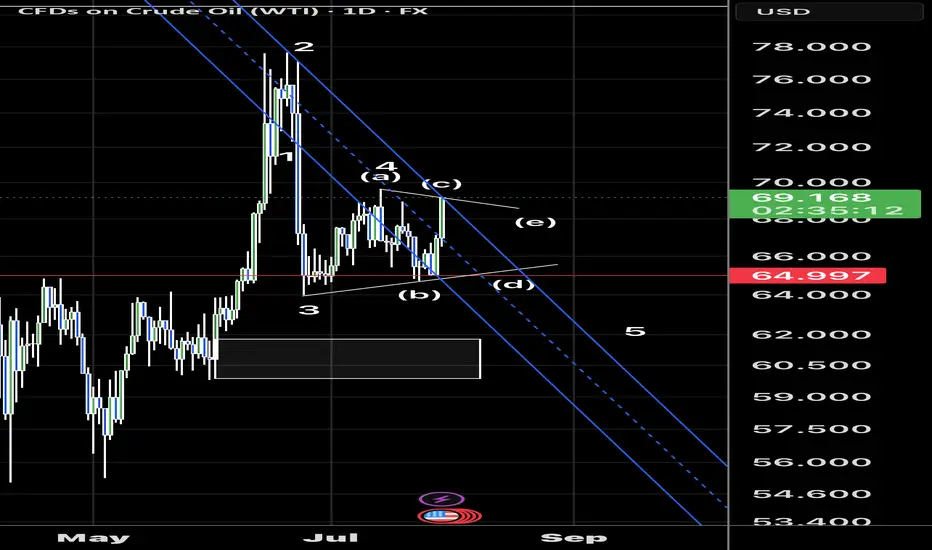
Crude hit the c wave finish of a triangle ? Crude finishing up the c wave of a triangle? Let’s see if we turn this lower in a d wave of a possible 4th wave triangle

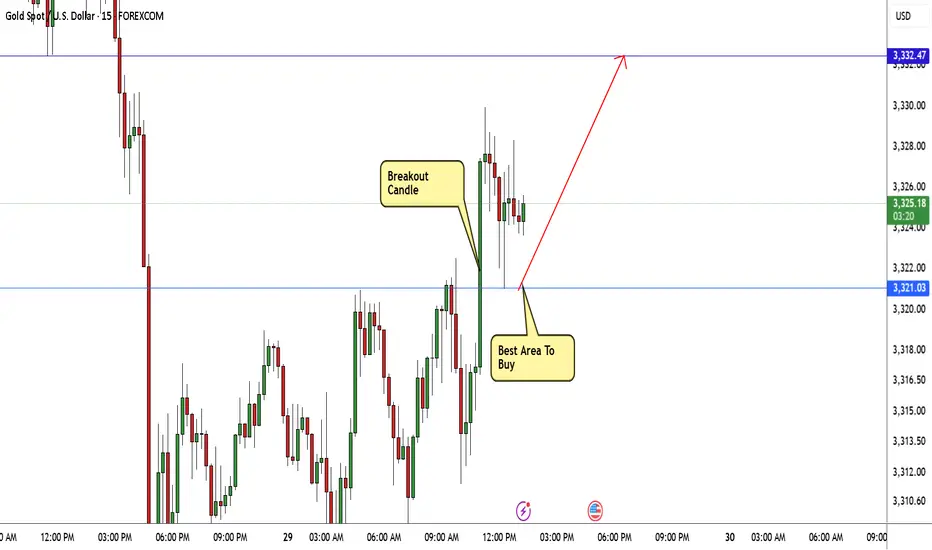
GOLD Breakout Done , Long Setup Valid To With Great ProfitHere is My 15 Mins Gold Chart , and here is my opinion , we finally above 3321.00 and we have a 15 Mins Candle closure above this strong res , so I'm waiting the price to go back and retest this res and new support and give me a good bullish price action to can enter a buy trade , and if we have a 4H Closure Above This res this will increase the reasons for buyers , just wait the price to back a little to retest it and then we can buy it . if we have a daily closure below it this idea will not be valid anymore .
EUR/USD Will Continue Melting Be Sure To Be Part Of That!Here is my thought of EURUSD chart today. I think that this pair can go down further more specially after breaking this strong area of support and old resistance. as shown on the chart we can wait for the price to come back again and retest this area once and then this will be the best place to enter a sell trade. I am targeting around 250n pips in this trade. as I said I will wait for a retest and a good bearish price action and from there I will enter a sell trade.
