WEEKLY NYA turns and E Wave see 12/8 2024 forecast The chart of the NYA I have not changed or relabeled anything since 12/8 2024 best trades WAVETIMER
Wave Analysis

NYA 5of 5 of 5 into the spirals and solar peak Mayan 1987The chart posted has Not had one labeling changed since My view 11/29 12/6 cycle peak

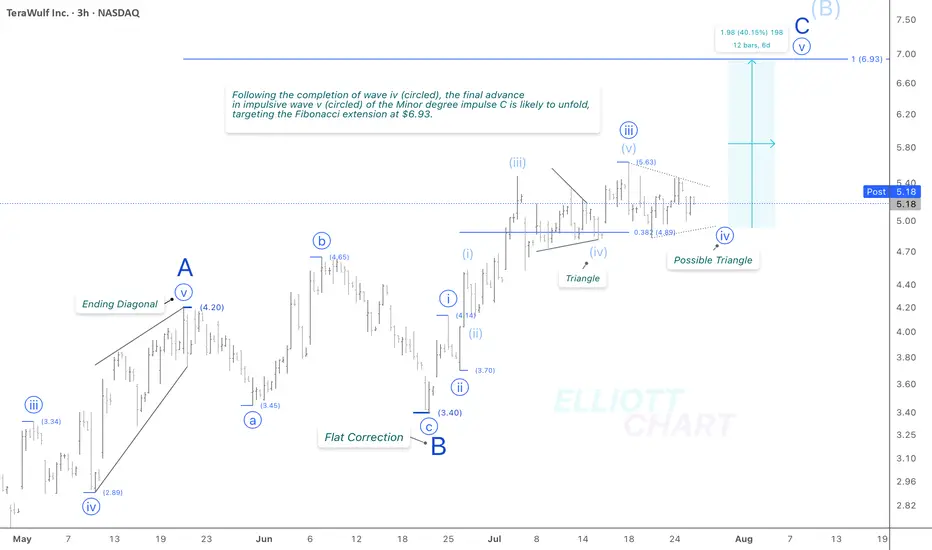
WULF / 3hWave Analysis >> While the overall outlook on NASDAQ:WULF remains consistent with the previous analysis, the ongoing sideways volatility suggests a need to reassess the wave count on the final stages of Minor degree impulsive advance in wave C.
The Fib extension target remains intact >> 6.93
Trend Analysis >> Upon completion of Minor degree wave C, the countertrend advance of Intermediate degree wave (B), which has been unfolding since April 9, is likely to give way to a decline in wave (C) of the same degree. This downtrend might begin in the coming days and potentially extend through the end of the year!!
NASDAQ:WULF CRYPTOCAP:BTC BITSTAMP:BTCUSD MARKETSCOM:BITCOIN
#CryptoStocks #WULF #BTCMining #Bitcoin #BTC
EthusdIt looks bearish.I think we would see another bearish impluse wave, after breaking (d) of a 🔺️ triangle.
If price goes up and passes (c) , the pattern is then canceled.

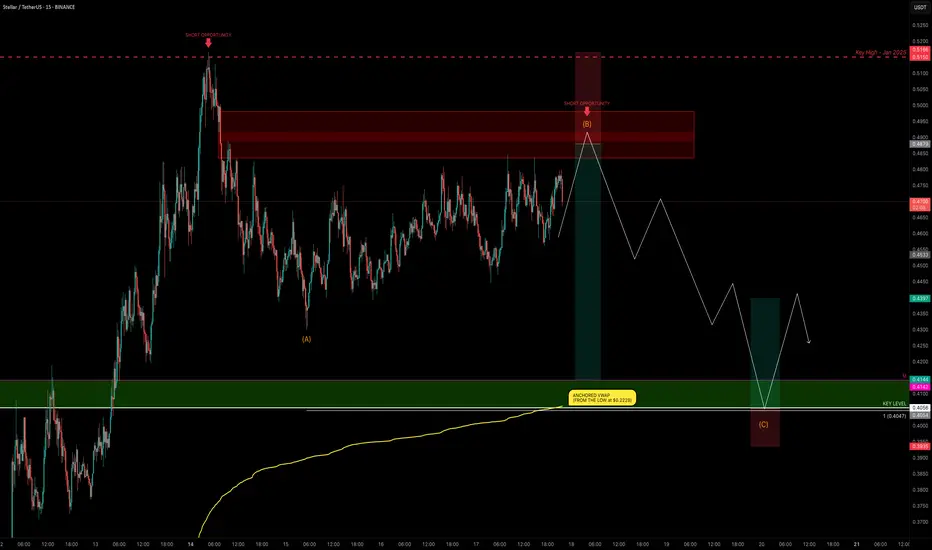
XLM Explodes +132% — Is the Party Over or Just Starting?XLM has been one of the top movers, sweeping the January 2025 swing high at $0.515 before stalling and moving sideways for the past 4 days.
Is XLM gearing up for another push toward the highs, or is a correction imminent?
Let’s dive into the details.
🧩 Market Structure & Fractal Pattern
XLM skyrocketed +132% in just 13 days, mirroring the explosive move seen back in November 2024.
If we apply the November fractal, the current price action suggests we could be setting up for an ABC corrective move.
📉 Key Levels & Confluences
FVG Zone: ~$0.49–$0.50 — likely to be swept before any major move down.
Monthly Support: $0.4142
Key Level / Liquidity Pool: $0.4056 — likely cluster of stop-losses.
Anchored VWAP (from $0.2228 start of trend): currently near $0.4056, adding strong confluence.
1.0 Trend-Based Fib Extension (ABC projection): If price pushes to ~$0.49 to complete wave B, the projected 1.0 TBFE for wave C lands right on the $0.4056 key level + VWAP, creating a perfect confluence zone.
➡️ Conclusion: The $0.4142–$0.4056 zone is a critical support and liquidity area with multiple confluences lining up.
Trade Setups
🔴 Short Setup:
Entry zone: $0.48–$0.50 (ladder in)
Stop-loss: Above $0.5166 (prior high)
Take-profit: $0.4142–$0.4056 zone
R:R ≈ 1:3
🟢 Long Setup:
Entry zone: $0.4142–$0.4056 (preferably near VWAP)
Stop-loss: Below $0.395
Take-profit: $0.44
⚡ Final Thoughts
Watch for a potential final push toward $0.49–$0.50 before a corrective wave unfolds.
The confluence at the $0.4142–$0.4056 zone — including monthly/weekly levels, VWAP, liquidity pool, and the 1.0 TBFE target — makes it a key area for decision-making.
Stay patient and wait for confirmation at these levels. Will post an update as things unfold!
_________________________________
💬 If you found this helpful, drop a like and comment!
Want breakdowns of other charts? Leave your requests below.
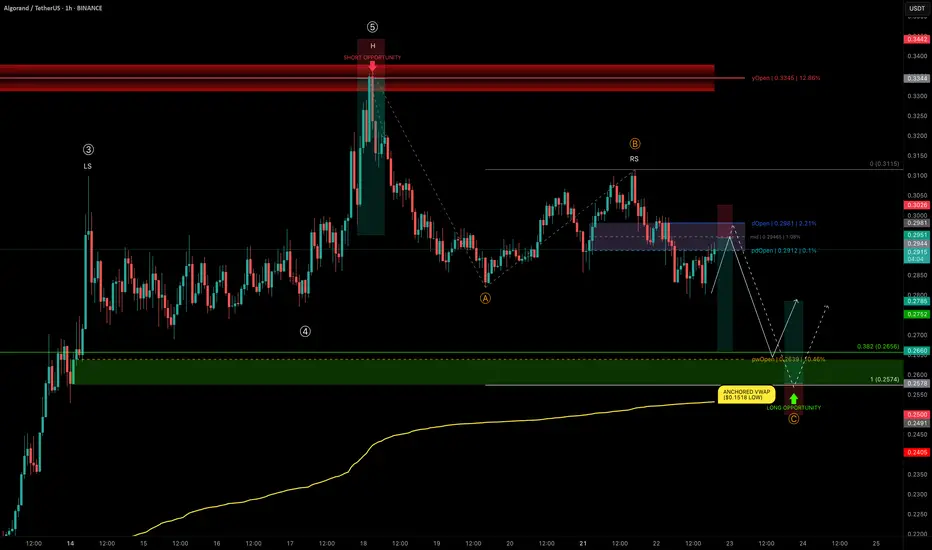
ALGO rejects at yOpen — Mapping High-Conviction Trade ZonesALGO has delivered an impressive +124% rally from $0.1518 to $0.336 in just 25 days, completing a 5-wave Elliott impulse right into the yearly open resistance.
We are now in a correction phase, and the current structure is showing a head and shoulders pattern, with the right shoulder currently forming.
Let’s break down the key levels and setups.
🧩 Technical Breakdown
➡️ ABC Corrective Structure:
Targeting wave C near the trend-based fib extension (TBFE) at $0.2574
➡️ Fib Retracement Confluence:
0.382 retracement of the entire 5-wave move → $0.2656
Previous weekly open (pwOpen) → $0.2639
Liquidity pocket likely to be swept
Anchored VWAP from the $0.1518 low (start of the bullish trend) → currently at $0.2532, acting as a major support layer
Conclusion: Long opportunity zone between $0.2656–$0.2574
Trade Setups
🔴 Short Setup:
Why? ALGO has lost dOpen and pdOpen — a bearish sign for downward continuation.
Entry Zone: Between dOpen and pdOpen
Stop-loss: Above dOpen
Target (TP): 0.382 fib retracement (~$0.2656)
R:R: ≈ 1:3.5
🟢 Long Setup:
Entry Zone: Laddered Entries between $0.2656–$0.2574
Stop-loss: Below anchored VWAP (~$0.2532)
Target (TP): ~$0.2785+
R:R: ≈ 1:2.65
🛠 Indicator Note
I’m using my own indicator called "DriftLine - Pivot Open Zones " for this analysis, which I recently published.
✅ Feel free to use it in your own analysis!
Just head over to my profile → “Scripts” tab → apply it directly to your charts.
💡 Educational Insight: Why Confluence Matters
High-probability trades aren’t based on just one tool or level — they come from confluence, where multiple signals align: fib levels, VWAP, liquidity pools, price structures , and key levels.
For example, in this ALGO setup, it’s not just the fib retracement or just the VWAP — it’s the stacking of all these elements together that creates a precise zone with a better statistical edge.
✍️ Lesson: Don’t chase trades off single signals; stack tools for confirmation.
Patience, confirmation, and confluence — as always, the keys to high-probability setups. 🚀
_________________________________
💬 If you found this helpful, drop a like and comment!
Want breakdowns of other charts? Leave your requests below.
BLDE – VolanX Smart Cycle Activation📈 BLDE – VolanX Smart Cycle Activation
Timeframe: Weekly
Posted by: WaverVanir International LLC | VolanX Protocol
Model: Accumulation → Manipulation → Expansion
After multiple Breaks of Structure (BOS) and prolonged markdown, BLDE has now confirmed a Smart Money Accumulation Cycle. A clear manipulation sweep below prior lows has triggered the upside phase. This chart follows the classic SMC model with:
🔹 Accumulation → Trap → Manipulation → Expansion
🔍 Key Observations:
Accumulation zone: $2.00–$4.00
Trap high: ~$5.00 (liquidity run & rejection)
Clean reclaim of $3.92 structure now acting as launchpad
Next zones of interest:
• $6.35
• $6.58
• $6.76
• Ultimate distribution zone: $9.90
📊 VolanX Thesis:
We are entering a Mark-Up Phase consistent with the VolanX Alpha Expansion Model. As liquidity rotates upward, expect a stair-step climb toward the equilibrium zone near $9.90.
🧠 Strategic Insight:
If price pulls back into the $3.92–$4.10 range, that would be considered a high-probability re-entry for bulls aligned with institutional footprints.
🛡️ Risk Lens:
Monitor for early distribution at $6.76. VolanX Guardian Protocol flags rising volume anomalies in that range.

NZD/AUD update for the weekend and trade management ideas.Both the main and add-on positions are in a secure spot and can be protected by tightening the stop loss if one chooses. In the longer-term picture, the analysis is the same. I am expecting this to complete the push to the top of this channel. We could exit now around 1.7 : 1 RR. Not bad for a trade taken a couple days ago, but I like the hold here personally.

S&P 500 Index Wave Analysis – 25 July 2025
- S&P 500 Index broke key resistance level 6300.00
- Likely to rise to resistance level 6500.00
S&P 500 Index recently broke the key resistance level 6300.00 (which stopped the previous waves 5 and (B), as can be seen below).
The breakout of the resistance level 6300.00 continues the active intermediate impulse wave (5) from the middle of this month.
Given the strong daily uptrend, S&P 500 Index can be expected to rise to the next resistance level 6500.00 (coinciding with the daily up channel from May).

Toncoin Wave Analysis – 25 July 2025- Toncoin reversed from resistance level 3.5585
- Likely to fall to support level 3.0000
Toncoin cryptocurrency recently reversed down from the key resistance level 3.5585 (which is the upper boundary of the sideways price range inside which the price has been trading from April).
The key resistance level 3.5585 was strengthened by the upper daily Bollinger Band.
Given the strongly bearish crypto sentiment seen today, Toncoin cryptocurrency can be expected to fall to the next round support level 3.0000 (former resistance from the start of July).

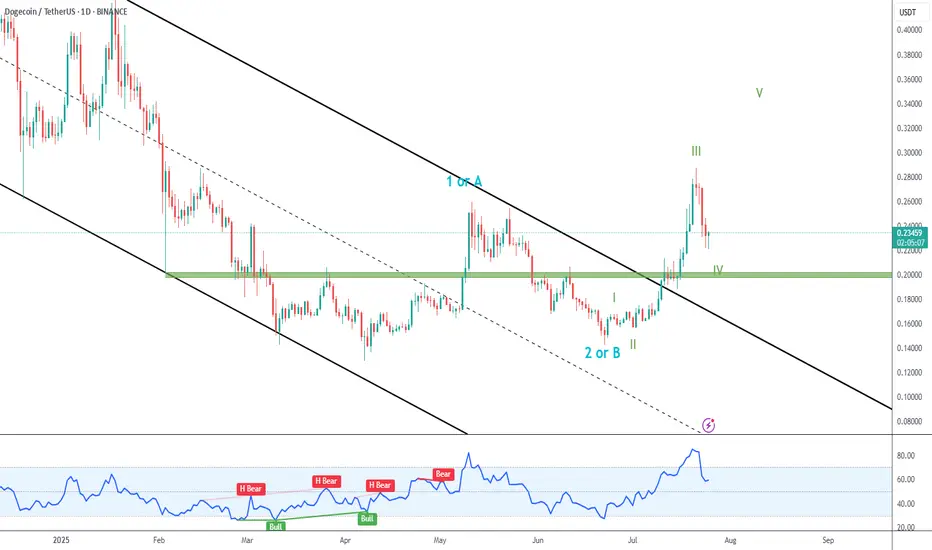
Dogecoin Wave Analysis – 25 July 2025
- Dogecoin reversed from resistance zone
- Likely to fall to support level 0.2000
Dogecoin cryptocurrency recently reversed down from the resistance zone between the key resistance level 0.2630 (former monthly low from December, acting as the resistance now), standing near the upper daily Bollinger Band.
This resistance zone wad further strengthened by the 38.2% Fibonacci correction of the previous sharp downward impulse from December.
Given the clear daily downtrend, Dogecoin cryptocurrency can be expected to fall to the next round support level 0.2000 (target price for the completion of the active correction ii).

DOGE Breakout
➡️ Dogecoin blasted away from the black descending channel and past green resistance (now support).
➡️ In my primary count, we are currently in green IV correction, and expect new higher highs.
➡️ A retest of green support would be nice, but it is probable that price won´t go that far.
GBPNZD Bearish Breakout!
HI,Traders !
#GBPNZD is trading in a strong
Downtrend and the pair
Broke the key horizontal
Level around 2.23918 which
Reinforces our bearish
Bias and we will be
Expecting a further
Bearish move down
On Monday! !
Comment and subscribe to help us grow !

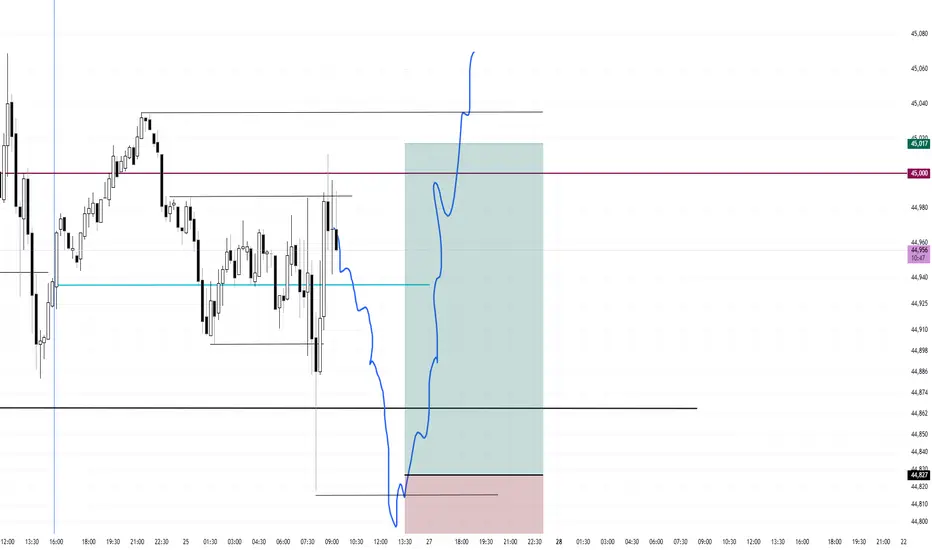
Range Bound Low of Day Buy (If Presented)Price is mean reverting around 45,000 and also mean reverting around today's open. I will be waiting for a mean reversion play under the low of day targeting the high of day.
I will be waiting for a small entry candle, a small doji. I did not take this first run up because the entry vs stop would have been too large. I believe the first mouse in will get dunked on.
Once entered, I will use a 75 tick stop and a 190 tick target for a 2.5 to 1
Bitcoin - The cycles are playing out!⚔️Bitcoin ( CRYPTO:BTCUSD ) just repeats another cycle:
🔎Analysis summary:
Following all of the previous all time high breakouts, Bitcoin will now further extend the rally. After some simple calculation, we can see that Bitcoin will rally another +50% in order to reach the overall price target. However there will be volatility along the way so make sure to remain calm.
📝Levels to watch:
$200.000
SwingTraderPhil
SwingTrading.Simplified. | Investing.Simplified. | #LONGTERMVISION

next levels for Dogecoin id very promising honest and well-made TA for doge next levels , with explanations and know how notes full of evedinces with solid knowledg of TA and Volume prifiles with calsics too. btc also , startes is wave D formation upwords, after that a good correction is comming to the market for late entries who did not see our TA's before and now . your support join and share some of a littile bit of your profit will make you make more and safe in this very hard market. peace and stay safe

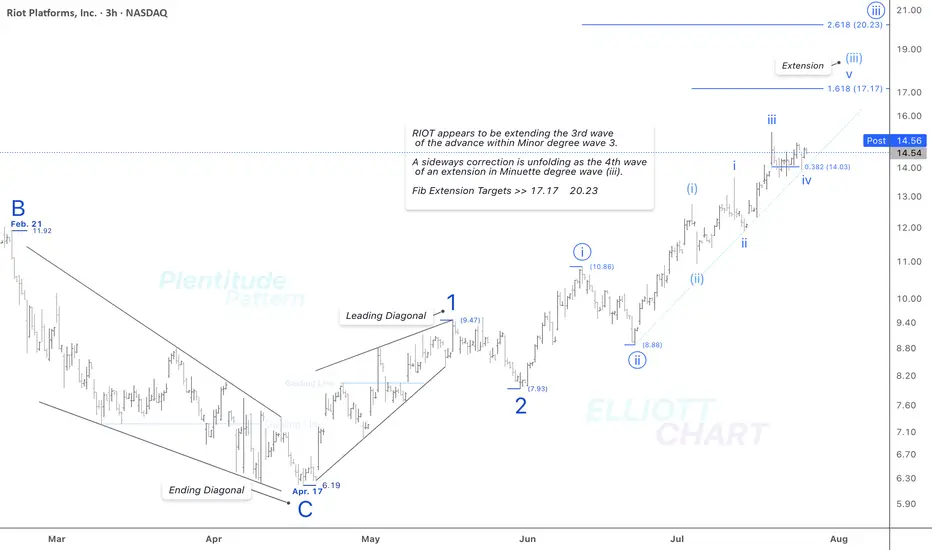
RIOT / 3hAs illustrated on the 3-hour chart above, NASDAQ:RIOT appears to be extending the third wave of an impulsive advance within Minor degree wave 3.
And as anticipated, a sideways correction is unfolding as the fourth wave of the ongoing extension in Minuette degree wave (iii).
Fib Extension Targets >> 17.17 & 20.23.
>>> In this timeframe, I'm analyzing the initial rising tide within the ongoing Intermediate degree wave (1), where a nested series of waves have quite well revealed: 1, 2 → i (circled), ii (circled) → (i), (ii) → i, ii. The extreme high of this impulsive sequence lies beyond the visible range of the current chart.
NASDAQ:RIOT CRYPTOCAP:BTC BITSTAMP:BTCUSD MARKETSCOM:BITCOIN
#CryptoStocks #RIOT #BTCMining #Bitcoin #BTC
USDJPY BullishAfter exiting a correction, the first impulse (Wave 1) appears. I expect a retracement of at least 50% of the Fibonacci.

Long $BABA - NYSE:BABA is testing 200 SMA
- NYSE:BABA moves are explodes higher then cools then retest support then explodes higher than the last high. It's called trading with higher wavelength
-> Move 1: Started April 2024 when the trend reversal started. $68 -> $89 with around +30% then retraced $90 -> $72 ( -20% )
-> Move 2: July 2024, $72 -> $116 (+61%) then retraced $116 -> $80 ( -31% )
-> Move 3: Jan 2025, $80 -> $146 (+ 82.5%) then retraced $146 -> $108?? ( correction underway ) ~ -26% so far
-> Move 4: Likely from $100-105 to $180-200

LUMIA/USDTLUMIA/USDT has shown strong bullish momentum, with the first leg printing over +100% gain—signaling early strength and buyer dominance. Over the past two weeks, price action has been consolidating in a tight re-accumulation phase, forming a healthy base just above previous resistance . This phase appears to be nearly complete, and the chart structure suggests it's gearing up for the next impulsive leg upward.
A break above the short-term range high with strong volume will likely confirm the continuation. We’ve marked the green box as the ideal entry zone, aligning with recent demand and structural support.

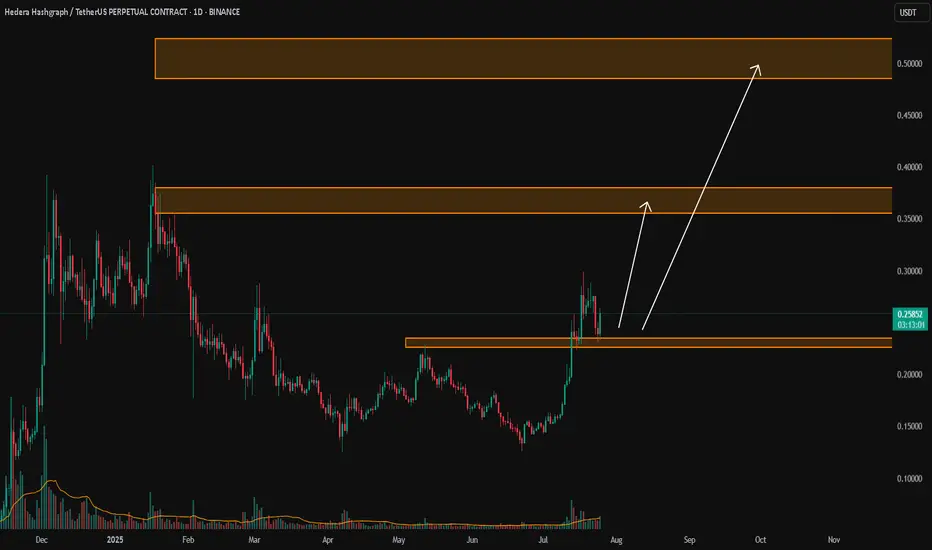
HBAR/USDTKey Level Zone: 0.22600 - 0.23500
LMT v2.0 detected.
The setup looks promising—price previously trended upward with rising volume and momentum, then retested this zone cleanly. This presents an excellent reward-to-risk opportunity if momentum continues to align.
Introducing LMT (Levels & Momentum Trading)
- Over the past 3 years, I’ve refined my approach to focus more sharply on the single most important element in any trade: the KEY LEVEL.
- While HMT (High Momentum Trading) served me well—combining trend, momentum, volume, and structure across multiple timeframes—I realized that consistently identifying and respecting these critical price zones is what truly separates good trades from great ones.
- That insight led to the evolution of HMT into LMT – Levels & Momentum Trading.
Why the Change? (From HMT to LMT)
Switching from High Momentum Trading (HMT) to Levels & Momentum Trading (LMT) improves precision, risk control, and confidence by:
- Clearer Entries & Stops: Defined key levels make it easier to plan entries, stop-losses, and position sizing—no more guesswork.
- Better Signal Quality: Momentum is now always checked against a support or resistance zone—if it aligns, it's a stronger setup.
- Improved Reward-to-Risk: All trades are anchored to key levels, making it easier to calculate and manage risk effectively.
- Stronger Confidence: With clear invalidation points beyond key levels, it's easier to trust the plan and stay disciplined—even in tough markets.
Whenever I share a signal, it’s because:
- A high‐probability key level has been identified on a higher timeframe.
- Lower‐timeframe momentum, market structure and volume suggest continuation or reversal is imminent.
- The reward‐to‐risk (based on that key level) meets my criteria for a disciplined entry.
***Please note that conducting a comprehensive analysis on a single timeframe chart can be quite challenging and sometimes confusing. I appreciate your understanding of the effort involved.
Important Note: The Role of Key Levels
- Holding a key level zone: If price respects the key level zone, momentum often carries the trend in the expected direction. That’s when we look to enter, with stop-loss placed just beyond the zone with some buffer.
- Breaking a key level zone: A definitive break signals a potential stop‐out for trend traders. For reversal traders, it’s a cue to consider switching direction—price often retests broken zones as new support or resistance.
My Trading Rules (Unchanged)
Risk Management
- Maximum risk per trade: 2.5%
- Leverage: 5x
Exit Strategy / Profit Taking
- Sell at least 70% on the 3rd wave up (LTF Wave 5).
- Typically sell 50% during a high‐volume spike.
- Move stop‐loss to breakeven once the trade achieves a 1.5:1 R:R.
- Exit at breakeven if momentum fades or divergence appears.
The market is highly dynamic and constantly changing. LMT signals and target profit (TP) levels are based on the current price and movement, but market conditions can shift instantly, so it is crucial to remain adaptable and follow the market's movement.
If you find this signal/analysis meaningful, kindly like and share it.
Thank you for your support~
Sharing this with love!
From HMT to LMT: A Brief Version History
HM Signal :
Date: 17/08/2023
- Early concept identifying high momentum pullbacks within strong uptrends
- Triggered after a prior wave up with rising volume and momentum
- Focused on healthy retracements into support for optimal reward-to-risk setups
HMT v1.0:
Date: 18/10/2024
- Initial release of the High Momentum Trading framework
- Combined multi-timeframe trend, volume, and momentum analysis.
- Focused on identifying strong trending moves high momentum
HMT v2.0:
Date: 17/12/2024
- Major update to the Momentum indicator
- Reduced false signals from inaccurate momentum detection
- New screener with improved accuracy and fewer signals
HMT v3.0:
Date: 23/12/2024
- Added liquidity factor to enhance trend continuation
- Improved potential for momentum-based plays
- Increased winning probability by reducing entries during peaks
HMT v3.1:
Date: 31/12/2024
- Enhanced entry confirmation for improved reward-to-risk ratios
HMT v4.0:
Date: 05/01/2025
- Incorporated buying and selling pressure in lower timeframes to enhance the probability of trending moves while optimizing entry timing and scaling
HMT v4.1:
Date: 06/01/2025
- Enhanced take-profit (TP) target by incorporating market structure analysis
HMT v5 :
Date: 23/01/2025
- Refined wave analysis for trending conditions
- Incorporated lower timeframe (LTF) momentum to strengthen trend reliability
- Re-aligned and re-balanced entry conditions for improved accuracy
HMT v6 :
Date : 15/02/2025
- Integrated strong accumulation activity into in-depth wave analysis
HMT v7 :
Date : 20/03/2025
- Refined wave analysis along with accumulation and market sentiment
HMT v8 :
Date : 16/04/2025
- Fully restructured strategy logic
HMT v8.1 :
Date : 18/04/2025
- Refined Take Profit (TP) logic to be more conservative for improved win consistency
LMT v1.0 :
Date : 06/06/2025
- Rebranded to emphasize key levels + momentum as the core framework
LMT v2.0
Date: 11/06/2025
- Fully restructured lower timeframe (LTF) momentum logic
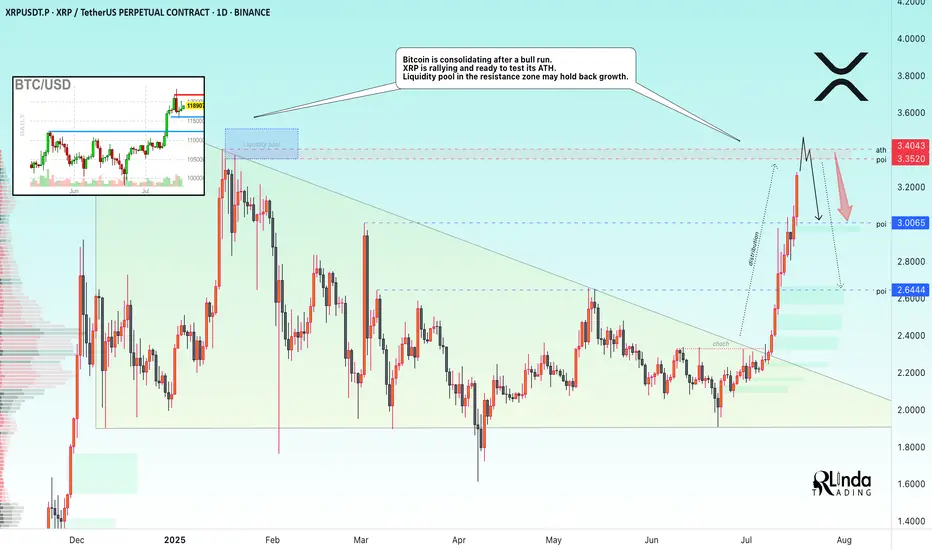
XRP → ATH retest. Reversal or continued growth?BINANCE:XRPUSDT.P is rallying and ready to test the resistance zone - ATH. Against this backdrop, Bitcoin is consolidating after a bull run. The liquidity pool may hold back growth.
Fundamentally, there is excitement across the entire cryptocurrency market. Altcoins are rallying after Bitcoin hit a new high and entered consolidation. The BTC.D index is declining, which generally provides a good opportunity for altcoins to grow. However, the index is approaching technical support, which may affect market sentiment overall...
As for XRP, there is a fairly strong liquidity pool ahead — the ATH resistance zone. The price is in a distribution phase after a change in character and a breakout of the downtrend resistance in the 2.33 zone. The momentum may exhaust its potential to break through the 3.35-3.34 zone, and growth may be halted for correction or reversal (in correlation with Bitcoin's dominance in the market).
Resistance levels: 3.35-3.40
Support levels: 3.0, 2.64
A breakout of resistance without the possibility of further growth, a return of the price below the level (i.e., inside the global flat) will confirm the fact of a false breakout of resistance, which may trigger a correction or even a reversal.
Best regards, R. Linda!
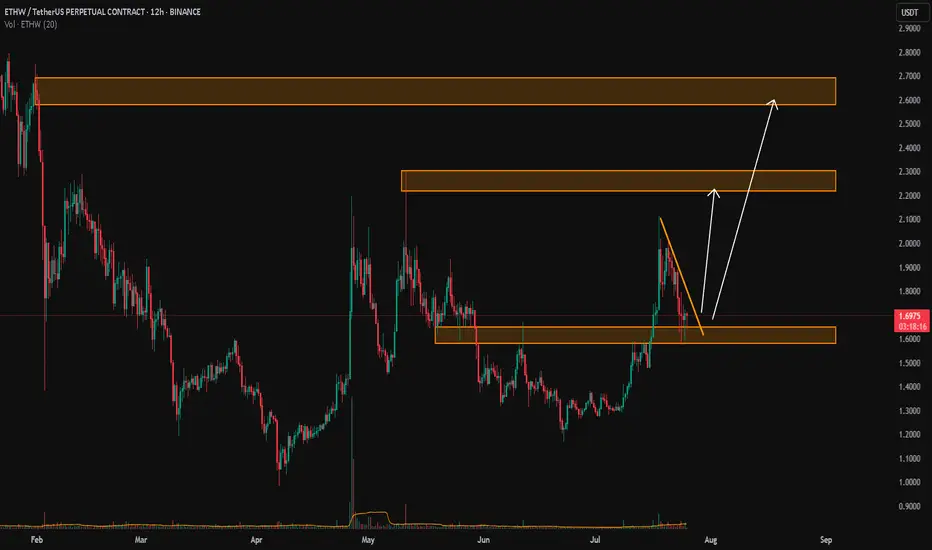
ETHW/USDTKey Level Zone: 1.5800 - 1.6500
LMT v2.0 detected.
The setup looks promising—price previously trended upward with rising volume and momentum, then retested this zone cleanly. This presents an excellent reward-to-risk opportunity if momentum continues to align.
Introducing LMT (Levels & Momentum Trading)
- Over the past 3 years, I’ve refined my approach to focus more sharply on the single most important element in any trade: the KEY LEVEL.
- While HMT (High Momentum Trading) served me well—combining trend, momentum, volume, and structure across multiple timeframes—I realized that consistently identifying and respecting these critical price zones is what truly separates good trades from great ones.
- That insight led to the evolution of HMT into LMT – Levels & Momentum Trading.
Why the Change? (From HMT to LMT)
Switching from High Momentum Trading (HMT) to Levels & Momentum Trading (LMT) improves precision, risk control, and confidence by:
- Clearer Entries & Stops: Defined key levels make it easier to plan entries, stop-losses, and position sizing—no more guesswork.
- Better Signal Quality: Momentum is now always checked against a support or resistance zone—if it aligns, it's a stronger setup.
- Improved Reward-to-Risk: All trades are anchored to key levels, making it easier to calculate and manage risk effectively.
- Stronger Confidence: With clear invalidation points beyond key levels, it's easier to trust the plan and stay disciplined—even in tough markets.
Whenever I share a signal, it’s because:
- A high‐probability key level has been identified on a higher timeframe.
- Lower‐timeframe momentum, market structure and volume suggest continuation or reversal is imminent.
- The reward‐to‐risk (based on that key level) meets my criteria for a disciplined entry.
***Please note that conducting a comprehensive analysis on a single timeframe chart can be quite challenging and sometimes confusing. I appreciate your understanding of the effort involved.
Important Note: The Role of Key Levels
- Holding a key level zone: If price respects the key level zone, momentum often carries the trend in the expected direction. That’s when we look to enter, with stop-loss placed just beyond the zone with some buffer.
- Breaking a key level zone: A definitive break signals a potential stop‐out for trend traders. For reversal traders, it’s a cue to consider switching direction—price often retests broken zones as new support or resistance.
My Trading Rules (Unchanged)
Risk Management
- Maximum risk per trade: 2.5%
- Leverage: 5x
Exit Strategy / Profit Taking
- Sell at least 70% on the 3rd wave up (LTF Wave 5).
- Typically sell 50% during a high‐volume spike.
- Move stop‐loss to breakeven once the trade achieves a 1.5:1 R:R.
- Exit at breakeven if momentum fades or divergence appears.
The market is highly dynamic and constantly changing. LMT signals and target profit (TP) levels are based on the current price and movement, but market conditions can shift instantly, so it is crucial to remain adaptable and follow the market's movement.
If you find this signal/analysis meaningful, kindly like and share it.
Thank you for your support~
Sharing this with love!
From HMT to LMT: A Brief Version History
HM Signal :
Date: 17/08/2023
- Early concept identifying high momentum pullbacks within strong uptrends
- Triggered after a prior wave up with rising volume and momentum
- Focused on healthy retracements into support for optimal reward-to-risk setups
HMT v1.0:
Date: 18/10/2024
- Initial release of the High Momentum Trading framework
- Combined multi-timeframe trend, volume, and momentum analysis.
- Focused on identifying strong trending moves high momentum
HMT v2.0:
Date: 17/12/2024
- Major update to the Momentum indicator
- Reduced false signals from inaccurate momentum detection
- New screener with improved accuracy and fewer signals
HMT v3.0:
Date: 23/12/2024
- Added liquidity factor to enhance trend continuation
- Improved potential for momentum-based plays
- Increased winning probability by reducing entries during peaks
HMT v3.1:
Date: 31/12/2024
- Enhanced entry confirmation for improved reward-to-risk ratios
HMT v4.0:
Date: 05/01/2025
- Incorporated buying and selling pressure in lower timeframes to enhance the probability of trending moves while optimizing entry timing and scaling
HMT v4.1:
Date: 06/01/2025
- Enhanced take-profit (TP) target by incorporating market structure analysis
HMT v5 :
Date: 23/01/2025
- Refined wave analysis for trending conditions
- Incorporated lower timeframe (LTF) momentum to strengthen trend reliability
- Re-aligned and re-balanced entry conditions for improved accuracy
HMT v6 :
Date : 15/02/2025
- Integrated strong accumulation activity into in-depth wave analysis
HMT v7 :
Date : 20/03/2025
- Refined wave analysis along with accumulation and market sentiment
HMT v8 :
Date : 16/04/2025
- Fully restructured strategy logic
HMT v8.1 :
Date : 18/04/2025
- Refined Take Profit (TP) logic to be more conservative for improved win consistency
LMT v1.0 :
Date : 06/06/2025
- Rebranded to emphasize key levels + momentum as the core framework
LMT v2.0
Date: 11/06/2025
- Fully restructured lower timeframe (LTF) momentum logic