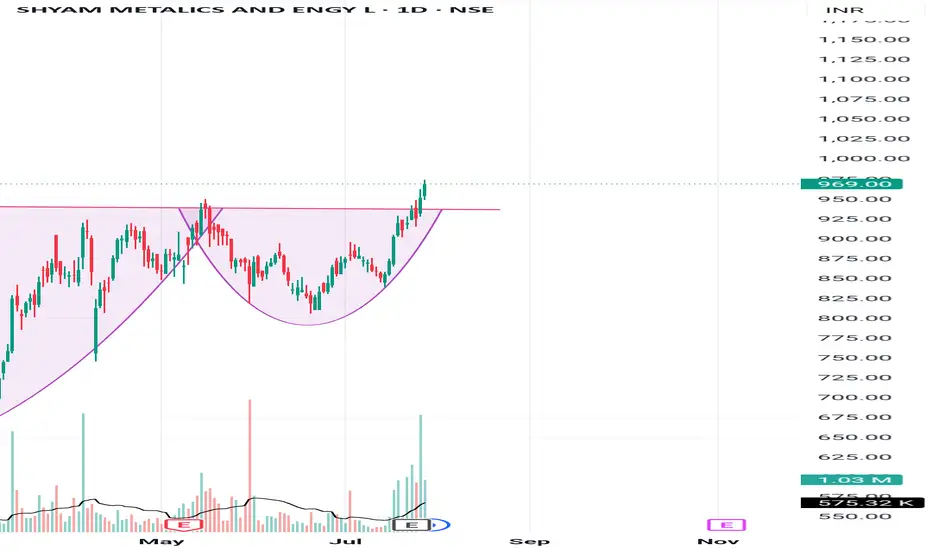
Cup and handle patternBreaks cup and handle pattern and going up. Looks bullish. Make sure to do your own analysis and maintain your risk management. This is only for educational purposes
Wave Analysis
GOLD could test 3375 before falling furtherGOLD could test 3375 before falling further
In our previous analysis, we were looking for gold to fall from the top and, as we can see, it has already reached 3341 from the 3430 area.
From the top down, the price depreciated by 2.85% in less than 3 days, so a possible correction is expected near the area of the structure coming from the left side around 3375.
Given that gold is only moving down, it may be possible for the downward movement to continue slowly. Both scenarios are possible at this point.
You may find more details in the chart!
Thank you and Good Luck!
PS: Please support with a like or comment if you find this analysis useful for your trading day

USDCHF sellUSD/CHF is currently in a downtrend, with the US Dollar exhibiting weakness throughout the year. From a technical standpoint, the pair appears poised for further decline, given the formation of a bearish flag. If considering this trade, it's essential to prioritize risk management or look for a potential retest of the flag's resistance level (or the apex of an ascending wedge, if applicable) before entering a short position.

Jasmyusdt Buy opportunityJASMYUSDT is displaying a strong cup and handle formation, presenting a good accumulation opportunity within the highlighted zone. The provided targets on the chart align with the coin’s potential, making it a worthwhile hold.
Previous analysis, which identified an Adam and Eve pattern, played out successfully.
The current strategy is to hold for at least 4 months, observing how the market develops.

Gold. Could this be the final "shape" of triangle? 26/July/25XAUUSD. back to previous ideas that we possible having a contracting /symmetrical triangle pattern on gold chart..Probarly a "big surprise" on 31 July FED/FOMC meeting?

NZD/USD – 1H | Bearish Setup at Breakout of LL| AB=CD HarmonicsWe’re currently eyeing a bearish continuation on NZD/USD based on clear market structure and harmonic confirmation.
📉 Trend: Bearish
🔍 Divergence: Bearish
📐 Harmonics: AB=CD pattern
📊 Bias: Bearish
🧠 Technical Breakdown
✅ Price has broken the previous Higher Low , confirming a structural shift.
✅ A Lower High is about to form — Now we’re waiting for the breakout of the previous Lower Low to confirm trend continuation.
✅ We’ve placed a Sell Stop below that Lower L ow, targeting bearish continuation.
✅ The AB=CD harmonic pattern shows potential for extended downside — reversal zone still far.
📌 Trade Setup
🔹 Entry: Sell Stop @ 0.59965 (breakout of Lower Low)
🔹 Stop Loss: 0.60614
🔹 Take Profit: 0.59316
🔹 Risk/Reward: 1:1
🔹 Lot Size: 0.38
🔹 Risk: $200
🔹 Reward: $200
⚠️ Note: This is a pending setup. Trade only triggers on the breakout of the previous Lower Low, keeping the bearish structure intact.
#NZDUSD #ForexSetup #BearishBreakout #LowerLow #PriceAction #SmartMoney #ABCDPattern
#HarmonicTrading #ForexStrategy #SellSetup #TradingView #FXMarket #ForexSignals
#DayTrading #SwingTrading #ChartAnalysis #TradeSmart #ForexTrader #RiskManagement
#ForexEducation #BearishStructure #FibonacciTrading #MarketStructure #BreakoutTrade
#TradersOfInstagram #TradersOfTradingView #CryptoAndForex

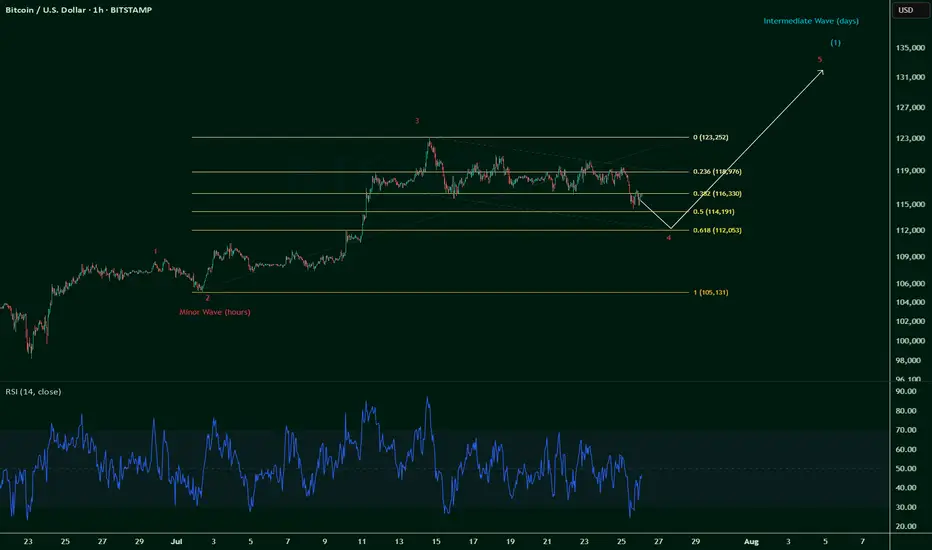
$BTC breaks $115k invalidates Wave 5 -- still Wave 4 correction.So it was a long squeeze after all, and one that was coming.
The initial thoughts were that we're on a Wave 5 up and counting:
But we're brought back down to earth as CRYPTOCAP:BTC breaks below $115k, invalidating a Wave 5 count.
So, it's official: we're still on a Wave 4 correction, which can go as low as 0.618 fib towards $112k.
Now painting a likely scenario given that Wave 2 correction only moved 0.236 fib ~ 0.328 fib (Wave 2 & Wave 4 often contrast):
This could play out till end July or even all the way into early August, which if comes to fruition, could signal for a bullish August.
And August has historically almost always been a bearish month (8 red historical months out of 12).
Pinch me.
SPX More upside potentialI've revised my previous count based on recent price action. I now see a potential minor Wave 4 (of Intermediate Wave 5) forming around the 6,500 level. This could present a reasonable opportunity to take some % profits, (for the cautious or short term traders) though I recommend being prepared to re-enter, as I still believe we are ultimately headed toward the 6,650–6,720 range before a larger-scale correction sets in.
Taking some profits around 6,500 may be a prudent move, or alternatively, you can continue holding while adjusting your trailing stops accordingly.
Generally and in most cases its best to exhaust you bullish counts in Elliot .
On the right hand side i am showing SPX/ DXY which is typically a more accurate and discernable wave pattern then the SPX alone. FYI


Looking goodAfter a clean breakout of the long lasting downtrend we suffered which ended on 3rd September 2024, we experienced explosive price action. This quickly got knocked off of it's feet due to it reaching 50.00% fib level, so a downtrend since then was expected given how extended we were.
Since the cool off, GEVO has found itself within a newly formed channel, along with testing the 100day SMA and 20day SMA and breaking past the RSI MA. With this, I'm expecting a move back up toward the resistance we'd rejected from prior, this being the yellow dashing lines. A minor retracement then a break above, along with a retest would be nice OR blowing straight past then a retest. This is what I'm looking for. With the retest, the next target will be the red line sitting at $13.17. Moving into an ABC retracement, then continuation later on.
(This is my first time trying EW)

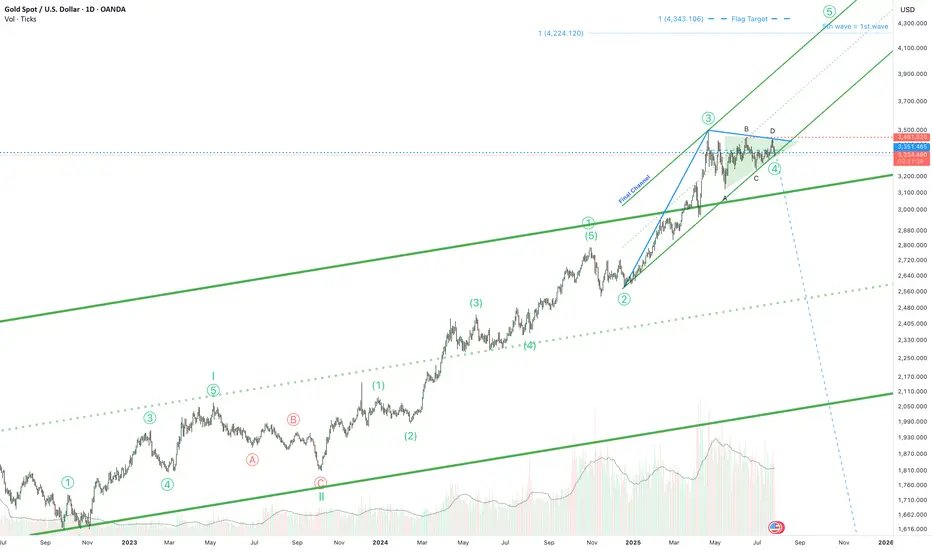
Gold is ready for the 5th wave!Hello! If you're following gold, here's some exciting news. The triangle correction phase that began in April is almost over. It's been a long journey, but we're almost there.
And guess what? The final phase is expected to reach around $4,300. But wait, there's more! The price is holding above the top of a long-term channel. This isn't just a random move; it could be a strong signal that the price could rise even higher than the $4,300 mark.
So, if you're following the gold market, keep your eyes peeled. Big moves could be just around the corner!
EUR/USD – The Cleanest Buy Setup EUR/USD – The Cleanest Buy Setup This Quarter (Wave E Targeting New Highs)
---
📄 TradingView explanation
📊 EUR/USD 4H Chart Analysis
The pair has beautifully respected the corrective channel from Wave C to D and is now preparing for the final leg — Wave E.
🟦 Key Highlights:
🔹 Price bouncing off demand zone
🔹 Tight consolidation near mid-channel = accumulation
🔹 Next targets: 1.1900 / 1.2050
🔹 Bullish continuation expected after liquidity sweep
🎯 The cleanest and most technically sound buy opportunity this quarter — align your longs with the trend before the breakout happens.
💬 Let them call it a bubble — we call it precision and patience. 🧠💸
#ElliottWave #EURUSD #ForexSetups #SmartMoneyMoves
?

Textbook Head & ShouldersThis looks like an epic wave 3 drop of a larger 5 wave crash, completing a textbook head and shoulders pattern. This is not a stock I'd be looking to be a bag carrier of, but it's peaked my interest as it has the potential of a 59% dead-cat-bounce to the upside. With these types of falling knives you must define your risk and cut your loss if support is lost.
Reasons it could find support - at $25 it has reached a support level from 2014, a whole 10 years ago. A confluence of the weekly level and 0.786 Fib. I must stress, I fully expect this to eventually fail and complete an epic Head & Shoulders pattern down to the Point of Control. We trade the same charts long and short.
Not financial advice, always do what's best for you.

EUR/USD – 1H Timeframe – Bearish Setup- Fibonacci levelsWe’re closely monitoring EUR/USD on the 1-hour chart.
🔻 Trend: Bearish
📉 Price action is clearly forming a series of Lower Highs (LH) and Lower Lows (LL) — a textbook downtrend.
🔎 Divergence: None observed, confirming trend strength.
📊 Current Action: Market is in a retracement phase.
We’ve used Fibonacci retracement, and price has now reached the 38.2% level, a key reversal zone. Based on this, we’ve entered a market sell position.
📌 Trade Setup:
🔹 Entry: Instant Sell @ 1.17302
🔹 Stop Loss: 1.17633
🔹 Take Profit 1: 1.17025
🔹 Take Profit 2: 1.16754
🔹 Risk/Reward: 1:1 and 1:2
🔹 Lot Size: 0.38
🔹 Risk: $200
🔹 Reward: $200 (TP1), $400 (TP2)
⚠️ Bias: Bearish
📍 This trade setup follows strict risk management principles and is based on solid technical confluence.
📈 Let’s see how the price reacts at the key Fib level. Always trade responsibly.
#EURUSD #ForexTrading #BearishSetup #FibonacciTrading #RiskManagement #PriceAction #TradingViewIdeas

NVDA 0DTE TRADE SIGNAL – JULY 25, 2025
⚡ NVDA 0DTE TRADE SIGNAL – JULY 25, 2025 ⚡
🚀 Strong Bullish Momentum – But Friday Expiration = Gamma Trap?
⸻
📊 Market Stats:
• 💰 Call Volume: Strong
• 🔻 Weak Volume Overall
• ⚖️ Call/Put Ratio: Bullish
• 📈 RSI: Overbought but still pushing
• ⏳ Time Decay: Accelerating
• ☠️ Gamma Risk: 🔥 MAX today (0DTE)
⸻
🧠 Model Summary:
• Grok/xAI: 🔒 NO TRADE today – wait for Monday
• Claude: 🛑 Caution – avoid entries today
• DeepSeek: ⏸️ 4/5 Bullish, wait for cleaner setup
• Gemini: 💡 Suggests $180C next week
• Llama: ✅ Bullish bias, but gamma risk = no go for Friday
⸻
📌 TRADE IDEA: Wait for Monday
📍 Strike: $175 Call
📆 Expiry: Today (0DTE)
💵 Entry Price: $0.56
🎯 Target: $0.95
🛑 Stop: $0.30
📈 Confidence: 65%
🕒 Entry Timing: Monday open IF support holds
⸻
⚠️ Key Warning:
Don’t get trapped by 0DTE gamma swings. Momentum says yes, time decay says no…
✅ Best move? Watch NVDA closely, then strike on Monday if volume confirms.
⸻
👍 Like & save if you’re tracking NVDA.
🔁 Repost if you’re waiting for the perfect Monday setup!
#NVDA #OptionsTrading #0DTE #GammaRisk #BullishSetup #TradingView #TechStocks #WeeklyOptions

USDCAD SELLUSD/CAD rallies to 1.3680 as the market focuses on a hawkish Fed
The US Dollar extends its recovery for the second consecutive day, supported by strong US data. Upbeat US business activity and Jobless Claims support the Fed's "wait and see" rhetoric. In Canada, the weak Retail Sales data keep hopes for a BoC rate cut alive.
The year will be politically marked by Trump’s return to the White House. A Republican government is seen as positive for financial markets, but Trump’s pledge to cut taxes and impose tariffs on foreign goods and services may introduce uncertainty to both the political and economic landscape.
Canada’s political crisis peaked in late 2024 with a no-confidence vote against Prime Minister Justin Trudeau, leading to snap elections and a weakened Liberal minority government. Policy uncertainty and economic challenges dominate 2025’s outlook, raising concerns over market stability and investor confidence.
The BoC is set to continue easing interest rates through 2025, at least at a faster pace than the Fed is expected to, which could apply pressure on CAD’s already-rising rate differential.
SUPPORT 1.36991
SUPPORT 1.36739
SUPPORT 1.36495
RESISTANCE 1.37346
RESISTANCE 1.37455

Will gold continue to fall on July 25?
1. Brief analysis of gold fundamentals
The current gold price is fluctuating downward, and the core driving factors are:
Risk aversion has cooled down:
The United States and Japan reached an agreement on automobile tariffs and promoted an agreement with the European Union, easing previous global trade tensions;
The overall risk appetite of the market has increased, and safe-haven funds have withdrawn from gold.
The US dollar rebounded in stages:
The US dollar index rebounded after the previous decline, which partially offset the safe-haven appeal of gold;
Although there are expectations of interest rate cuts within the Federal Reserve, there are large differences, and the overall trend is still "wait-and-see", which has increased the volatility of the US dollar trend.
2. Technical analysis of gold
Trend characteristics:
Gold has fallen from the high of 3438 and has been under pressure for two consecutive days;
It is currently testing the 0.618 retracement support (about 3360) of the 3310-3438 increase;
The European session continued to fall. If there is a rebound before the US session, there may be a risk of "false breakthrough and real decline";
If the US session still does not rise in the early session, it is necessary to pay attention to the possible V-shaped reversal in the future.
Technical indicators:
The short-term MACD bottom divergence gradually emerges, and the probability of oversold rebound correction increases;
Important support: 3350-3340 range (once lost, it may test the lower track of the 3337 daily triangle);
Key pressure: 3393-3403 range (initial rebound resistance), stronger resistance is around 3416-3418.
III. Short-term operation strategy suggestions
✅ Main idea: shorting on rebound is the main, and long on callback is the auxiliary
Short order layout reference:
If the 3393-3403 area encounters resistance, you can try to short with a light position;
Stop loss is set above 3410, and the target is 3360-3350;
If the market breaks through 3403 strongly and stabilizes, the short order strategy needs to be suspended.
Long position layout reference:
If it drops to 3350-3340 and stabilizes, you can try short-term long with a light position;
Stop loss is set below 3335, and the target is 3375-3385;
If the market quickly breaks below 3337, wait for the lower support to stabilize before intervening.
IV. Trend warning points
If the price does not rebound significantly before the early US market, it is necessary to guard against a sudden V-shaped pull after the US market;
If it directly falls below 3340, the space below opens, it is recommended to stop loss in time and wait for new support points.
✅ Conclusion:
In the short term, gold is still in the downward correction stage, but as the technical oversold signs appear, short-term sharp pull rebound should be guarded against. It is recommended to respond flexibly in operation, pay attention to the response of key support and resistance levels, and avoid chasing up and selling down.
EUR-CAD Risky Short! Sell!
Hello,Traders!
EUR-CAD is trading in a
Strong uptrend so we are
Bullish biased long-term
However a strong horizontal
Resistance is ahead at 1.6110
And the pair is overbought
So after the retest of the
Resistance we will be
Expecting a bearish correction
Sell!
Comment and subscribe to help us grow!
Check out other forecasts below too!
Disclosure: I am part of Trade Nation's Influencer program and receive a monthly fee for using their TradingView charts in my analysis.

Short-term BITCOIN analysisShor-term
In my opinion, Bitcoin could make a move towards $113,000-115,000 and then start moving upwards. In any case, according to previous analysis and apart from short-term fluctuations, it could touch the target of $140,000-150,000.
Good luck
NEoWave Chart

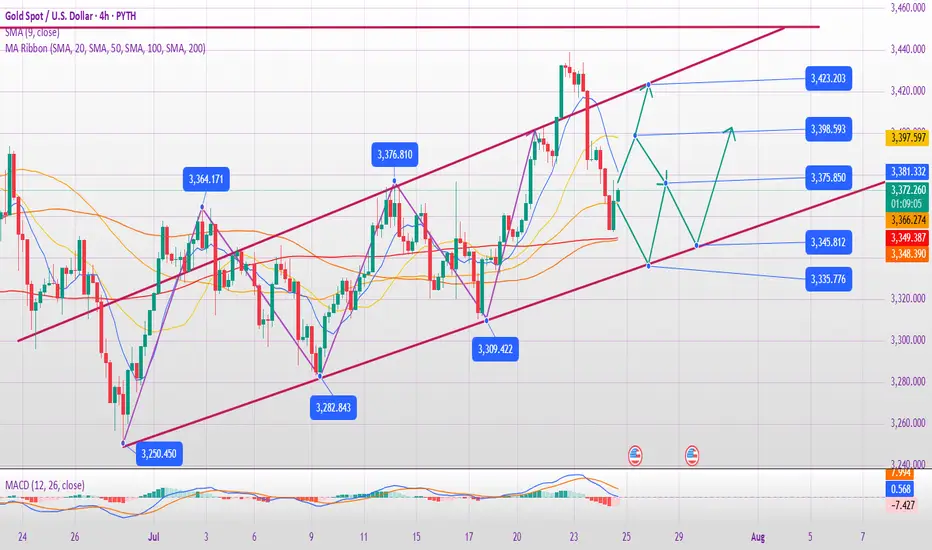
XAUUSD: Market Analysis and Strategy for July 25Gold technical analysis:
Daily chart resistance 3400, support 3300
4-hour chart resistance 3375, support 3342
1-hour chart resistance 3350, support 3333.
Gold, starting from 3438 this Wednesday, has fallen by nearly $100. It rebounded quickly after falling to 3351 yesterday. After sideways fluctuations in the Asian session, the current price is around 3343, and the key support below is around 3333. From a spatial point of view, this wave of adjustment is nearing its end. After waiting for the adjustment to be completed, the market will most likely return to an upward trend.
The short-term top and bottom resistance at the 1-hour level is around 3351. For intraday short-term operations, the current gold price is around 3343. Pay attention to the bearish trend near 3351. If it does not break near 3333, it will be bullish again!
SELL: 3350near
BUY: 3333near

GBP-USD Support Ahead! Buy!
Hello,Traders!
GBP-USD went down but
The pair will soon hit a
Horizontal support level
Of 1.3400 from where we
Will be expecting a local
Rebound and a move up
Buy!
Comment and subscribe to help us grow!
Check out other forecasts below too!
Disclosure: I am part of Trade Nation's Influencer program and receive a monthly fee for using their TradingView charts in my analysis.

BTC- New ATH?BTCUSDT – Potential Reversal from CME Gap Support
Bitcoin is currently trading around a key demand zone aligned with a CME gap between ~$115,272 and $114,000. Price recently swept local lows with increased volatility and is showing signs of absorption just above the 0.382 Fibonacci retracement ($113,660), which adds confluence to the area.
If BTC continues to hold above this zone and shows volume confirmation, I expect a strong bullish reaction. This move could initiate a rally toward the previous high and potentially lead to a breakout to new all-time highs (ATH), as outlined in the red projected path.
Key levels- LQ, Fibbo 0.382, CME gap - futures

XAUUSD update 25 July 2025 Accumulation still thereThis week, we could see that price corrected and find it support.
Interesting support is around 3312-3321 zone
It still have a big opportunity to bounce and break 3450 resistance level.
Have a blessing day !
