HBAR wave 1 out of 5 is doneCurrently HBAR and crypto in general is having a correction to .5-.618 (Wave 2 out of 5) - This will push HBAR to .18-.19 range in the upcoming days
Wave Analysis

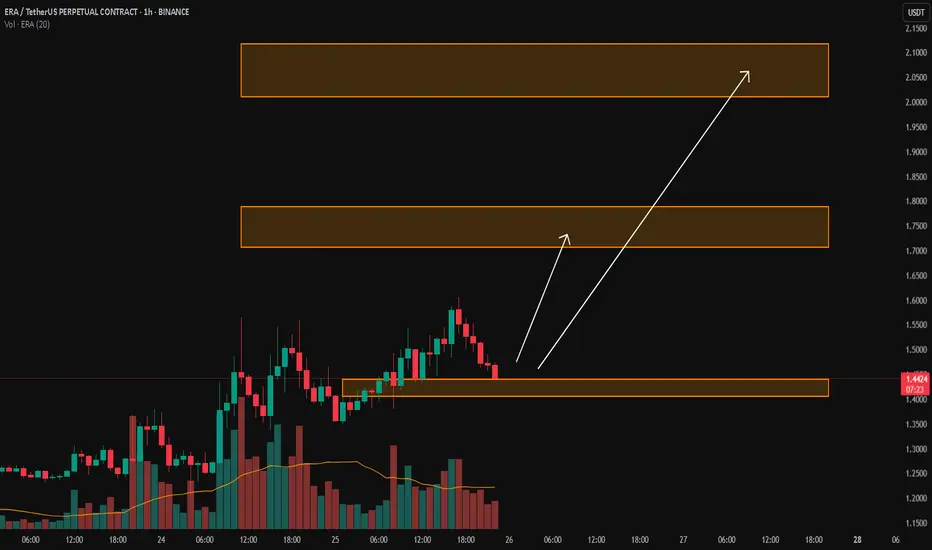
ERA/USDTKey Level Zone: 1.4050 - 1.4400
LMT v2.0 detected.
The setup looks promising—price previously trended upward with rising volume and momentum, then retested this zone cleanly. This presents an excellent reward-to-risk opportunity if momentum continues to align.
Introducing LMT (Levels & Momentum Trading)
- Over the past 3 years, I’ve refined my approach to focus more sharply on the single most important element in any trade: the KEY LEVEL.
- While HMT (High Momentum Trading) served me well—combining trend, momentum, volume, and structure across multiple timeframes—I realized that consistently identifying and respecting these critical price zones is what truly separates good trades from great ones.
- That insight led to the evolution of HMT into LMT – Levels & Momentum Trading.
Why the Change? (From HMT to LMT)
Switching from High Momentum Trading (HMT) to Levels & Momentum Trading (LMT) improves precision, risk control, and confidence by:
- Clearer Entries & Stops: Defined key levels make it easier to plan entries, stop-losses, and position sizing—no more guesswork.
- Better Signal Quality: Momentum is now always checked against a support or resistance zone—if it aligns, it's a stronger setup.
- Improved Reward-to-Risk: All trades are anchored to key levels, making it easier to calculate and manage risk effectively.
- Stronger Confidence: With clear invalidation points beyond key levels, it's easier to trust the plan and stay disciplined—even in tough markets.
Whenever I share a signal, it’s because:
- A high‐probability key level has been identified on a higher timeframe.
- Lower‐timeframe momentum, market structure and volume suggest continuation or reversal is imminent.
- The reward‐to‐risk (based on that key level) meets my criteria for a disciplined entry.
***Please note that conducting a comprehensive analysis on a single timeframe chart can be quite challenging and sometimes confusing. I appreciate your understanding of the effort involved.
Important Note: The Role of Key Levels
- Holding a key level zone: If price respects the key level zone, momentum often carries the trend in the expected direction. That’s when we look to enter, with stop-loss placed just beyond the zone with some buffer.
- Breaking a key level zone: A definitive break signals a potential stop‐out for trend traders. For reversal traders, it’s a cue to consider switching direction—price often retests broken zones as new support or resistance.
My Trading Rules (Unchanged)
Risk Management
- Maximum risk per trade: 2.5%
- Leverage: 5x
Exit Strategy / Profit Taking
- Sell at least 70% on the 3rd wave up (LTF Wave 5).
- Typically sell 50% during a high‐volume spike.
- Move stop‐loss to breakeven once the trade achieves a 1.5:1 R:R.
- Exit at breakeven if momentum fades or divergence appears.
The market is highly dynamic and constantly changing. LMT signals and target profit (TP) levels are based on the current price and movement, but market conditions can shift instantly, so it is crucial to remain adaptable and follow the market's movement.
If you find this signal/analysis meaningful, kindly like and share it.
Thank you for your support~
Sharing this with love!
From HMT to LMT: A Brief Version History
HM Signal :
Date: 17/08/2023
- Early concept identifying high momentum pullbacks within strong uptrends
- Triggered after a prior wave up with rising volume and momentum
- Focused on healthy retracements into support for optimal reward-to-risk setups
HMT v1.0:
Date: 18/10/2024
- Initial release of the High Momentum Trading framework
- Combined multi-timeframe trend, volume, and momentum analysis.
- Focused on identifying strong trending moves high momentum
HMT v2.0:
Date: 17/12/2024
- Major update to the Momentum indicator
- Reduced false signals from inaccurate momentum detection
- New screener with improved accuracy and fewer signals
HMT v3.0:
Date: 23/12/2024
- Added liquidity factor to enhance trend continuation
- Improved potential for momentum-based plays
- Increased winning probability by reducing entries during peaks
HMT v3.1:
Date: 31/12/2024
- Enhanced entry confirmation for improved reward-to-risk ratios
HMT v4.0:
Date: 05/01/2025
- Incorporated buying and selling pressure in lower timeframes to enhance the probability of trending moves while optimizing entry timing and scaling
HMT v4.1:
Date: 06/01/2025
- Enhanced take-profit (TP) target by incorporating market structure analysis
HMT v5 :
Date: 23/01/2025
- Refined wave analysis for trending conditions
- Incorporated lower timeframe (LTF) momentum to strengthen trend reliability
- Re-aligned and re-balanced entry conditions for improved accuracy
HMT v6 :
Date : 15/02/2025
- Integrated strong accumulation activity into in-depth wave analysis
HMT v7 :
Date : 20/03/2025
- Refined wave analysis along with accumulation and market sentiment
HMT v8 :
Date : 16/04/2025
- Fully restructured strategy logic
HMT v8.1 :
Date : 18/04/2025
- Refined Take Profit (TP) logic to be more conservative for improved win consistency
LMT v1.0 :
Date : 06/06/2025
- Rebranded to emphasize key levels + momentum as the core framework
LMT v2.0
Date: 11/06/2025
- Fully restructured lower timeframe (LTF) momentum logic
99% of people buying $NVDA don't understand this:🚨99% of people buying NASDAQ:NVDA don't understand this:
NASDAQ:GOOGL : “We’re boosting AI capex by $10B.”
Wall Street: “Cool, that’s like $1B or 0.06 per share for $NVDA.”
So from $170.50 at the time of news to $170.56 right?
No.
NASDAQ:NVDA trades at 98× earnings. So that $0.06? Turns into $6.00
Why?
Because people are expecting that to be happening every single year for 98 years and they're paying All of it Today in Full amount.
So NASDAQ:NVDA will get $1B more per year. But NASDAQ:NVDA price per share already increased by $100B in past 2 days 😂
Then it crashes 40% and everyone is wondering why.

REI/USDT-God Candle REI has consistently defended the $0.015 zone for the past 40 days, signaling early signs of a potential reversal point in alignment with the broader market cycle. This base-building behavior suggests strong underlying demand, making it a high-potential setup. A breakout with a "god candle" could be the first major sign of trend reversal. The green box marks a prime entry zone, offering an excellent risk-reward opportunity for early positioning ahead of the next bullish leg.

GALA price analysis🪙 Please tell us, is the #GALA project still "alive"?
It's old, has gone through many cycles on the crypto market, and hasn't died yet.
Maybe now (being related to the CRYPTOCAP:ETH Ecosystem) is the best time to “come back to life”?
For this to happen, the price of OKX:GALAUSDT must finally:
1️⃣ confidently hold above $0.01390-0.01460
2️⃣ continue to grow confidently to $0.044
3️⃣ And finally, rapidly grow to $0.10-0.11 by the end of the year.
Is this a realistic scenario? Write your thoughts in the comments.

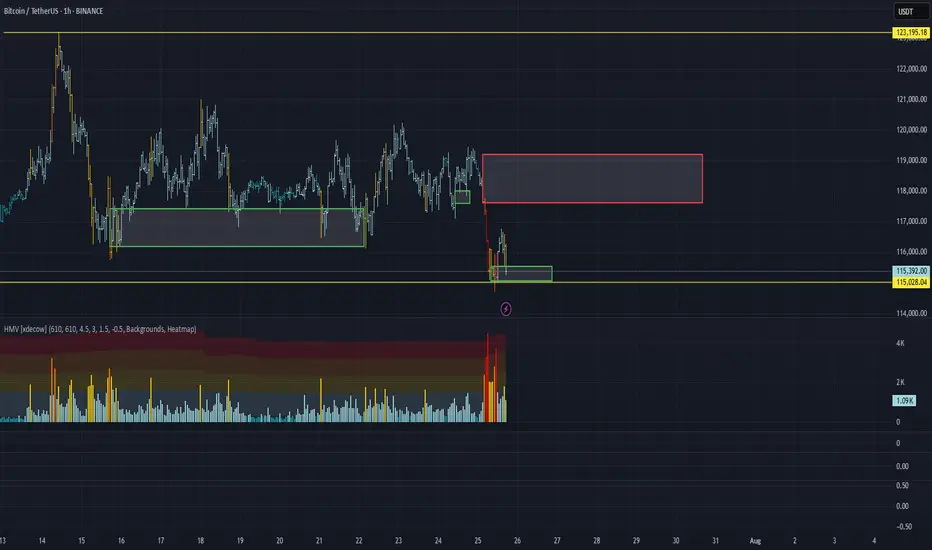
BTC/USDT Analysis. Range Breakout
Hello everyone! This is the daily analysis from a trader-analyst at CryptoRobotics.
Yesterday, Bitcoin bounced off a local sell zone on the 15-minute timeframe (previously mentioned), but a full-fledged bullish move did not follow. Instead, the less likely scenario played out — we broke the range to the downside and tested an important buy zone around ~$115,000 (zone of initiating volumes). Almost immediately, anomalies appeared in the cluster search near this level, and we quickly saw an initial rebound.
At the moment, a retest of ~$115,300 is likely. If buyers show proper reaction there, we could resume an upward move toward the $117,600–$119,200 area (accumulated volumes). To continue the long scenario toward the ATH, we need to consolidate within this area or break through it without a strong seller response — which is less likely.
A short scenario becomes possible if there is no buyer reaction around ~$115,300. In that case, a decline toward the next major support zone is expected.
Buy Zone:
$110,000–$107,000 (accumulated volumes)
Sell Zone:
$117,600–$119,200 (accumulated volumes)
This publication is not financial advice.
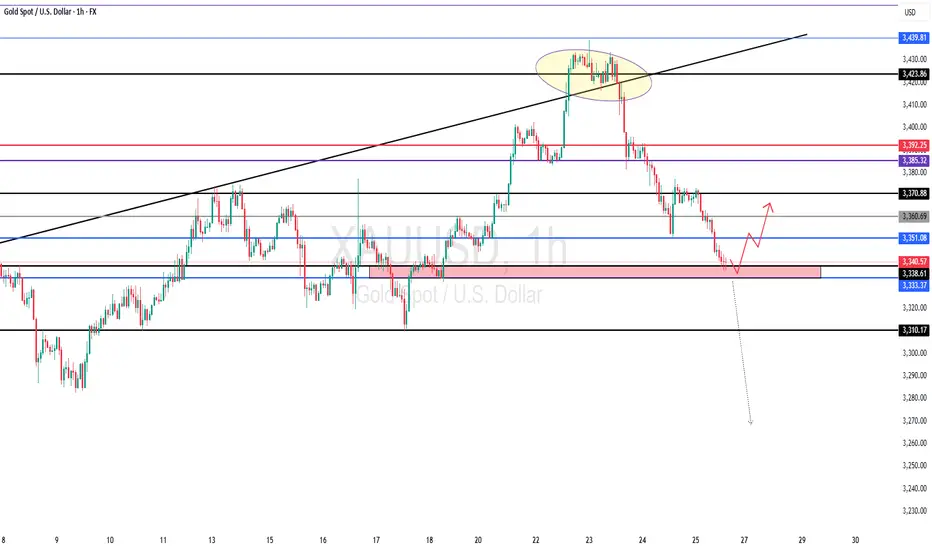
Gold is holding strong at support!GOLD – Bullish Bounce Coming? CAPITALCOM:GOLD
Gold is moving inside an upward channel.
A bounce is likely from $3,335 – eyes on $3,425 📈
Don’t miss the move. Let the market pay you! 💰
📈 If the bounce happens, price may rise toward:
Target 1: $3,375
Target 2: $3,425+
✅ Price just touched the bottom of the channel around $3,335 – a strong support area.
✅ RSI is oversold ➜ This usually means a bounce is coming.
✅ Momentum indicators are showing signs of bullish reversal.

GOLD - SHORT TO $2,880 (UPDATE)Gold sellers have now pushed down to where price opened on Monday, turning the weekly candle bearish. A huge move down, compared to where price was at on Tuesday high!
R.I.P to those who bought the top. But this is what happens when you trade without a strategy or guidance⚰️


COIN 0DTE Trade Breakdown – July 25, 2025
📉 COIN 0DTE Trade Breakdown – July 25, 2025
Put Play or Pass? Let’s break it down 👇
📍 Price: $392.34
🧠 Sentiment: Neutral → Bearish
📊 Call/Put Ratio: 1.08 (Balanced flow)
⚠️ Gamma Risk: HIGH
⌛ Time Decay: Accelerating (0DTE!)
⸻
🎯 TRADE IDEA: 0DTE PUT
✅ Strike: $380.00
💵 Entry Price: $0.69
🎯 Profit Target: $1.00
🛑 Stop Loss: $0.37
📆 Expiration: Today (Jul 25)
📈 Confidence: 65%
📍 Entry Timing: At Open
⸻
⚠️ Why This Trade?
🔻 RSI trending down
🚫 Weak institutional volume
⚠️ High volatility expected from gamma squeeze
🕒 Tick. Tock. Time decay’s your biggest enemy here.
📌 Strategy:
➡️ Naked PUT (speculative short-term play)
⛳ Goal? Quick move → quick exit
⸻
🚨 Risk Warning:
❗ 0DTE = Massive swings
❗ One wrong move = rapid premium decay
❗ Stay nimble. Know your exit.
⸻
💬 Drop a 🔥 if you’re watching COIN today
#OptionsTrading #0DTE #COIN #DayTrading #PutOption #TradingView #StockTok #GammaRisk #TradeSetup

Chart Analysis on the SilverYou can follow us for more Analysis(Images and Videos) with Precise definition of the Financial Market.ENJOY!!!

GOLD keep Pending Buy Order Gold is nearing its one of the strong support area and price may pull back from here again. You can fill the pending Buy order between 3330-3345.

HEI/USDT - Higher !!showing strong bullish price action, consistently printing higher highs and higher lows with aggressive buyer pressure. The structure indicates sustained momentum, and the current consolidation above recent support suggests strength.
marked the green box as a buy zone starting from the current market price, as this area aligns with previous S/R flip zone turned support. This provides a favorable entry for continuation toward the next key resistance levels.
SL : 0.32

SAHARA/USDT - 2nd buy setup has already delivered a strong +100% move from the initial buy setup. Currently, the price is retesting the previous resistance level, which is now flipping into a strong base support — a classic bullish retest. This zone also acted as the breakout point for the recent parabolic leg, indicating strong interest from buyers. A green box has been marked for the next potential entry, anticipating the continuation of the bullish trend. If the support holds, the next leg could lead to another explosive move upward.

GOLD - at Cut n Reverse Region, whats next ??#GOLD - market just reached at his ultimate area and keep in mind that if market break his current region than it will go further and nose dive..
NOTE: cut n reverse below our mentioned region..
Analysis on the 10 Elite PairsYou can follow us for more Analysis(Images and Videos) with Precise definition of the Financial Market.ENJOY!!!

Gold testing SIGNIFICANT DAILY TRENDLINEGold is testing a key ascending trendline support around 3,340. If price holds this level, we could see a strong bullish reaction targeting 3,367 and potentially 3,400+. A break below 3,328 invalidates this setup.”

ETHUSD: Road to 4K today after a breakout. ETH/USD – 4H Outlook: Targeting $4,000+
Ethereum is coiling within a descending wedge, signaling potential breakout momentum. Volume compression indicates that once ETH breaks above the wedge resistance (~$3,750), it could accelerate toward the $4,000–$4,050 supply zone.
Key Levels:
Resistance: $3,750 → $4,000
Support: $3,650 → $3,550
Breakout Target: $4,007 (mid-term)
VolanX Protocol Insight:
Institutional liquidity clusters sit above $3,800. A clean breakout with strong volume could trigger stop runs and a swift rally to 4K.
Risk Management:
Entry after breakout retest above $3,750.
Stop-loss: Below $3,640.
Take-profit: $3,980–$4,050.

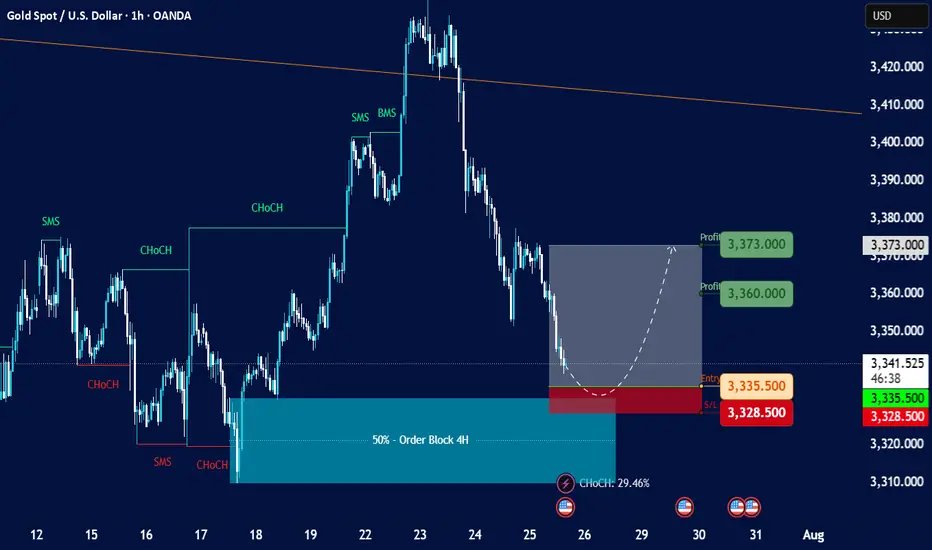
Gold Spot / U.S. Dollar (XAU/USD) with a 1-hour timeframeOverall Trend and Market Structure:
The chart displays a mix of bullish and bearish movements, but recent price action (from around July 23rd onwards) shows a significant downturn after a peak.
There are "SMS" (Structural Market Shift) and "ChoCH" (Change of Character) labels, indicating shifts in market structure. Initially, there were bullish shifts, but the recent price action suggests a potential bearish shift or at least a significant retracement.
A large "50% - Order Block 4H" is highlighted in blue, which acted as support and led to a strong upward move previously.
Current Price Action and Setup:
The current price is around 3,340.670.
There's a proposed short-term trading setup, indicated by:
Entry: 3,335.500 (red dashed line)
Stop Loss (SL): 3,328.500 (red shaded area)
Profit Targets (TP):
3,360.000 (green shaded area, "Profit 3,360.000")
3,373.000 (green shaded area, "Profit 3,373.000")
The setup is highlighted with a gray shaded area, indicating the potential path of price for this trade. It appears to be a long (buy) setup, anticipating a bounce from the current levels.
The "CHOCM: 29.46%" at the bottom suggests some kind of indicator or calculation related to market character.
Key Observations and Considerations:
Previous Bullish Momentum: The price rallied strongly after touching the "50% - Order Block 4H" around July 17-18, reaching a high near 3,430.
Recent Bearish Retracement: Since July 23rd, the price has pulled back significantly from its peak, almost revisiting the higher levels of the previous order block.
Potential Support: The proposed entry point for the long trade (3,335.500) is within a zone that previously acted as support or a level from which price bounced. It's also near the top of the "50% - Order Block 4H" area, suggesting this could be a retest or a bounce from a key support zone.
Risk-Reward: The setup shows a relatively tight stop loss compared to the potential profit targets, which is generally favorable for risk management.
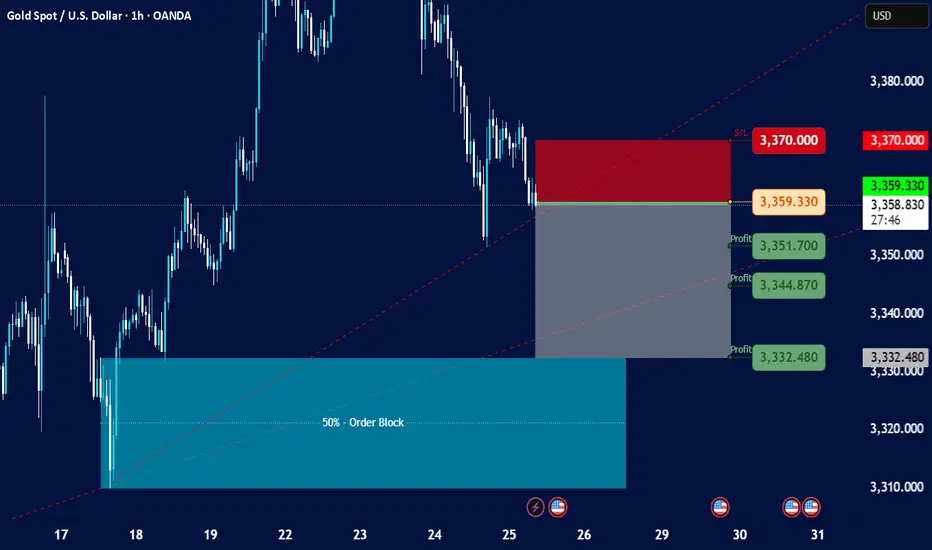
Gold Spot / U.S. Dollar - 1h on TradingView, dated July 25, 202Current Price and Trend:
The current price is shown as 3,359.330, and the last traded price is 3,359.005.
The chart indicates a downtrend in recent sessions, with the price having fallen significantly from higher levels around 3,380.000 to 3,390.000 down to the current levels.
There's a dashed red line (possibly a trendline or resistance) indicating a downward slope.
Key Zones and Levels Identified:
Resistance/Stop Loss Zone (Red Rectangle):
This zone is marked from approximately 3,365.000 up to 3,370.000.
A "S/L" (Stop Loss) level is explicitly marked at 3,370.000. This suggests that a short position (selling) is being considered, with a stop loss placed above this resistance.
Entry Point (Grey Line):
An entry point for a trade is indicated by a grey horizontal line at 3,359.330. This is very close to the current price, suggesting a potential entry for a short trade.
Profit Target Zones (Grey Rectangle with Green Labels):
Three "Profit" levels are identified below the entry point:
3,351.700
3,344.870
3,332.480
These levels suggest potential targets for taking profit on a short position. The grey shaded rectangle represents the area where these profit targets lie, extending downwards from the entry point.
50% - Order Block (Teal Rectangle):
At the bottom left of the chart, there's a large teal-colored rectangle labeled "50% - Order Block."
This typically represents an area where significant institutional buying interest (or an accumulation of orders) is expected, potentially acting as strong support. The price has previously bounced off this area.
Possible Trading Strategy Implied:
The setup suggests a potential short-selling strategy for Gold Spot / USD, likely based on a continuation of the downtrend or a retest of previous resistance levels.
Entry: Around 3,359.330 (current price level).
Stop Loss: At or above 3,370.000, to limit potential losses if the price moves against the short position.
Take Profit: Phased profit-taking at 3,351.700, 3,344.870, and 3,332.480.
Target Support: The ultimate target appears to be within the "50% - Order Block" zone, suggesting the expectation of the price reaching or testing this strong support area.
Considerations and Further Analysis Needed:
Confirmation: The chart doesn't show any specific indicators (e.g., RSI, MACD) that might confirm the downtrend or potential entry.
Volume: Volume analysis would be beneficial to assess the strength of price movements.
News/Fundamentals: Any upcoming economic data or geopolitical events could significantly impact gold prices.
Risk-Reward Ratio: A calculation of the risk-reward for each profit target would be useful to determine the attractiveness of the trade.
Market Structure: A deeper analysis of the market structure (higher highs/lows, lower highs/lows) could provide more context.
NZDUSD - EURUSDHi TRADERS, while we are looking to trade NZDUSD mkt wave to the upside on the 4h chart let's not think that "it may" be the same as to EURUSD, because the DOUBLE TOP PATTERN that was formed from January 4th through May 21st 2021 and then breaks to the downside have just came to retest supply zone aera on JUNE 30th 2025, and sell off a little. And this week JULY 21st 2025, buyers push price to that same W/D supply zone that also can be called SOPPRT RESISTANCE PIVOT POINT AERAS after a long period of FOUR YEARS, for the first time . My humble opinion

#VET/USDT – Falling Wedge Breakout?#VET
The price is moving within a descending channel on the 1-hour frame and is expected to break and continue upward.
We have a trend to stabilize above the 100 moving average once again.
We have a downtrend on the RSI indicator that supports the upward break.
We have a support area at the lower boundary of the channel at 0.02310, acting as strong support from which the price can rebound.
We have a major support area in green that pushed the price upward at 0.02360.
Entry price: 0.02545
First target: 0.02613
Second target: 0.02739
Third target: 0.02889
To manage risk, don't forget stop loss and capital management.
When you reach the first target, save some profits and then change the stop order to an entry order.
For inquiries, please comment.
Thank you.

NEWT/USDT -Wave 3 NEWT/USDT is displaying a super bullish structure with a textbook wave formation. After completing its first impulsive leg (Wave 1) the price entered a healthy correction phase lasting over 25 days retracing approximately 50% a classic Wave 2 retracement.
The recent strong up move marks the beginning of Sub-Wave 1 of the larger Wave 3, which is often the most explosive part of the cycle. Currently, price is stabilizing and holding key levels that NEWT is preparing to complete the full Wave 3 expansion with strong bullish momentum ahead.
