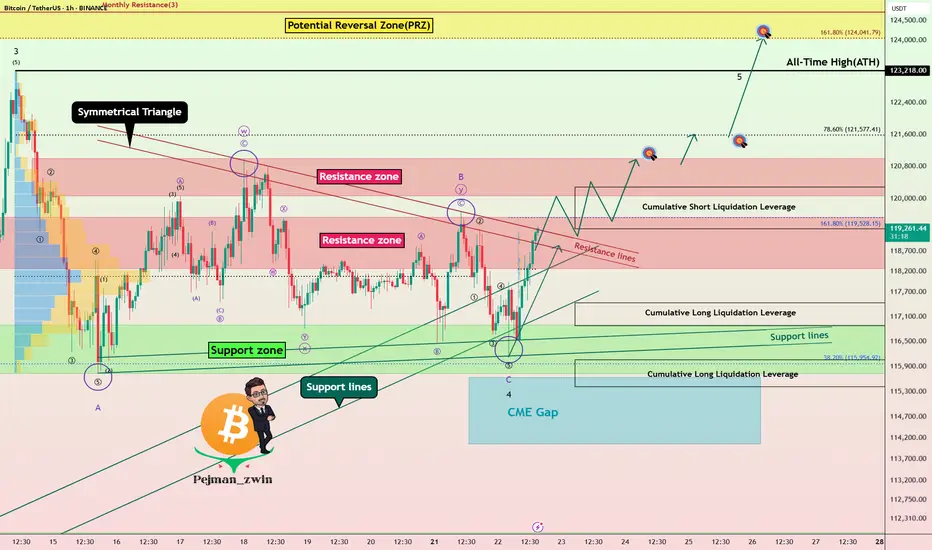
Powell’s Comments Could Decide BTC’s Fate: New ATH or Rejection!Bitcoin ( BINANCE:BTCUSDT ) has attacked the Support zone($116,900-$115,730) several times over the past week but failed to break through, meaning that buyers are still hoping for a BTC increase or even a new All-Time High(ATH) .
Bitcoin has reached a Resistance zone($119,530-$118,270) again and is trying to break the upper lines of the Symmetrical Triangle Pattern . The Cumulative Short Liquidation Leverage($117,255-$116,675) is important and includes high sell orders , so if Bitcoin can break the Resistance zone($119,530-$118,270) and the Resistance lines with high momentum , we can hope for a continuation of the upward trend.
Whether or not the Resistance zone($119,530-$118,270) and the Resistance lines break could depend on the tone of Jerome Powell’s speech today .
Jerome Powell will speak at the opening of the “ Integrated Review of the Capital Framework for Large Banks ” — the final major appearance before the Federal Reserve enters its pre-meeting blackout period.
Market Expectations:
The speech is officially about regulatory frameworks (like Basel III), but traders are watching closely for any hints regarding interest rate policy. Even indirect comments could move risk assets like BTC.
Rate Cut Signals?
With political pressure mounting (including criticism from Trump ) and markets pricing in a potential cut later this year, Powell may adopt a cautious, data-dependent tone emphasizing flexibility in decision-making.
--------------------
In terms of Elliott Wave theory , it seems that the wave structure of the main wave 4 correction is over. The main wave 4 has a Zigzag Correction(ABC/5-3-5) , so that the microwave B of the main wave 4 has a Double Three Correction(WXY) . Of course, the breakdown of the Resistance zone($119,530-$118,270) and Resistance lines can confirm the end of the main wave 4 .
Also, there is a possibility that the 5th wave will be a truncated wave because the momentum of the main wave 3 is high , and Bitcoin may NOT create a new ATH and the main wave 5 will complete below the main wave 3.
I expect Bitcoin to rise to at least the Resistance zone($121,000-$120,070) AFTER breaking the Resistance zone($119,530-$118,270) and Resistance lines .
Second Target: $121,620
Third Target: $123,820
Note: Stop Loss(SL)= $117,450
CME Gap: $115,060-$114,947
Cumulative Long Liquidation Leverage: $117,429-$116,878
Cumulative Long Liquidation Leverage: $116,053-$115,411
Please respect each other's ideas and express them politely if you agree or disagree.
Bitcoin Analyze (BTCUSDT), 1-hour time frame.
Be sure to follow the updated ideas.
Do not forget to put a Stop loss for your positions (For every position you want to open).
Please follow your strategy and updates; this is just my Idea, and I will gladly see your ideas in this post.
Please do not forget the ✅' like '✅ button 🙏😊 & Share it with your friends; thanks, and Trade safe.
Wave Analysis
$PARTI - PARTIUSDT #Bybit #LongAfter breaking out from the long-term downward TL it has retraced, signalling a possible loss of momentum. Traders have locked in profits waiting for the price to settle and pivot around an area of confluence. Alt coins are generally benefitting from the BTC and overall market leading coin correction. Volatility will remain until the market decides which direction it wants to take.

DUSK/USDTOn June 12, 2025, DUSK/USDT broke down below the key $0.06 support in a final liquidity grab, shaking out weak hands. Since then, the price has been in clear accumulation, forming a solid base below the $0.06 zone. On July 8, 2025, strong buyers aggressively stepped in, reclaiming the $0.06 level marking the first stage of a potential trend reversal.
Currently, price is holding firmly above this reclaimed zone, showing strength and readiness for a parabolic move as bullish momentum builds up.

GBPCAD: Growth & Bullish Continuation
The price of GBPCAD will most likely increase soon enough, due to the demand beginning to exceed supply which we can see by looking at the chart of the pair.
Disclosure: I am part of Trade Nation's Influencer program and receive a monthly fee for using their TradingView charts in my analysis.
❤️ Please, support our work with like & comment! ❤️

EURUSD: Long Signal with Entry/SL/TP
EURUSD
- Classic bullish pattern
- Our team expects retracement
SUGGESTED TRADE:
Swing Trade
Buy EURUSD
Entry - 1.1724
Stop - 1.1714
Take - 1.1743
Our Risk - 1%
Start protection of your profits from lower levels
Disclosure: I am part of Trade Nation's Influencer program and receive a monthly fee for using their TradingView charts in my analysis.
❤️ Please, support our work with like & comment! ❤️

Cardano (ADA) Just Flipped Bullish — Next Stop: $0.9373?ADAUSDT is currently displaying a strong bullish structure on the 4-hour chart, bouncing from a critical support zone near $0.7774–$0.7315. After a healthy retracement, the pair appears to be regaining momentum, forming a potential higher low, which aligns with the continuation of the broader uptrend that started earlier this month.
Recent price action confirms that buyers are stepping in at key zones previously marked by blue “B” labels, and sell-side pressure seems to be weakening after the last swing top around $0.9373. The support zones, marked with dotted green lines, have held well, and the current structure suggests a rebound toward the previous high.
The most recent small leg up shows the formation of a bullish engulfing setup near $0.78, which could serve as a launch point toward the higher resistance. The candlesticks are also showing longer lower wicks — a sign that buyers are defending lower levels aggressively. With price currently floating near $0.81, there’s a good upside window available.
Here’s the trading setup based on the chart:
• Entry: Around $0.8106 (current price zone)
• Take Profit (TP): $0.9373 (previous swing high — +18.23%)
• Stop Loss (SL): $0.7315 (invalidates higher low structure — -7.73%)
• Risk-Reward Ratio: 2.36R (favorable for swing positioning)
If ADA can reclaim the $0.85 zone with strong candle closures, it would signal bullish continuation. Momentum indicators like RSI or MACD (not shown) would likely confirm the shift, especially if divergence was forming on recent dips.
Until ADA breaks below $0.7315, the bullish bias remains intact. The formation of higher lows and increasing buying interest at dynamic supports adds weight to the long setup. Price reclaiming the $0.85 zone may trigger a fast rally to $0.93, and possibly beyond if market-wide sentiment remains risk-on.

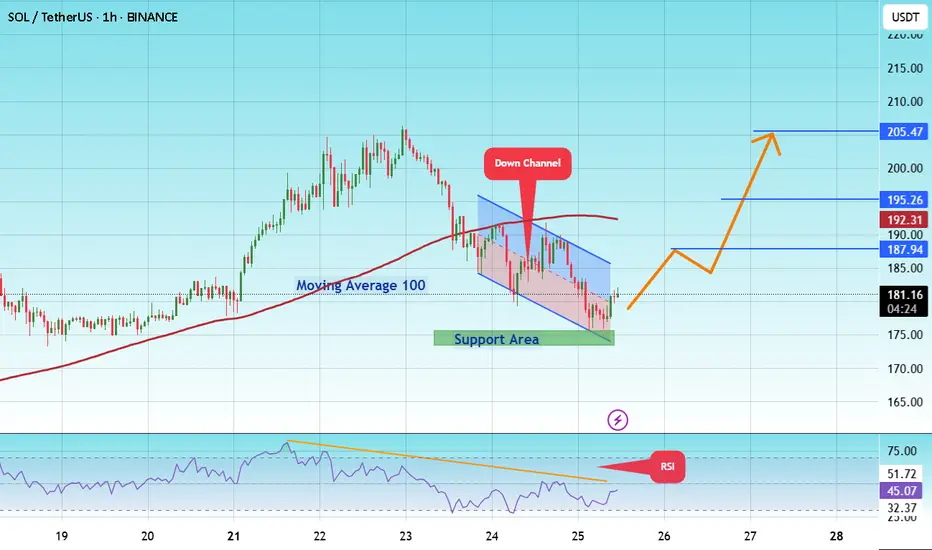
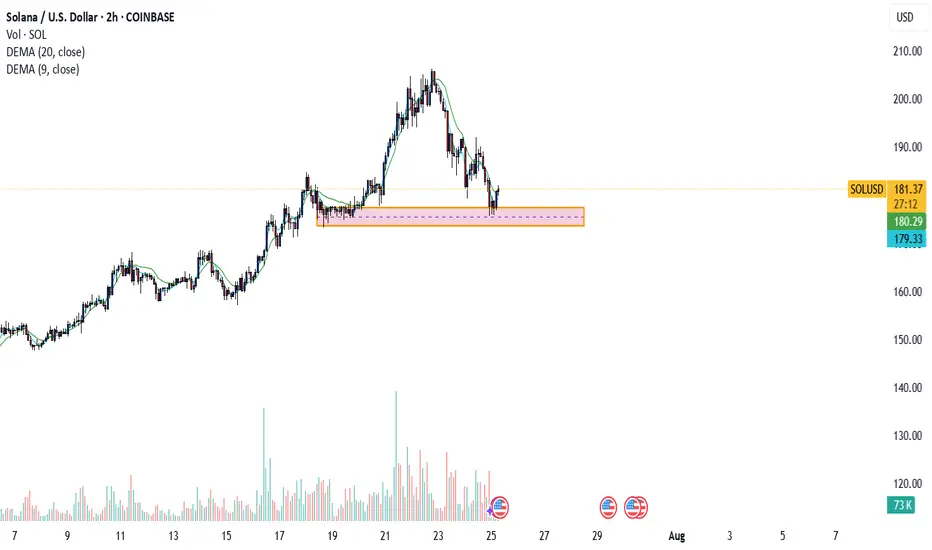
#SOL/USDT coin market structure analysis#SOL
The price is moving within a descending channel on the 1-hour frame and is expected to break and continue upward.
We have a trend to stabilize above the 100 moving average again.
We have a downtrend on the RSI indicator that supports the upward move with a breakout.
We have a support area at the lower boundary of the channel at 175, acting as strong support from which the price can rebound.
We have a major support area in green that pushed the price upward at 174.
Entry price: 181.
First target: 187.
Second target: 195.
Third target: 205.
To manage risk, don't forget stop loss and capital management.
When you reach the first target, save some profits and then change the stop order to an entry order.
For inquiries, please comment.
Thank you.
SP500 & Nasdaq Daily Trade SetupsIn this update we review the recent price action in the E-mini SP500 & Nasdaq futures contracts and identify the next high-probability trade setups and price objectives to target. To review today's video analysis, click here!

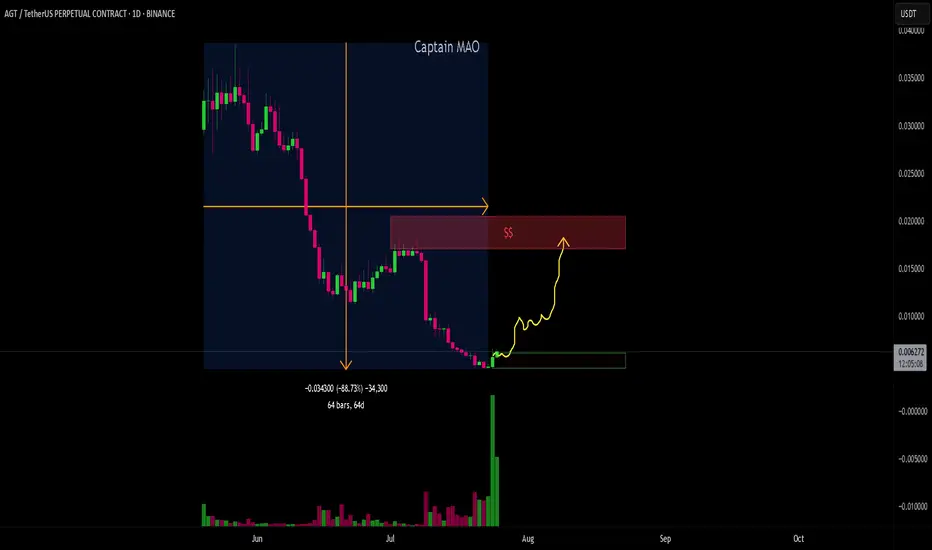
AGT/USDT - ReversalAGT/USDT has been under massive selling pressure since its listing on May 20, 2025, leading to a sharp ~90% decline. However, recent price action is showing strong signs of a potential reversal. Buyers have stepped in aggressively with a noticeable surge in volume, signaling a possible end to the downtrend. The current structure suggests the beginning of accumulation and a high-probability setup for a trend reversal. Targeting 0.018-0.02$ which huge liquidity can be found at this zone .
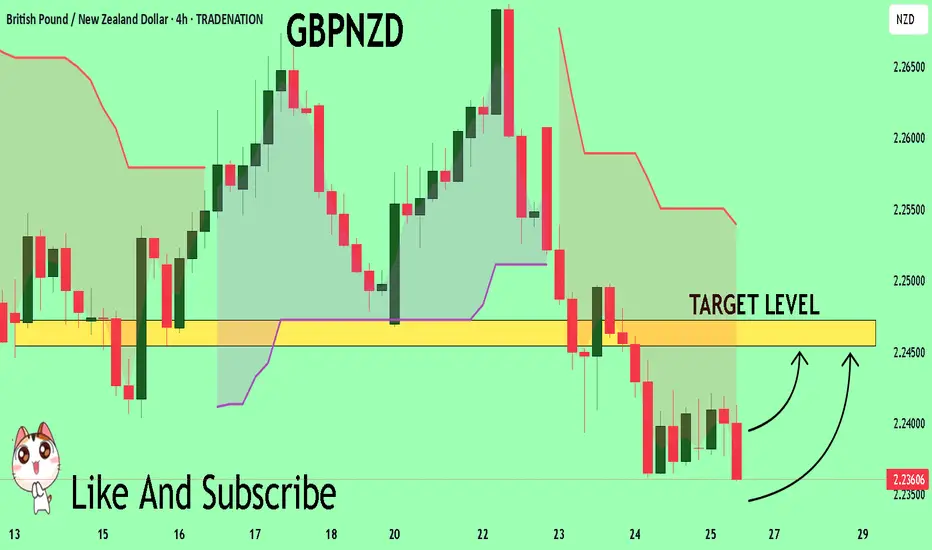
GBPNZD Will Explode! BUY!
My dear friends,
My technical analysis for GBPNZD is below:
The market is trading on 2.2361 pivot level.
Bias - Bullish
Technical Indicators: Both Super Trend & Pivot HL indicate a highly probable Bullish continuation.
Target - 2.2454
About Used Indicators:
A pivot point is a technical analysis indicator, or calculations, used to determine the overall trend of the market over different time frames.
Disclosure: I am part of Trade Nation's Influencer program and receive a monthly fee for using their TradingView charts in my analysis.
———————————
WISH YOU ALL LUCK
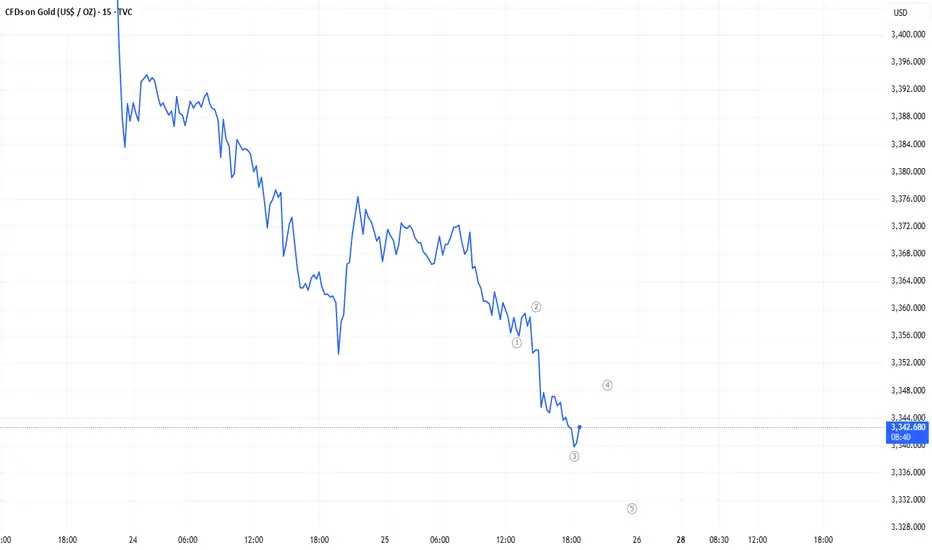
Elliott waveelliott 5 wave structure bearish continuation
sell limit 3347-3350 stoploss 3355, tp 3320
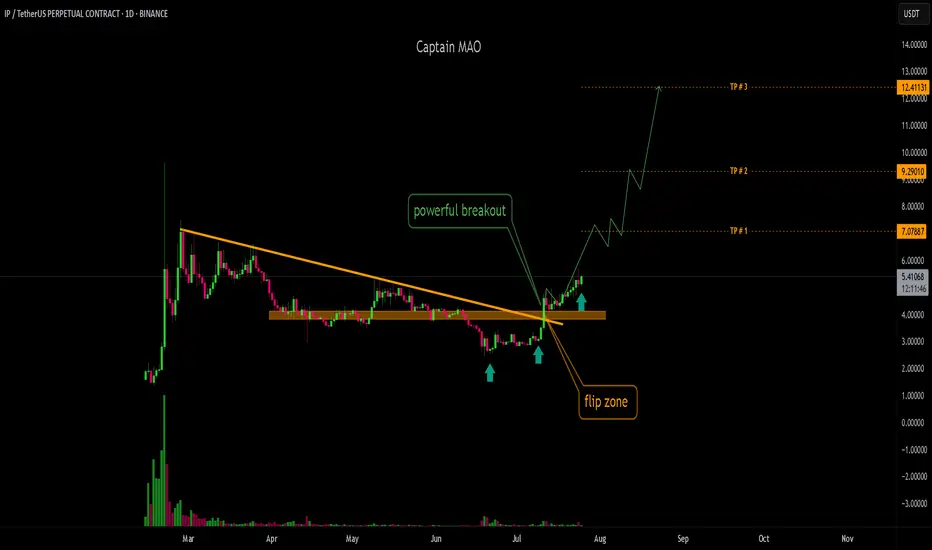
IP/USDT - Continuation P/USDT has formed a solid base support in the $2.60–$2.80 zone over the 20 days, showing strong accumulation. Recently, it broke out of the key $3.30 resistance with significant buying pressure and volume, signaling bullish intent. More importantly, it also broke above a 140 day descending trendline, a major shift in structure. With this clean breakout and confirmation, IP is now looking primed for an upward continuation and potential trend reversal.
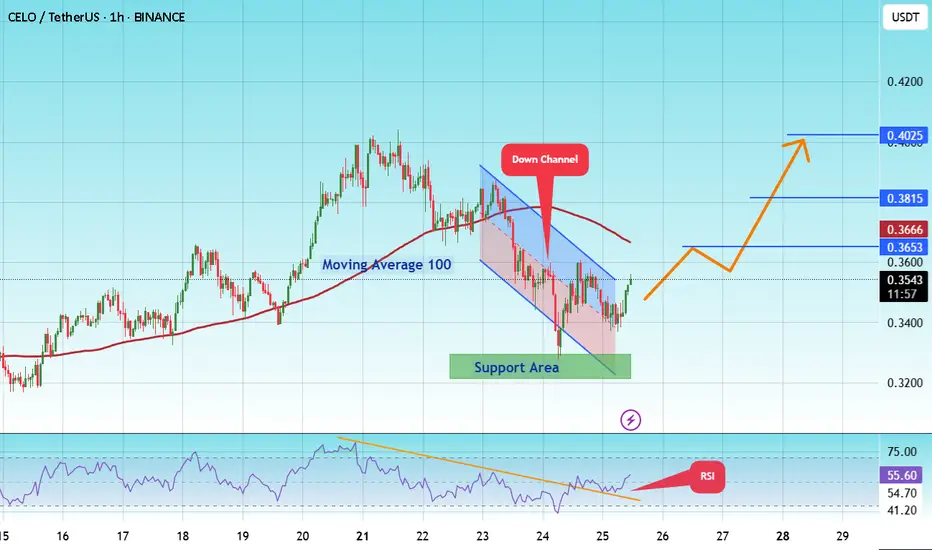
#CELO/USDT Forming Descending Channel !#CELO
The price is moving within a descending channel on the 1-hour frame and is expected to break and continue upward.
We have a trend to stabilize above the 100 moving average once again.
We have a downtrend on the RSI indicator that supports the upward break.
We have a support area at the lower boundary of the channel at 0.3300, acting as strong support from which the price can rebound.
We have a major support area in green that pushed the price higher at 0.3233.
Entry price: 0.3539.
First target: 0.3653.
Second target: 0.3815.
Third target: 0.4025.
To manage risk, don't forget stop loss and capital management.
When you reach the first target, save some profits and then change the stop order to an entry order.
For inquiries, please comment.
Thank you.
USDJPY Under Pressure! SELL!
My dear subscribers,
My technical analysis for USDJPY is below:
The price is coiling around a solid key level - 147.83
Bias - Bearish
Technical Indicators: Pivot Points High anticipates a potential price reversal.
Super trend shows a clear sell, giving a perfect indicators' convergence.
Goal - 147.34
My Stop Loss - 148.12
About Used Indicators:
By the very nature of the supertrend indicator, it offers firm support and resistance levels for traders to enter and exit trades. Additionally, it also provides signals for setting stop losses
Disclosure: I am part of Trade Nation's Influencer program and receive a monthly fee for using their TradingView charts in my analysis.
———————————
WISH YOU ALL LUCK

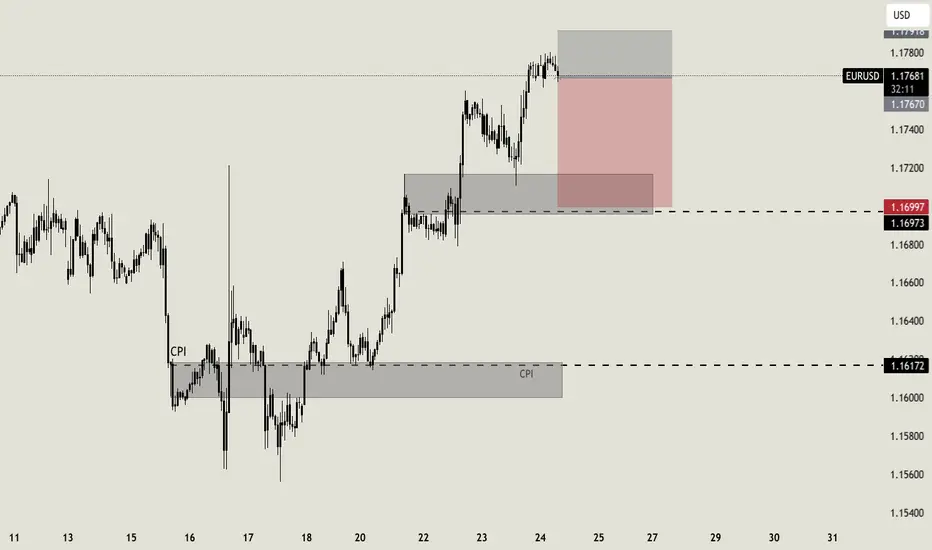
EURUSD Intraweek tradeI know, it's Thursday, but i still think that this can be a good intraweek trade. I expect the price to perform a correction here, till the support area at 1.17. If my analysis is correct i expect the price to be there later today or tomorrow morning
#IOTA/USDT T looking good to buy #IOTA
The price is moving within a descending channel on the 1-hour frame and is expected to break and continue upward.
We have a trend to stabilize above the 100 moving average once again.
We have a downtrend on the RSI indicator that supports the upward break.
We have a support area at the lower boundary of the channel at 0.1847, acting as strong support from which the price can rebound.
We have a major support area in green that pushed the price upward at 0.1880.
Entry price: 0.2054
First target: 0.2119
Second target: 0.2244
Third target: 0.2376
To manage risk, don't forget stop loss and capital management.
When you reach the first target, save some profits and then change the stop order to an entry order.
For inquiries, please comment.
Thank you.

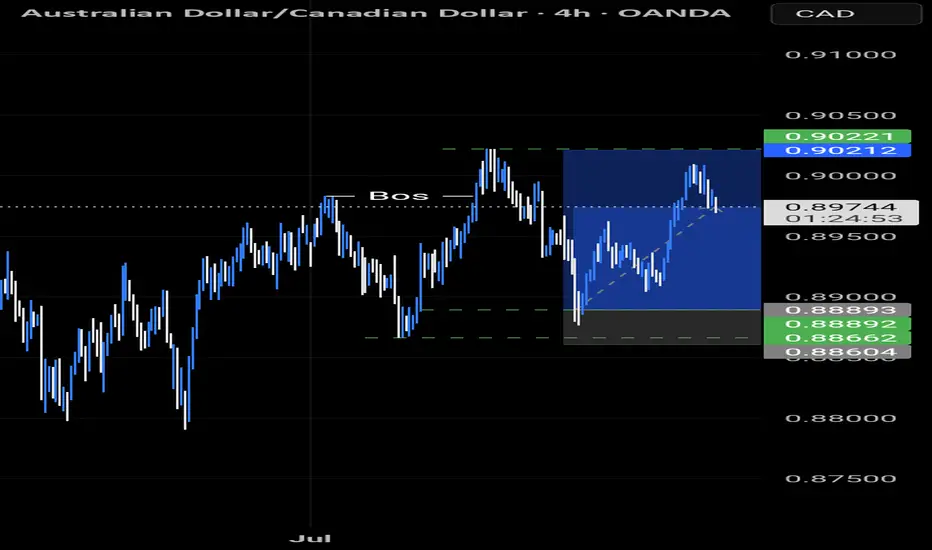
AUDCAD TRADE IDEA AUDCAD has given us a pullback to our Fibonacci level and has flown to the moon...
Let's see if the market does it's thing and gets to our desired target
SOL TO THE MOONthe solana has urged a retracement , going back to its key zone, the next bullrun will explode the price of solana, make sure you have enough sol in your wallet
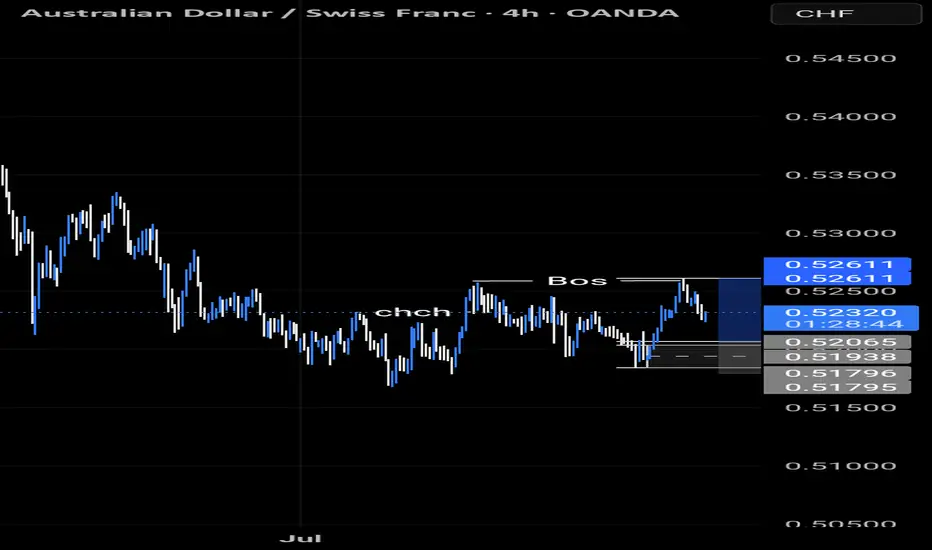
AUDCHF TRADE IDEA We're looking at a continuation trade to the upside on AUDCHF.
Let's see how it goes.
A pullback to our Fibonacci level for a continuation move
EURUSD | Time For A Pullback?The week kicked off with strong impulsive moves to the upside, leaving no room for deeper correction. Then slowly from Wednesday, we started to see a decline in strength in the bullish run.
Now, with price edging toward the next swing low for a possible bearish change of character, is this a good way to ride the stream to the downside?
Keep your A-game on as we watch price unfold, and trade reactively to price movement.
Do not forget to guard your capitals with risk management.
Good luck traders. 👍
Follow me for more and more of these analyses.
See you on the next one. 🫡

ETH/USDT – Altseason Confirmation in Sight?Ethereum's recent breakout at 1900$ is showing strong momentum and may be signaling the long-awaited start of altseason. A daily close above the red resistance box will act as a key confirmation of this shift and could trigger a parabolic move across many altcoins.
For ETH, the next upside targets are:
$3,500
$4,000
$4,700
Stay alert — a confirmed breakout here could light the fuse for the broader altcoin market.

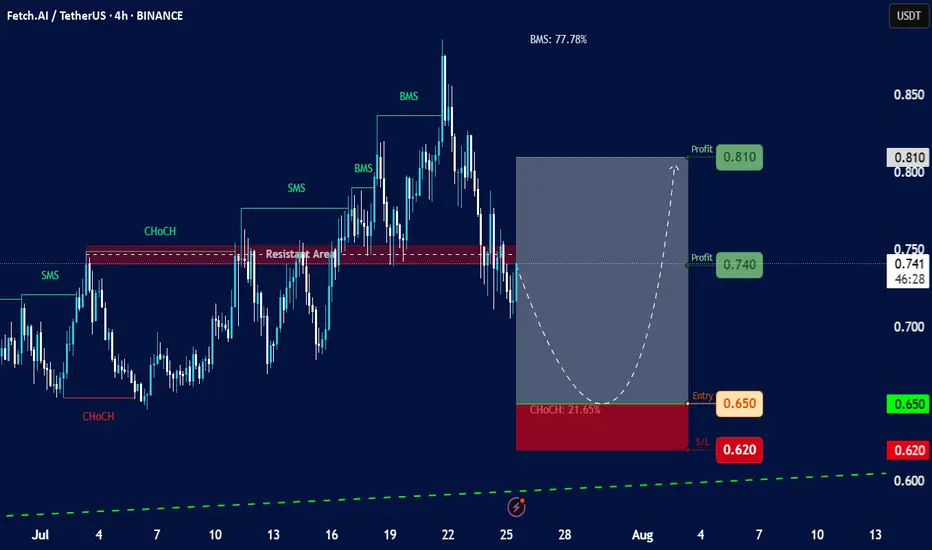
Fetch.AI (FET) against TetherUS (USDT)Chart Overview:
Asset: Fetch.AI (FET) against TetherUS (USDT).
Timeframe: 4-hour (4h) candles.
Current Price (approximate based on chart): Around 0.741 USDT.
Date and Time on Chart: July 25, 2025, 15:11 UTC+4 (This matches the current provided time context, so the chart is very recent).
Overall Trend: The chart shows a recent upward movement followed by a retracement. There are clear indications of "SMS" (Structural Market Shift) and "BMS" (Break in Market Structure) bullish movements, indicating an uptrend was in play.
Key Technical Observations and Labels:
"ChoCH" (Change of Character):
Initial Bullish ChoCH (early July): An initial "ChoCH" is marked early July, signaling a potential shift from bearish to bullish sentiment.
"SMS" (Structural Market Shift) & "BMS" (Break in Market Structure):
Several "SMS" and "BMS" points are identified, suggesting consecutive higher highs and higher lows, confirming an uptrend. The "BMS: 77.78%" label might refer to the percentage gain from a previous low to a recent high, or a percentage of the total movement.
"Resistant Area":
A significant horizontal red dashed line labeled "Resistant Area" is present around the 0.74-0.76 USDT level. This area previously acted as resistance, and the price is currently retesting or struggling with it.
Current Price Action:
The price has recently come down significantly from a peak around 0.88 USDT, retesting the "Resistant Area." It appears to have broken below some immediate support levels.
Proposed Trade Setup (Green Box & Red Box):
Entry (Green Line): 0.650 USDT. This is positioned below the current price, suggesting a "buy the dip" strategy.
Stop Loss (Red Line): 0.620 USDT. This is a tight stop loss, indicating a risk management level if the price drops further.
Profit Targets (Green Boxes):
Profit 1: 0.740 USDT (already very close to the current price, potentially hit or missed depending on execution).
Profit 2: 0.810 USDT.
"ChoCH: 21.65%" (near entry zone): This likely indicates the percentage retracement from the peak to the proposed entry zone, suggesting it's a significant pullback.
Projected Path (Dashed White Line): The curved dashed line shows an anticipated price movement: a dip down to the 0.650 entry zone, followed by a bounce back up towards the profit targets.
Analysis of the Proposed Trade:
Risk-Reward:
Risk: From 0.650 (Entry) to 0.620 (S/L) = 0.030 USDT risk.
Reward 1: From 0.650 (Entry) to 0.740 (Profit 1) = 0.090 USDT reward. (Ratio: 3:1)
Reward 2: From 0.650 (Entry) to 0.810 (Profit 2) = 0.160 USDT reward. (Ratio: approx. 5.3:1)
The risk-reward ratio appears favorable for this proposed trade.
Logic: The setup seems to be based on the idea of a significant retracement (pullback) to a key support level (the proposed 0.650 entry, potentially an order block or demand zone not explicitly marked but implied by the "ChoCH: 21.65%" label in that area) after a strong bullish run. The "Resistant Area" at 0.74-0.76 becomes the first target as the price would need to break back above it.
Considerations and Potential Risks:
Validity of Support: The effectiveness of the 0.650 level as strong support is crucial. If it breaks, the price could fall further.
Market Structure Shift (again): While the uptrend had strong "BMS" signals, the current deeper retracement could lead to a bearish "ChoCH" on a higher timeframe if the 0.650 support fails.
Liquidity: Ensure sufficient liquidity at the proposed entry and exit points, especially with a tighter stop loss.
Overall Market Conditions: The performance of Bitcoin (BTC) and the broader crypto market will significantly influence FET's price action.
Volume: The chart doesn't show volume indicators, which would provide additional insight into the strength of price movements.
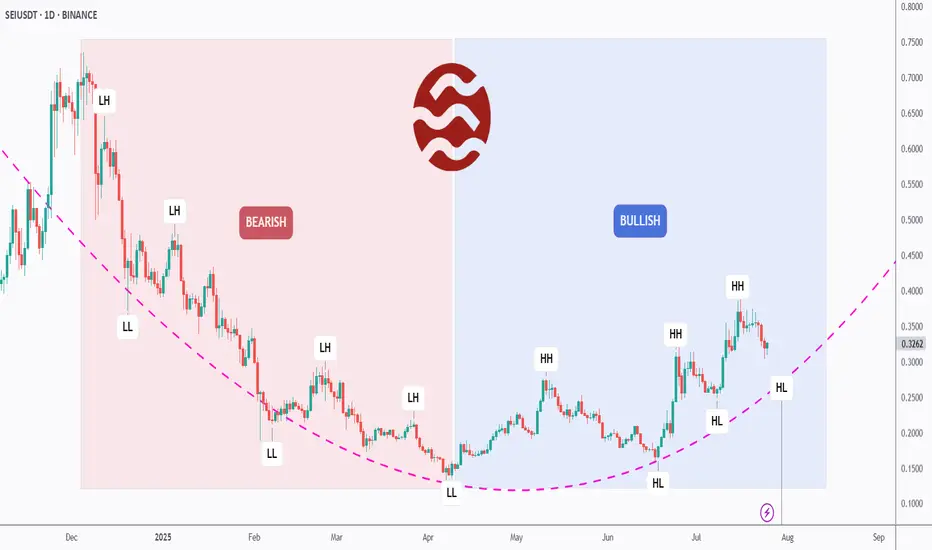
[Deep Dive] SEI – Edition 2: From Pain to Power: A Bull Cycle?SEIUSDT may have just flipped the script.
After months of consistent lower highs and lower lows, SEI has officially broken its bearish structure and is now printing clear higher highs (HH) and higher lows (HL) — a textbook sign of a trend reversal.
📉 Left Side: Bearish Breakdown
From late 2023 to Q2 2025, SEI was stuck in a painful macro downtrend. The structure was brutally clean: LH → LL → LH → LL. Each bounce was weaker than the last, reflecting exhausted buyers and relentless supply.
But something changed in late Q2…
📈 Right Side: Bullish Rebuild
Since its final low around April, SEI began to carve a new path. What started as a subtle accumulation quickly morphed into a solid structure of higher highs and higher lows.
The arc-shaped pink trendline tracks this momentum shift — and we’re now watching a potential continuation of the bullish cycle.
The most recent HL is forming exactly on that curve — a critical moment where bulls may step in for the next impulsive move.
🔥 What’s Fueling the Shift?
SEI is gaining traction as a high-performance Layer 1 designed for trading apps, with native parallelization and a focus on speed and throughput.
Its recent ecosystem growth — including projects in DeFi, gaming, and infrastructure — has started to attract both retail and VC attention.
On-chain metrics are showing increased activity, and whispers of upcoming protocol incentives could be the spark that pushes SEI toward the $0.45–$0.50 range.
🧠 What We’re Watching
- The current HL zone — will bulls defend this level?
- If SEI can break above the previous HH, the bullish structure strengthens.
- A failure to hold this HL would suggest a range or even deeper correction — so risk management is key.
Let’s recap:
- Structure has flipped bullish ✅
- SEI is riding a fresh higher low ✅
- Fundamental momentum is building behind the scenes ✅
It’s now up to the market to decide if this was just a bounce — or the beginning of a much bigger move.
💬 What do YOU think: Is SEI building steam for a breakout, or just teasing us with a fakeout?
🔔 Disclaimer: This analysis is for educational and informational purposes only. It does not constitute financial advice or a recommendation to buy or sell any asset. Always do your own research and manage your risk accordingly.
📚 Always follow your trading plan => including entry, risk management, and trade execution.
Good luck!
All strategies are good, if managed properly.
~ Richard Nasr