gbpusdwe have active order block on gbpusd and we will wait for confirmation entry dont open position until i active it manually
OANDA:GBPUSD
Wave Analysis

ADA/USDT | Multi-Month Breakout Brewing — a 10x play ?Cardano is quietly mirroring its previous macro cycle — but this time, the structure looks tighter, cleaner, and potentially more explosive.
The multi-month chart reveals a consistent uptrend forming off the 2022 lows, contained within a well-respected ascending channel. The price action shows strong similarities to the 2018–2020 accumulation phase, followed by the breakout that led ADA to its all-time high in 2021.
The current price structure is forming higher highs and higher lows within a channel — a strong bullish continuation pattern.
Volume has been increasing steadily during the up-moves, signaling real demand building underneath.
Fibonacci Extensions from the previous cycle highs and lows show key long-term resistance zones:
1.618 – $4.91
2.618 – $7.79
4.236 – $12.47
These levels could act as major psychological targets if the trend continues to evolve similarly to the last cycle.
⏳ Current Price (~$0.64) is still significantly below previous all-time highs and long-term extension zones — offering a potentially favorable risk/reward setup for patient investors.
⚠️ As always, nothing moves in a straight line — but if you're a macro-mind investor, you’ll start to notice more straight lines than most. Zooming out often reveals the patterns that noise hides.

CHFJPY Bullish Flag Breakout!
HI,Traders !
CHFJPY is trading in an
Uptrend and
Now breaking out of the
Bullish flag pattern so we
Are bullish biased now
And we will be expecting a
Further move up !
Comment and subscribe to help us grow !

Fakeout or pullback?In my opinion, even though the trend is bullish, short positions are easier to take right now. That’s because on the way up, the price keeps hitting the EMAs, which makes upward movement harder — but on the way down, there’s nothing in its path.
CHFJPY - The Bulls Are Exhausted!Hello TradingView Family / Fellow Traders. This is Richard, also known as theSignalyst.
📈CHFJPY has been overall bullish trading within the rising channel marked in blue and it is currently retesting the upper bound of it.
Moreover, the green zone is a strong supply.
🏹 Thus, the highlighted red circle is a strong area to look for sell setups as it is the intersection of the upper blue trendline and green supply.
📚 As per my trading style:
As #CHFJPY is hovering around the red circle zone, I will be looking for bearish reversal setups (like a double top pattern, trendline break , and so on...)
📚 Always follow your trading plan regarding entry, risk management, and trade management.
Good luck!
All Strategies Are Good; If Managed Properly!
~Richard Nasr
Disclosure: I am part of Trade Nation's Influencer program and receive a monthly fee for using their TradingView charts in my analysis.

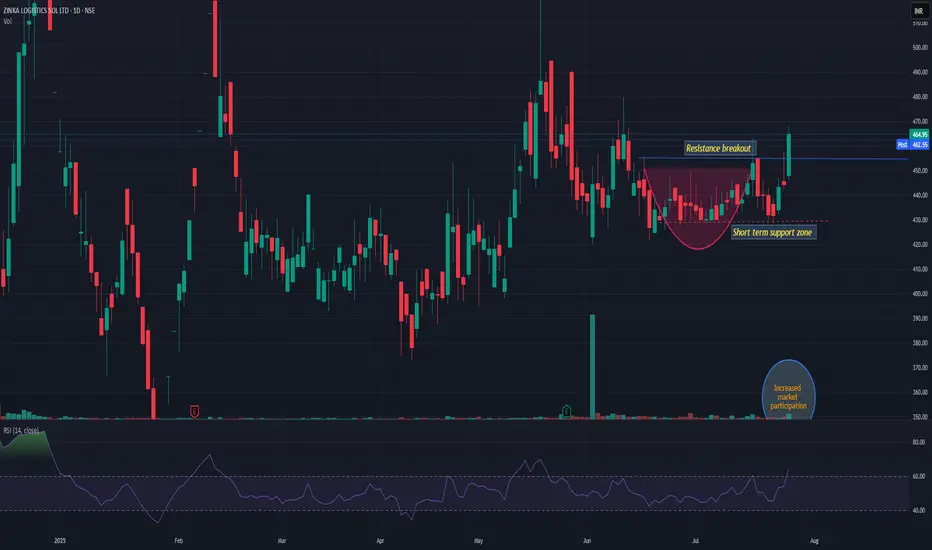
BLACKBUCKBLACKBUCK showing strength and crossed previous resistance zone with decent volume. Support is near 425-8 levels. Resistance is near 510 and above that it may enter into uncharted zone. Keep it on radar.
Crypto market review [UPD]: set-ups in BTC and alt-coinsMade a quick video going over some of the setups I see developing in Bitcoin and a few altcoins I personally track and trade.
Thank you for your attention and I wish you successful trading decisions!
If you’d like to hear my take on any other coin you’re following — feel free to ask in the comments (just don’t forget to boost the idea first 😉).

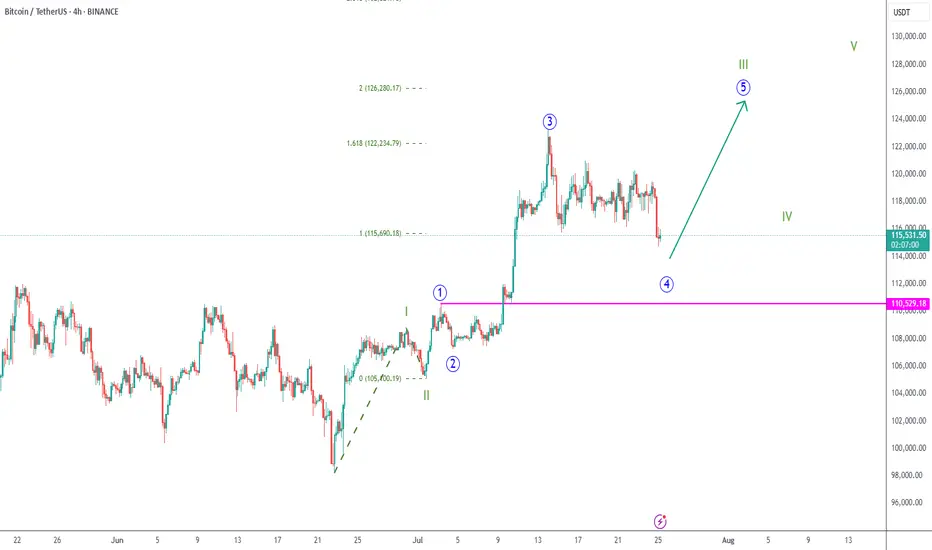
BTC 4H Chart Uptrend
➡️ My wave count considers we're now in blue wave 4, and this corrections should finish soon.
➡️ The 125k round number is an interesting target for green wave III.
➡️ This scenario is valid as long as we stay above blue 1 top (at 110.529).
GOLD Will Move Higher! Buy!
Here is our detailed technical review for GOLD.
Time Frame: 12h
Current Trend: Bullish
Sentiment: Oversold (based on 7-period RSI)
Forecast: Bullish
The market is on a crucial zone of demand 3,347.64.
The oversold market condition in a combination with key structure gives us a relatively strong bullish signal with goal 3,425.86 level.
P.S
We determine oversold/overbought condition with RSI indicator.
When it drops below 30 - the market is considered to be oversold.
When it bounces above 70 - the market is considered to be overbought.
Disclosure: I am part of Trade Nation's Influencer program and receive a monthly fee for using their TradingView charts in my analysis.
Like and subscribe and comment my ideas if you enjoy them!

EURUSD Is Bullish! Long!
Take a look at our analysis for EURUSD.
Time Frame: 9h
Current Trend: Bullish
Sentiment: Oversold (based on 7-period RSI)
Forecast: Bullish
The price is testing a key support 1.173.
Current market trend & oversold RSI makes me think that buyers will push the price. I will anticipate a bullish movement at least to 1.184 level.
P.S
Overbought describes a period of time where there has been a significant and consistent upward move in price over a period of time without much pullback.
Disclosure: I am part of Trade Nation's Influencer program and receive a monthly fee for using their TradingView charts in my analysis.
Like and subscribe and comment my ideas if you enjoy them!

Gold on the magic level, pullback?Gold reached a key level i was waiting for more than a week. The area from 3325 till 3350 is the real support zone that could lead the price to pullback. In H1 and M15 timeframe i can see a reversal pattern, that let me join this trade with a small risk (due to the RR ratio). I will increase my size if NY will give us a better scalp opportunity

GBPAUD Is Going Up! Buy!
Here is our detailed technical review for GBPAUD.
Time Frame: 1D
Current Trend: Bullish
Sentiment: Oversold (based on 7-period RSI)
Forecast: Bullish
The market is testing a major horizontal structure 2.051.
Taking into consideration the structure & trend analysis, I believe that the market will reach 2.072 level soon.
P.S
The term oversold refers to a condition where an asset has traded lower in price and has the potential for a price bounce.
Overbought refers to market scenarios where the instrument is traded considerably higher than its fair value. Overvaluation is caused by market sentiments when there is positive news.
Disclosure: I am part of Trade Nation's Influencer program and receive a monthly fee for using their TradingView charts in my analysis.
Like and subscribe and comment my ideas if you enjoy them!

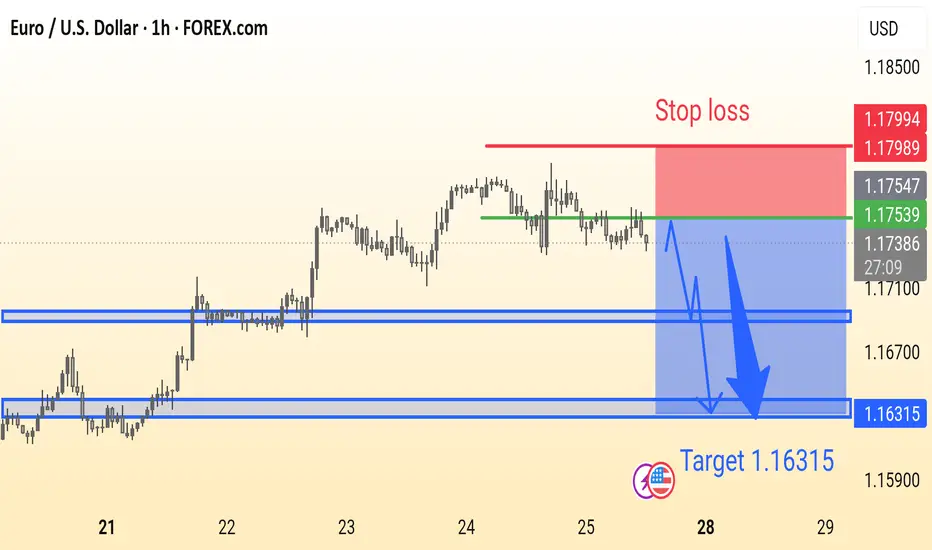
EURUSD Analysis is ReadyEUR/USD Trade Idea (1H Chart):
Price is ranging below resistance with a potential bearish breakout. Suggested Sell near 1.1753 with Stop Loss at 1.1799 and Target at 1.16315. Strong support zones marked for possible reaction.
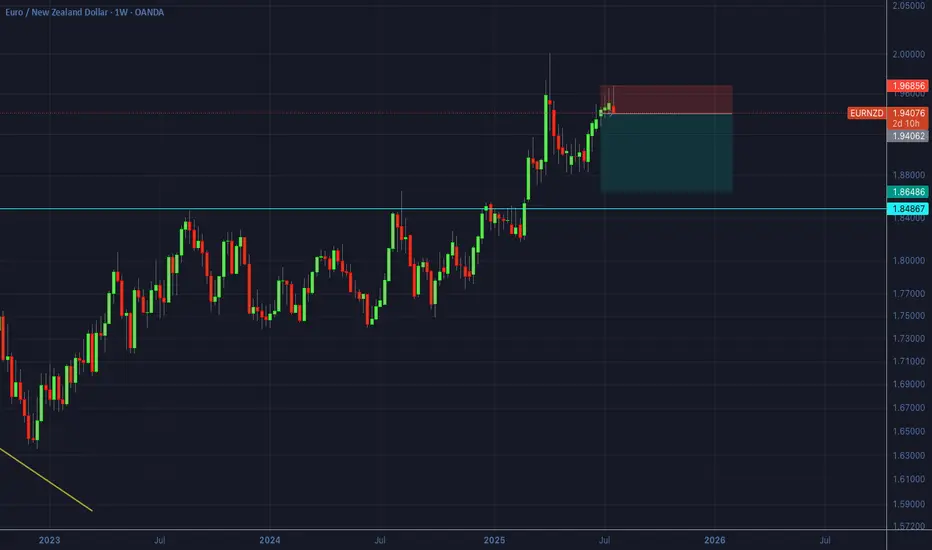
EURNZD - Weekly shortFor those who want to try and keep a weekly operation, this is a potential candidate.
Levels on the chart. Remember that whether you are intra day trading or trading daily and weekly swings, money management rules do not change: should the be hit, that loss should not be greater than 0.5 or 1% of your free equity, so calculate your position size accordingly.
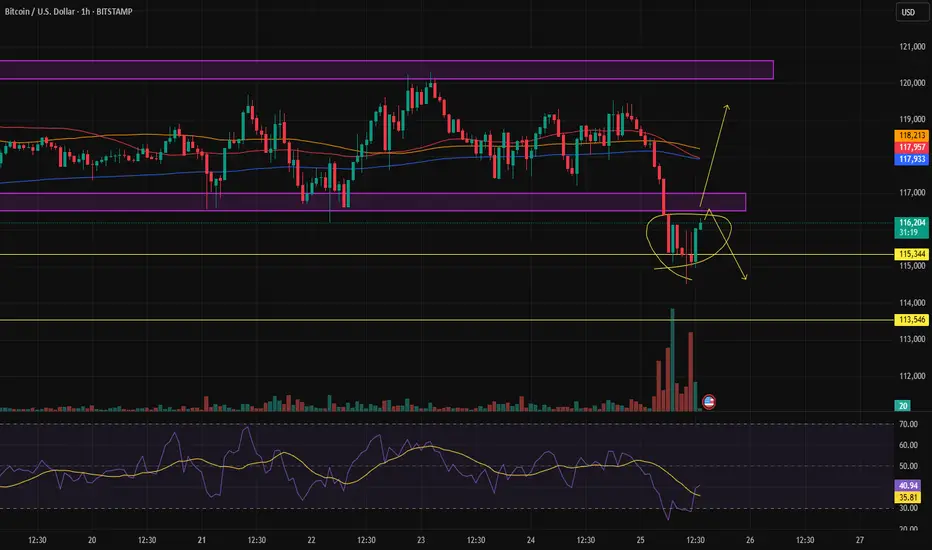
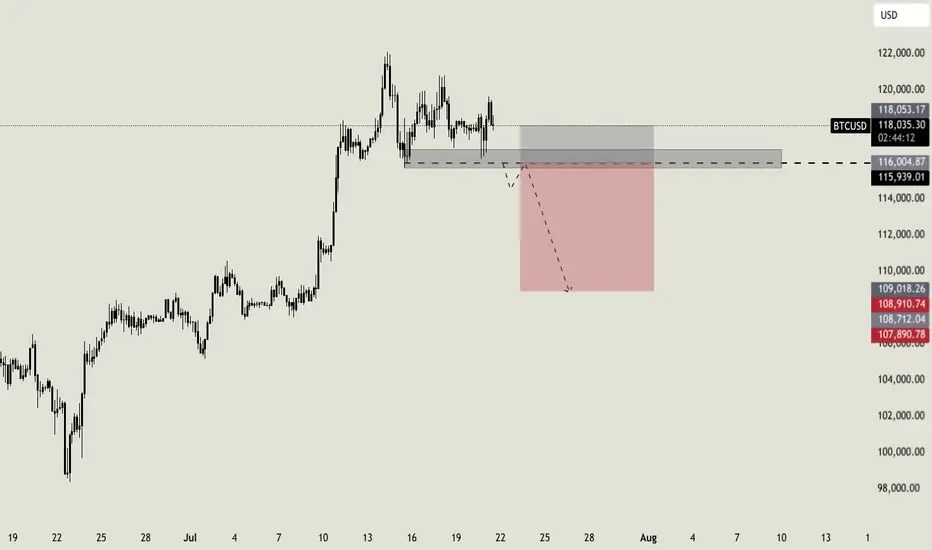
Bitcoin short setupBTC is ranging on top, this means next leg is preparing. Most traders are positioned long, that's why i think price will sink after a break below my key area. I will wait a break and a retrace before entering short, targeting the $109.000 area
Potentian BUY gold again...I found the best location to buy gold again, will gold make ATH, or will it just return to testing the order block above which is still fresh??

DXY - BearishI am expecting more bearish on the USD. There is a possiblity it can get to 97.984 before bearish resumes.

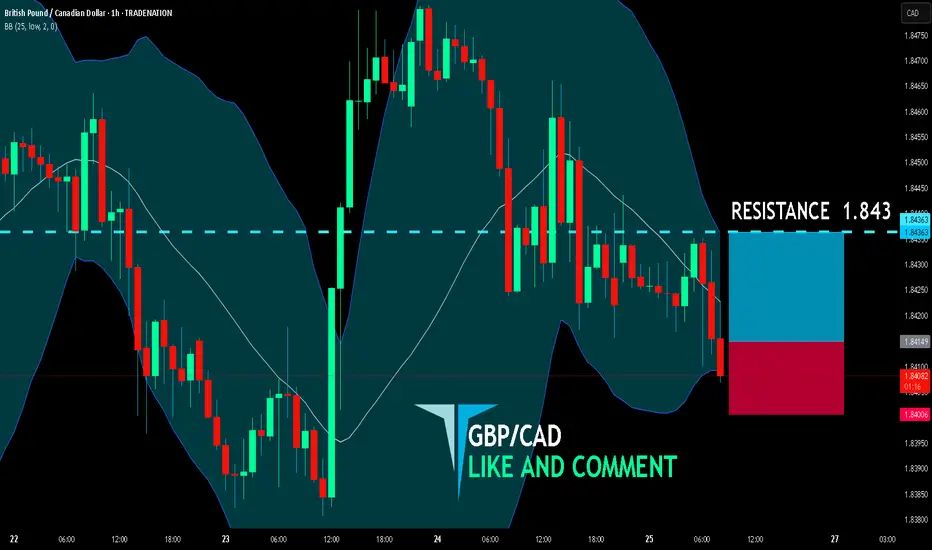
GBP/CAD BUYERS WILL DOMINATE THE MARKET|LONG
GBP/CAD SIGNAL
Trade Direction: long
Entry Level: 1.841
Target Level: 1.843
Stop Loss: 1.840
RISK PROFILE
Risk level: medium
Suggested risk: 1%
Timeframe: 1h
Disclosure: I am part of Trade Nation's Influencer program and receive a monthly fee for using their TradingView charts in my analysis.
✅LIKE AND COMMENT MY IDEAS✅
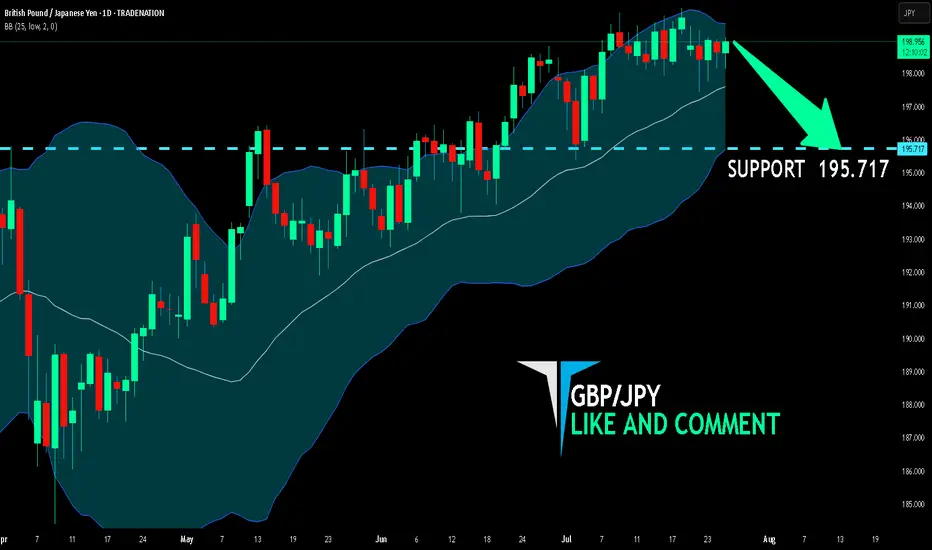
GBP/JPY BEARISH BIAS RIGHT NOW| SHORT
Hello, Friends!
GBP/JPY pair is trading in a local uptrend which we know by looking at the previous 1W candle which is green. On the 1D timeframe the pair is going up too. The pair is overbought because the price is close to the upper band of the BB indicator. So we are looking to sell the pair with the upper BB line acting as resistance. The next target is 195.717 area.
Disclosure: I am part of Trade Nation's Influencer program and receive a monthly fee for using their TradingView charts in my analysis.
✅LIKE AND COMMENT MY IDEAS✅

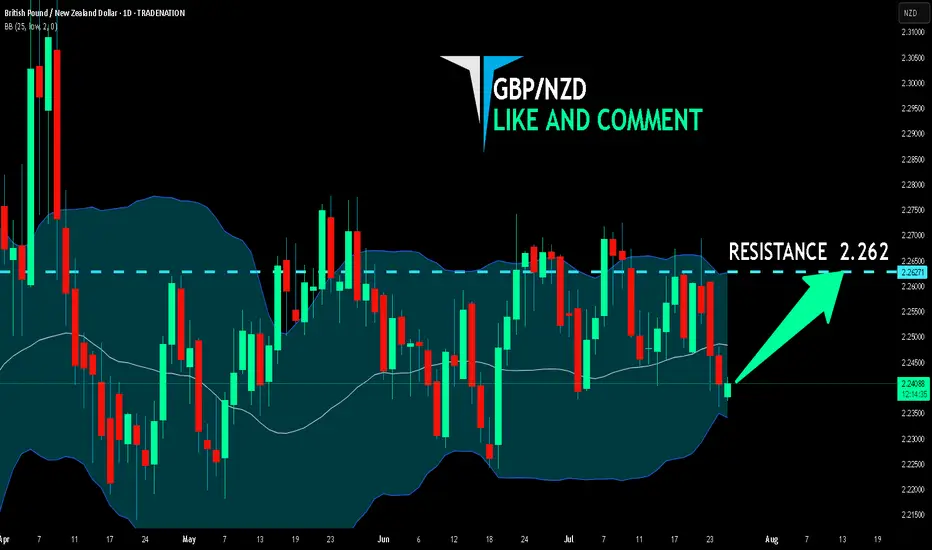
GBP/NZD BEST PLACE TO BUY FROM|LONG
Hello, Friends!
We are going long on the GBP/NZD with the target of 2.262 level, because the pair is oversold and will soon hit the support line below. We deduced the oversold condition from the price being near to the lower BB band. However, we should use low risk here because the 1W TF is red and gives us a counter-signal.
Disclosure: I am part of Trade Nation's Influencer program and receive a monthly fee for using their TradingView charts in my analysis.
✅LIKE AND COMMENT MY IDEAS✅
USDJPY - Sell SetupI am expecting a sell setup for this pair at the 61.8 retracement of the previous swing.

USDJPY 30Min Engaged ( Bullish Entry Detected )————-
➕ Objective: Precision Volume Execution
Time Frame: 30-Minute Warfare
Entry Protocol: Only after volume-verified breakout
🩸 Bullish From now Price : 146.500
➗ Hanzo Protocol: Volume-Tiered Entry Authority
➕ Zone Activated: Dynamic market pressure detected.
The level isn’t just price — it’s a memory of where they moved size.
Volume is rising beneath the surface — not noise, but preparation.
🔥 Tactical Note:
We wait for the energy signature — when volume betrays intention.
The trap gets set. The weak follow. We execute.
