XAUUSD FORMING A CONTRACTING TRIANGLEXAUUSD is forming a contracting triangle which is much visual on the Daily T.F.
This is a continuation pattern.Since Wave 3 is completed,Wave 4 is forming a contracting triangle which is time consuming which can lead to permature trade entries or missed opportunities.
Best trade is to wait for the completion of Wave 4 at the 3055 level,which may push prices higher to the 3850 level a new high.
Wave Analysis

Gold. Trade Swing buy setup 25/July/25XAUUSD "erased" all its early weekly gain by having deep pullback until its weekly pivot and channel support confluence zone again..

NZDUSD Potential UpsidesHey Traders, in today's trading session we are monitoring NZDUSD for a buying opportunity around 0.59800 zone, NZDUSD is trading in an uptrend and currently is in a correction phase in which it is approaching the trend at 0.59800 support and resistance area.
Trade safe, Joe.

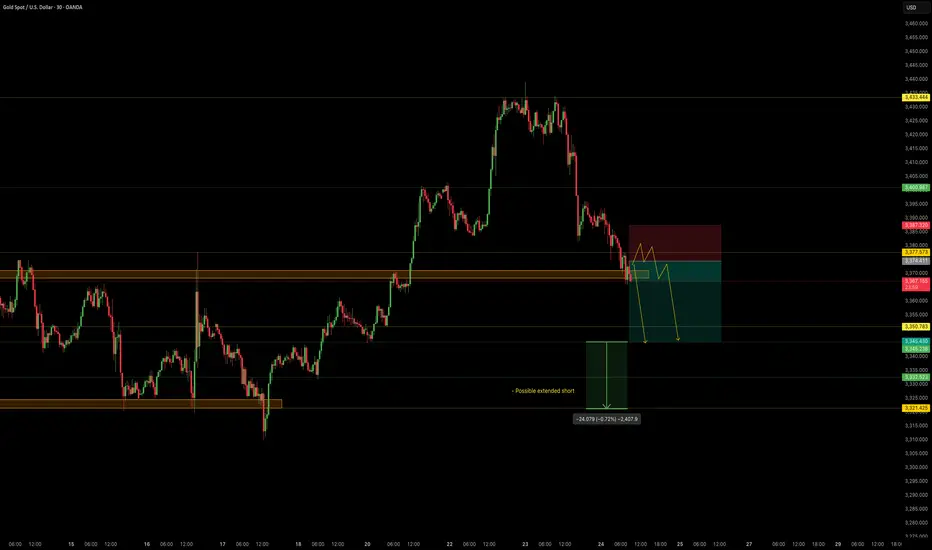
NordKern - XAUUSD InsightNordKern | Simplified Insight OANDA:XAUUSD – Short Opportunity Ahead
Gold is now near our important level at 3370, offering a shorting opportunity considering recent events and technical action.
Gold Price Decline – What's Behind It?
In the last two sessions (July 23–24), gold has retreated strongly owing to a set of global as well as market-specific circumstances:
1. Trade Deal Optimism
Advances in U.S.–Japan and U.S.–EU trade discussions lessened worldwide uncertainty, decreasing demand for gold as a safe-haven.
2. Higher U.S. Yields
Higher Treasury yields are rendering non-yielding assets such as gold less appealing, adding to downward pressure.
3. Technical & Profit-Taking
Following a recent rally, gold was exposed to selling. Stop-loss and profit-taking triggers hastened the fall.
Summary of Key Drivers
U.S. Trade Deals: Reduced geopolitical risk
Higher Treasury Yields: Decreased gold's relative attractiveness
Technical Selling: Enhanced the downward trend
Trade Setup – Bearish Bias
Entry : 3374.4
Stop Loss : 3387.3
Take Profit : 3345.4
Extended Target : 3322
Key Notes:
- Trade Deal Optimism: U.S.–Japan and U.S.–EU agreements eased global tensions, reducing demand for gold as a safe-haven asset.
- Yield Pressure: Rising U.S. Treasury yields made gold less attractive compared to interest-bearing alternatives.
- Technical Selling: Profit-taking and stop-loss triggers accelerated the decline after gold’s recent rally.
This setup remains tactically driven. Manage risk carefully and monitor for any renewed political shifts.
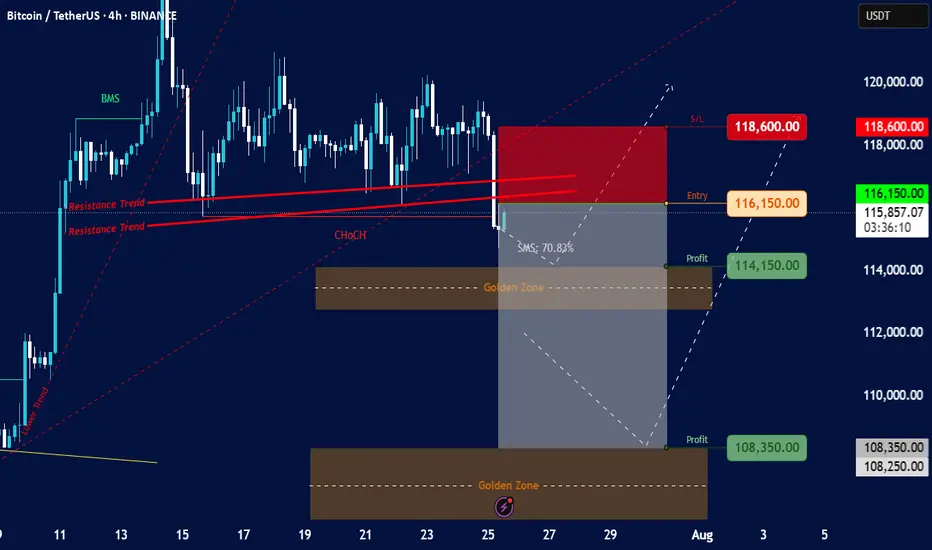
Bitcoin/TetherUS (BTC/USDT) on a 4-hour timeframeOverall Trend & Price Action:
Prior Uptrend: The chart shows a clear uptrend leading up to around July 15th, marked by an "Order Trend" line (dashed green).
Break of Market Structure (BMS): A "BMS" (Break of Market Structure) label is visible, suggesting a significant shift in market dynamics, likely indicating the end of the previous uptrend or a strong pullback.
Consolidation/Distribution: After the initial uptrend, the price appears to have entered a period of consolidation or potential distribution between approximately $115,000 and $120,000.
Resistance Trends: Several "Resistance Trend" lines (red) are drawn, indicating areas where the price has faced selling pressure. A recent breakdown below these resistance lines is evident.
Change of Character (ChoCH): A "ChoCH" label is present, which often signifies a change in the prevailing market sentiment or trend, confirming the shift away from the strong bullish momentum.
Current Price & Trading Setup:
Current Price: The current price is around $115,849.44.
Proposed Entry: The chart suggests an "Entry" point at $116,150.00. This is positioned just above the current price and within a potential retest zone of the broken resistance.
Stop Loss (S/L): The "S/L" is set at $118,600.00, indicating a risk management level if the trade goes against the intended direction.
Profit Targets (Profit):
First Profit Target: $114,150.00, located just above the first "Golden Zone."
Second Profit Target: $108,350.00, situated within the second "Golden Zone."
Golden Zones: Two "Golden Zones" (brown shaded areas) are identified, which are typically areas of significant support/demand or Fibonacci retracement levels where price is expected to react. The current setup seems to target these zones for profit-taking.
SMS: 70.83%: This "SMS" value (likely referring to "Smart Money Score" or a similar metric) of 70.83% suggests a strong bearish bias or conviction in the current setup.
Interpretation & Potential Strategy:
The analysis suggests a bearish trading setup for BTC/USDT.
The presence of BMS, ChoCH, and the breakdown below resistance trends indicate a potential shift from bullish to bearish sentiment or a significant correction.
The proposed short entry at $116,150.00 aims to capitalize on further downward movement.
The profit targets align with identified "Golden Zones," suggesting that these are anticipated areas of support where the bearish momentum might temporarily stall or reverse.
The significant "SMS" value reinforces the bearish outlook.
Risks & Considerations:
Reversal from Golden Zones: While profit targets are set at Golden Zones, these are also potential areas for price reversals if strong buying interest emerges.
False Breakout/Breakdown: The market can always surprise, and a re-entry above the stop-loss level would invalidate the current bearish setup.
Market Volatility: Cryptocurrency markets are highly volatile, and rapid price movements can occur.
News Events: Unforeseen news or macroeconomic events could significantly impact price action.
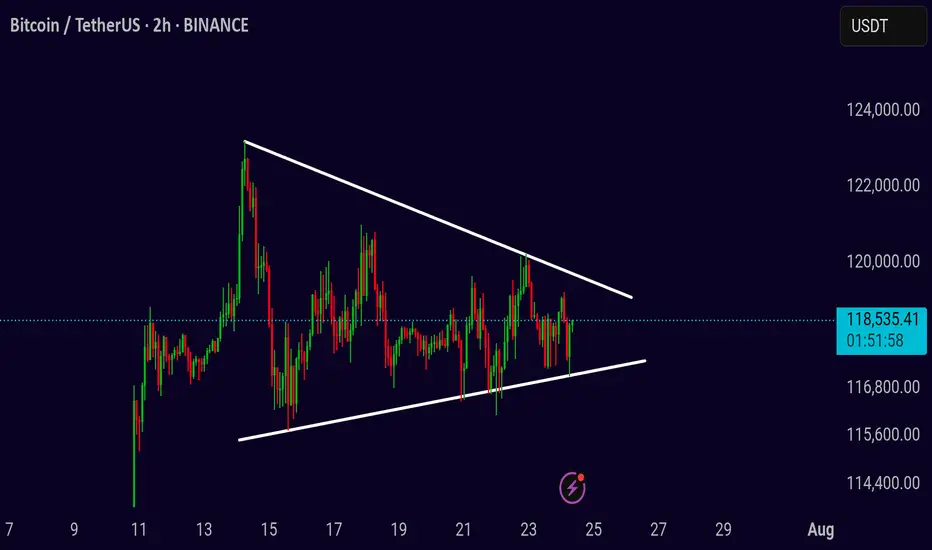
BTC Symmetrical Triangle – Decision Time Soon
BTCUSDT Idea (2H Chart)
BTC is consolidating inside a symmetrical triangle, creating pressure for a breakout. Price is currently ranging between 116K–120K, with volatility compressing.
Patience is key here — don’t rush entries.
A confirmed breakout or breakdown will give the real direction.
Break above the triangle = bullish continuation
Break below = further correction ahead
Wait for 2H close outside the pattern with volume
Watch levels:
* Upside: 120K → 124K → 128K
* Downside: 116K → 112K → 108K
Setup is maturing — breakout is just a matter of time. Let the chart lead, not emotions.
EURGBP: Bearish Forecast & Outlook
The charts are full of distraction, disturbance and are a graveyard of fear and greed which shall not cloud our judgement on the current state of affairs in the EURGBP pair price action which suggests a high likelihood of a coming move down.
Disclosure: I am part of Trade Nation's Influencer program and receive a monthly fee for using their TradingView charts in my analysis.
❤️ Please, support our work with like & comment! ❤️

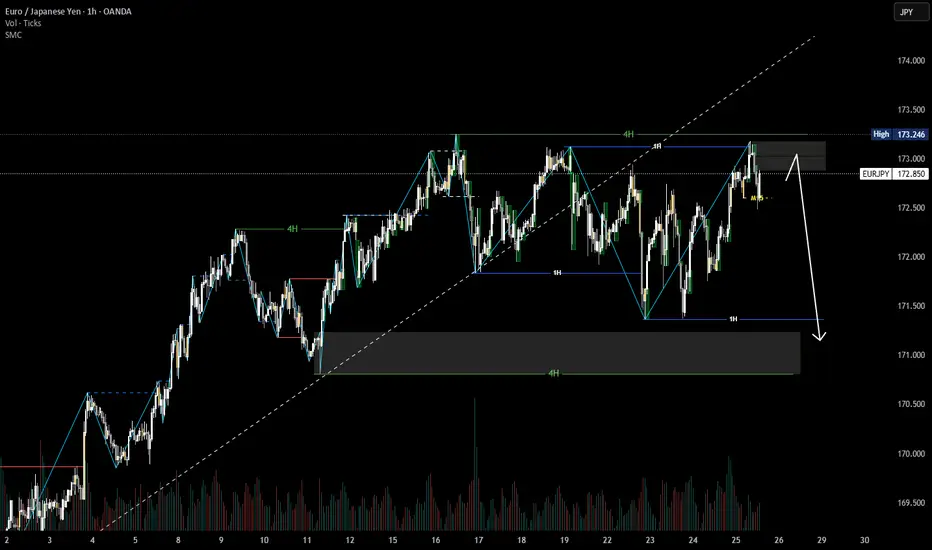
EURJPY Market Structure Analysis on 1H, 4H Timeframe4H timeframe is bullish.
1H timeframe is bearish
Price is currently clearing the top of 1H timeframe so there is a high chance that price will continue to fall to the Demand zone of 4H timeframe.
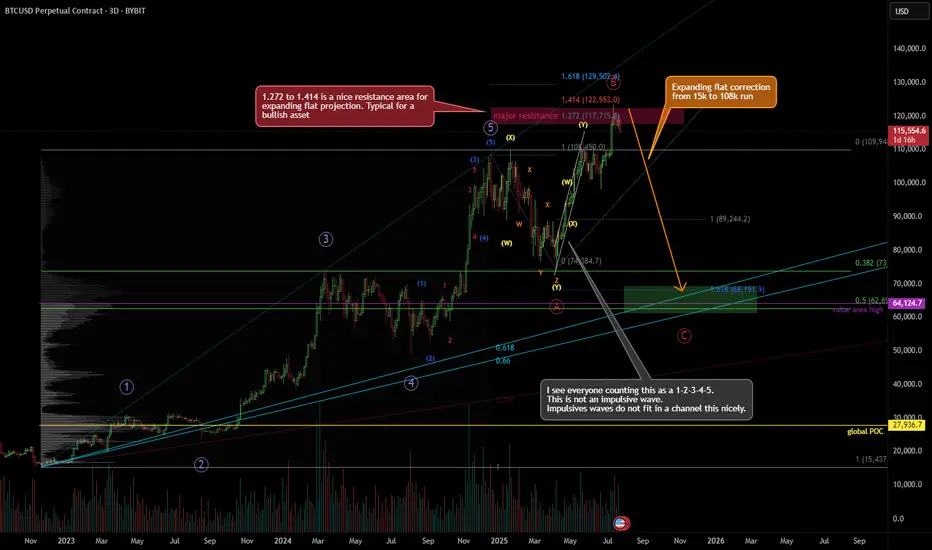
Looking for a correction, bearish Elliott Wave countThere's a probability that the Jan 25' high was the true 5-wave top, and not the Dec 24' top shown here, but because the price difference is barely 1%, the projections don't differ much.
I've long counted the April 25' to June 25' run as a very nice looking WXY. Almost perfect channel correction. A very bullish correction, sure, but still a correction.
And, we're forming an expanding flat from 109k region, down to 74k, then to 123k, and likely down to around 68k.
There's just too many confluences around 67-68k region.
(1) Huge volume node
(2) 1.618 fib projection
(3) 0.5 retracement from 15k to 109k run (2022-2025 run)
(4) Fib fan 0.618 to 0.66 (golden zone)
(5) Value area high of the 15k to 109k run
It's 7/25/25 as of posting this. Locally, in a 15min time-frame, I don't actually see this coming down right away. It's likely to spend few more weeks up here before it starts to make its movement.
NZDUSD: Free Trading Signal
NZDUSD
- Classic bullish setup
- Our team expects bullish continuation
SUGGESTED TRADE:
Swing Trade
Long NZDUSD
Entry Point - 0.6013
Stop Loss - 0.6004
Take Profit - 0.6028
Our Risk - 1%
Start protection of your profits from lower levels
Disclosure: I am part of Trade Nation's Influencer program and receive a monthly fee for using their TradingView charts in my analysis.
❤️ Please, support our work with like & comment! ❤️

EURJPY Technical Analysis! SELL!
My dear subscribers,
EURJPY looks like it will make a good move, and here are the details:
The market is trading on 173.19 pivot level.
Bias - Bearish
Technical Indicators: Both Super Trend & Pivot HL indicate a highly probable Bearish continuation.
Target - 172.73
About Used Indicators:
The average true range (ATR) plays an important role in 'Supertrend' as the indicator uses ATR to calculate its value. The ATR indicator signals the degree of price volatility.
Disclosure: I am part of Trade Nation's Influencer program and receive a monthly fee for using their TradingView charts in my analysis.
———————————
WISH YOU ALL LUCK

TA vs FA vs SA (Knowledge Sharing)In this video I shared about my knowledge of trading from my past experiences and how you can benefit from it too. I might be away for months soon, so I wish you guys luck.

BULLISH REVERSAL SIGNAL FROM 3,350 SUPPORTOn the 15-minute chart (M15), XAUUSD is showing early signs of recovery after a sharp decline that found support around the key 3,350 USD level. This area has been tested multiple times with increasing volume, suggesting potential buyer accumulation.
Technical Analysis: Downtrend Line: A descending trendline (yellow) from the July 23 high has acted as dynamic resistance. Price is now approaching this line again.
Fibonacci Retracement: The recent rebound from 3,350.11 to 3,373.52 shows key resistance zones at the 0.5 (3,361.82) and 0.618 (3,364.58) Fibonacci levels.
Volume Spike: Notable volume surges at the bottom suggest increased buyer interest near support.
Key Price Levels for Today: Technical Zone Role 3,350 – 3,353
Strong short-term support 3,361 – 3,365
Fibonacci 0.5–0.618 resistance 3,373.5
Previous swing high 3,400 – 3,434
Fibonacci 3.618 extension target
Trading Strategies: Scenario 1: Bullish Breakout Above Trendline Entry: Buy stop above 3,366 with increasing volume.
TP1: 3,373.5
TP2: 3,400
TP3: 3,434 (Fibonacci 3.618 extension)
SL: 3,348 (below recent low)
Scenario 2: Trendline Rejection – Bearish Continuation Entry: Sell limit at 3,364–3,366 if bearish pin bar / engulfing pattern appears
TP1: 3,350
TP2: 3,338
SL: 3,375
Additional Confirmation Signals: Closely watch price action near the trendline and Fibonacci zone (3,361–3,364).
RSI is not yet oversold, so a short-term technical rebound remains possible.
Conclusion: Gold is currently testing a significant support zone around 3,350 USD. If price successfully breaks above the descending trendline and holds, we may see a bullish impulse targeting as high as 3,434 USD. However, failure at this resistance may trigger another leg down.

GOLD The Target Is UP! BUY!
My dear followers,
I analysed this chart on GOLD and concluded the following:
The market is trading on 3354.1 pivot level.
Bias - Bullish
Technical Indicators: Both Super Trend & Pivot HL indicate a highly probable Bullish continuation.
Target - 3361.01
Safe Stop Loss - 3350.5
About Used Indicators:
A super-trend indicator is plotted on either above or below the closing price to signal a buy or sell. The indicator changes color, based on whether or not you should be buying. If the super-trend indicator moves below the closing price, the indicator turns green, and it signals an entry point or points to buy.
Disclosure: I am part of Trade Nation's Influencer program and receive a monthly fee for using their TradingView charts in my analysis.
———————————
WISH YOU ALL LUCK

the GOld in accomlate zone as its no t reash to 3200 there is two senarios:
1-XAUUSD under 3243 than its down toward 3300
2-XAUUSD above 3343 but under 3385 scalping.

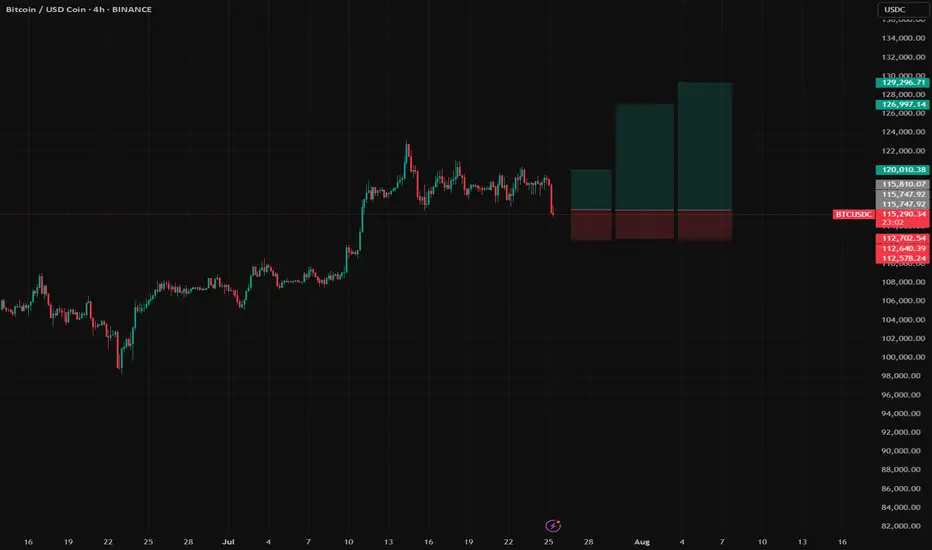
BTC Long Setup | Multi-target Swing Trade with Reasonable SL📝 Description:
Buy Bitcoin (BTC) based on continuation correction structure.
Entry: 115,800
Stop-Loss: 112,600
Risk: 1% per trade (position size adjusted accordingly, no leverage used trade spot only!)
🎯 Take-Profit Levels:
*Watch for a strong red candle at each TP zone.
If it happen, take full profit.
If not, let the position run and watch it again at the next target.
TP1: 120,000
TP2: 126,990
TP3: 129,296
RRR (Risk-Reward Ratio) across targets:
• TP1 = 1:1.3
• TP2 = 1:3.69
• TP3 = 1:4.36
Gold short opportunityGold completed its mini bull flag target and re-entered a micro rising channel, a potentially bearish structure.
With price now testing a key supply zone, we’re watching for rejection to initiate a short, targeting the major demand zone below.

Gold in Demand Zone | Target $3,380🚨 GOLD/USD – BIG MOVE LOADING! 🚨
🔍 Price is currently reacting from a major demand zone ($3,340–$3,345) with signs of accumulation and a possible double bottom pattern forming.
📉 After a strong downtrend, this looks like a liquidity sweep and smart money trap — prepping for a reversal back to the $3,380 resistance zone where liquidity resides.
📈 Scenarios to Watch:
1️⃣ Price sweeps support again and reverses hard
2️⃣ Clean structure break above $3,365, followed by a retest
🎯 Target: $3,380–$3,385
🛡️ Invalidation: Strong close below $3,335
⚠️ Confirmation Required! Best entry would be after structural break + retest. Keep your risk tight, and let the market show its hand.
⸻
📌 Key Levels:
• Support Zone: $3,340–$3,345
• Target Zone: $3,380–$3,385
• Invalidation: Below $3,335
⸻
📣 If this setup helps you, like 👍, comment 💬, and follow 🔔 for more high-probability ideas every week!
#Gold #XAUUSD #SmartMoney #LiquidityGrab #ForexSetup #PriceAction #BreakoutTrade #DoubleBottom #TradingView #GoldAnalysis #ForYou #FXStrategy #SupplyAndDemand

posting full SSThis post serves only to share the complete SS, which was not inadvertently included in the earlier post shared today.
Gold dips on profit-taking, long-term outlook still bullishGold prices continued to decline this morning as investors locked in profits following the precious metal’s recent rally above $3,400.
In the short term, further downside is possible if profit-taking persists and capital flows shift toward equities, especially as U.S. stock markets hover near record highs. However, gold remains a favored safe-haven asset for the long run amid ongoing global economic and geopolitical uncertainties.
Markets are also turning their focus to the upcoming Federal Reserve policy meeting on July 29–30. While the Fed is expected to hold interest rates steady this time, many investors still anticipate a potential rate cut in September. A low interest rate environment typically supports non-yielding assets like gold.

ELLIOTT WAVE EURUSD H4 update
EW Trade Set Up H4
subminuette W4 seems finished
monitor the breakout of the descending channel that appears to contain wave IV
The bullish movement that started on July 17th must assume a 5-wave pattern
key levels (area)
1.1705
1.1684 POC
1.1654
note :
the breakout upwards of the leading span B (red line) by the lagging span (green line) will confirm the start of a bullish movement in the subminuette wave v.
Failure to break above price levels 1.1684 and 1.1705 will result in a recalculation of the waves count

Xiaomi probably “bottomed” as China most major stocks. 8/Nov/22Xiaomi’s share price probably found its long term base with double bottom pattern at support zone.

BTCUSD Sell Plan – 1H Chart📉 BTCUSD Sell Plan – 1H Chart
Previous Day High (PDH) has been swept.
A Bearish Fair Value Gap (FVG) has already formed on the H4 timeframe, signaling potential reversal.
Price has been struggling to push higher for several days, indicating exhaustion in bullish momentum.
A Weekly Bullish FVG lies below, acting as a strong magnet—drawing price toward it.
If a pullback occurs, there’s no need to panic. It’s just the market seeking fresh liquidity.
Liquidity is sitting below, making it a high-probability area for the next move down.
🧲 Let the magnet do its job.
