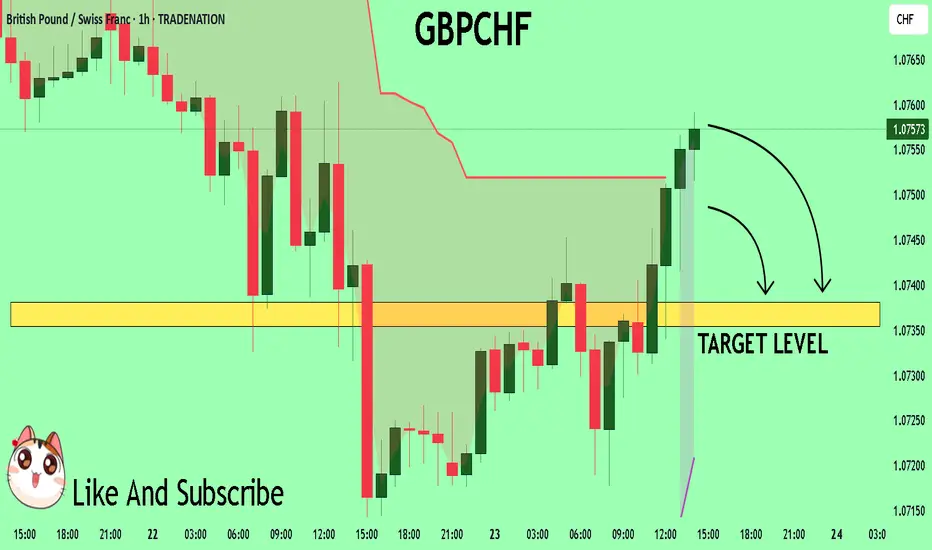
GBPCHF My Opinion! SELL!
My dear followers,
I analysed this chart on GBPCHFand concluded the following:
The market is trading on 1.0756 pivot level.
Bias - Bearish
Technical Indicators: Both Super Trend & Pivot HL indicate a highly probable Bearish continuation.
Target - 1.0738
About Used Indicators:
A super-trend indicator is plotted on either above or below the closing price to signal a buy or sell. The indicator changes color, based on whether or not you should be buying. If the super-trend indicator moves below the closing price, the indicator turns green, and it signals an entry point or points to buy.
Disclosure: I am part of Trade Nation's Influencer program and receive a monthly fee for using their TradingView charts in my analysis.
———————————
WISH YOU ALL LUCK
Wave Analysis
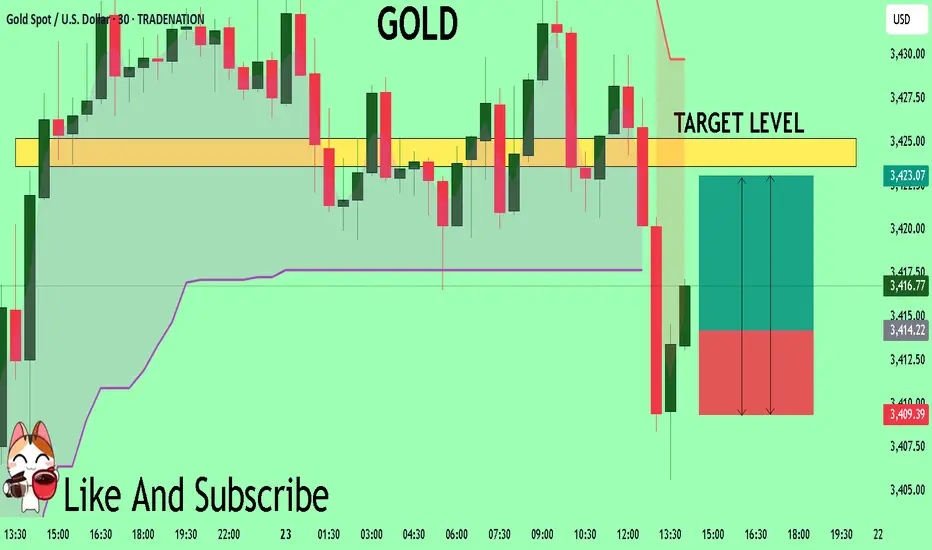
GOLD The Target Is UP! BUY!
My dear friends,
Please, find my technical outlook for GOLD below:
The price is coiling around a solid key level - 3414.2
Bias - Bullish
Technical Indicators: Pivot Points Low anticipates a potential price reversal.
Super trend shows a clear buy, giving a perfect indicators' convergence.
Goal - 3423.6
Safe Stop Loss - 3409.3
About Used Indicators:
The pivot point itself is simply the average of the high, low and closing prices from the previous trading day.
Disclosure: I am part of Trade Nation's Influencer program and receive a monthly fee for using their TradingView charts in my analysis.
———————————
WISH YOU ALL LUCK

More confirmation!Classic ABCDE pattern has formed. Is this the catalyst we've been waiting for to spark the next aggressive leg up?

XAUUSD: Market analysis and strategy on July 22.Gold technical analysis
Daily chart resistance level 3450, support level 3330
Four-hour chart resistance level 3420, support level 3375
One-hour chart resistance level 3402, support level 3375.
Gold rose sharply on Monday, fluctuated upward in the Asian session, and the NY market accelerated its rise, with the daily line rising sharply to 3400. The fundamentals of the bull market have not changed, and this time it is believed that the factor that triggered the unilateral rise is the expectation of the Fed's interest rate cut. Yesterday I mentioned that the 1-hour bottom structure appeared, and a new bullish opportunity appeared again!
Yesterday's idea was very clear. The Asian session stepped back to confirm the top and bottom conversion support level of 3344, and finally the NY market rose sharply, directly breaking through the key position of 3377.
Gold price stood firm at 3360, preparing to break through the key position of 3377 and then accelerate its rise. Yesterday's increase broke through the highest level in the past month. After all, the strength after the breakout after such a long period of volatility will not be small. In the previous few trading days, it returned to the previous high to complete the conversion of top and bottom. Today, pay attention to the support of the top and bottom conversion position of 3377. If it falls back during the day, you can continue to buy on dips based on the support of 3375. The bulls are accumulating momentum to break through the suppression of the 3400 mark. If it stands firm at 3400 after the breakthrough, it will be a large-scale increase.
In terms of intraday operations, buy more near 3377/75 after the retracement.
Buy: 3375 near
Buy: 3402near

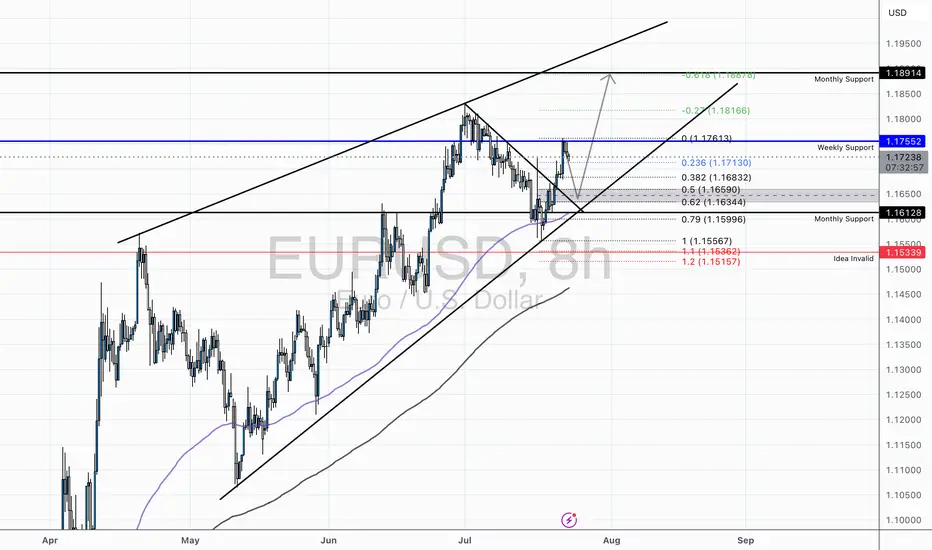
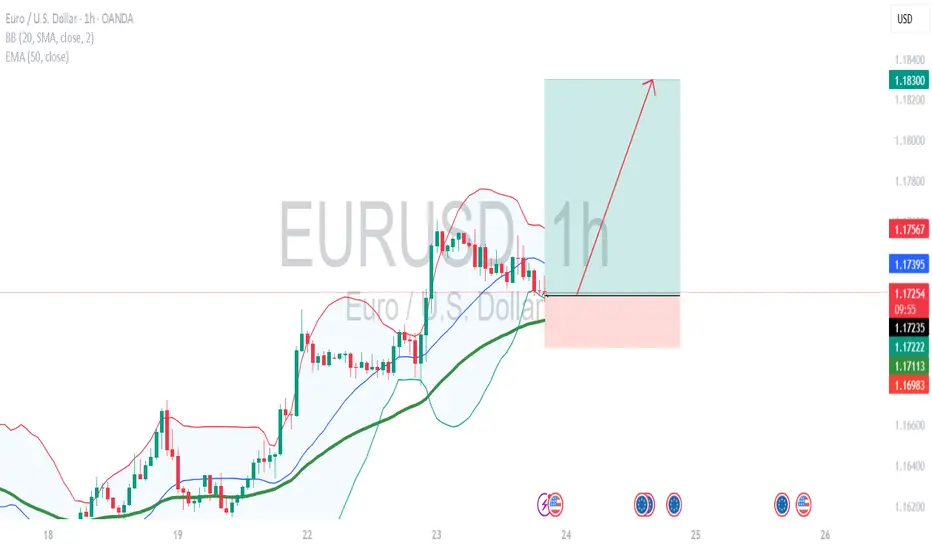
EUR/USD - Holding Bullish Structure Above Key Fibs and TrendlineTechnical Overview:
EUR/USD continues to respect its ascending channel structure, currently rebounding from the lower trendline support while trading above the 50 EMA and 200 EMA. After a healthy retracement to the monthly support (1.16128), the pair has shown strong buying interest, supported by bullish RSI divergence from oversold conditions on the 8H chart.
Key Levels:
Support Zone: 1.1613 – 1.1634 (Fib Cluster + Channel Support + Monthly Support)
Resistance Zone: 1.1755 (Weekly Resistance) followed by 1.1816 (0.27 Fib Extension) and 1.1887 (0.618 Extension)
Invalidation Level: Below 1.1533 (1.272 Fib + Structural Breakdown)
Confluences:
Price broke above a descending correctional trendline, indicating a potential bullish continuation.
Multiple Fibonacci levels (0.382, 0.5, 0.618) have stacked around the previous consolidation area, increasing probability of a sustained move.
RSI bounce from below 40 suggests short-term momentum reversal.
Trade Idea:
We may see a minor pullback into the 1.16344–1.1659 area before a potential continuation higher. Conservative bulls may wait for a retest of this zone with a bullish engulfing or pin bar confirmation before entering long.
Targets:
First target at 1.1755 (prior weekly resistance)
Second target at 1.1816 (Fib extension)
Final target near 1.1887 (major resistance / upper channel boundary)
Risk Management:
A break and close below 1.1533 would invalidate the bullish setup and signal potential bearish pressure returning to the pair.
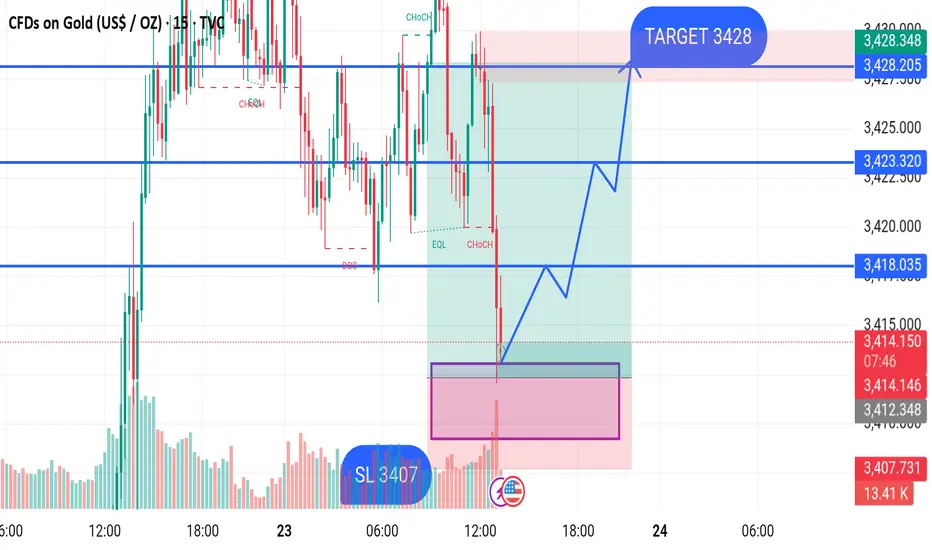
GOLD BUY M15 Gold (XAUUSD) Analysis – 15-Minute Timeframe
Price has recently shown a strong bearish move after a CHoCH (Change of Character) confirmation. The market has entered a demand zone (highlighted in pink), where a potential bullish reversal is expected.
Entry Zone: Around 3407–3408 level (within the demand area)
Stop Loss (SL): 3407 (just below the demand zone)
Target: 3428 (major resistance and supply zone)
The expected move shows price reacting from the demand zone, forming higher highs and higher lows, with bullish confirmation. If price holds above the 3407 level, buyers may take control and push price toward the 3428 target.
Key Levels:
Demand Zone: 3407 – 3408
Support Level: 3418.035
Resistance Levels: 3423.320 and Final Target 3428
DXY, EURUSD & USDJPY Daily Trade SetupsIn this update we review the recent price action in the Dollar Index, Euro & Yen and identify the next high-probability trading opportunities and price objectives to target. To review today's video analysis, click here!

EURUSD bullish trend continuationDaily candle closed with strong bullish.
a healthy pullback observed earlier today during Asian & Europe session.
I'm expecting a bullish movement in US session.
i'm buying at current market price.
calculate your own risk & reward.
Good Luck
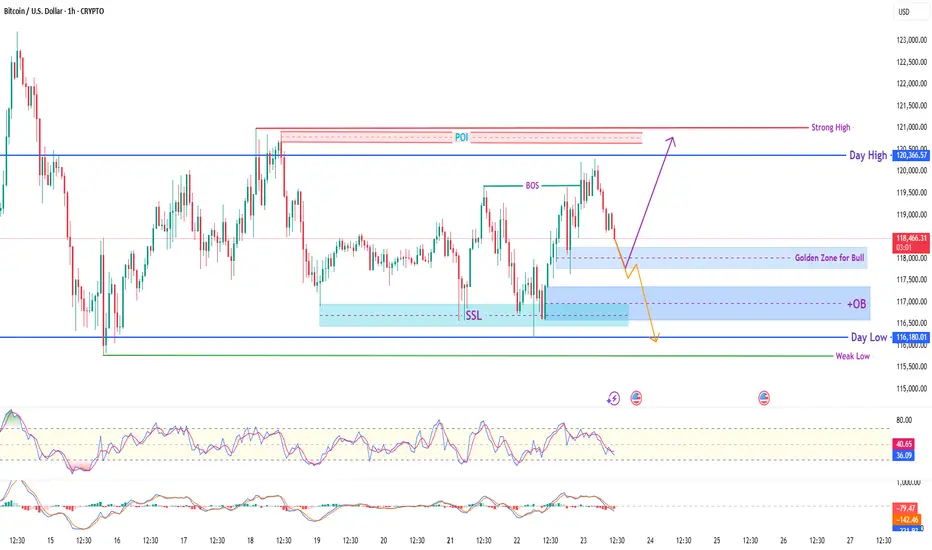
BTC/USD Smart Money Concept (SMC) Analysis – 1H TimeframeThis BTC/USD analysis is based on pure Smart Money Concepts. After a clean Sell-Side Liquidity (SSL) sweep and a strong Break of Structure (BOS), the market is retracing into a high-probability Bullish Reversal Zone.
📍 Trade Plan (Buy Setup):
🔹 Entry Zone:
116,800 – 116,200
(OB + Golden Zone + FVG confluence)
🔹 Stop Loss (SL):
Below 115,800
(Under Weak Low to avoid liquidity trap)
🔹 Take Profits (TP):
✅ TP1: 118,500 (Partial profit + BE move)
✅ TP2: 120,366 (Day High)
✅ TP3: 121,200 (Above Strong High / POI Liquidity Grab)
🧠 Key SMC Elements in Play:
✅ BOS Confirmed
✅ SSL Taken Out (Liquidity Sweep)
✅ OB + FVG Overlap (Refinement Zone)
✅ Golden Reversal Zone
✅ Day High & Strong High Liquidity Above
This setup reflects Smart Money behavior — liquidity grab followed by structural shift and pullback to premium OB/FVG zone for re-accumulation.
Watch for bullish price action confirmation (like bullish engulfing, internal BOS, or lower timeframe CHoCH) before executing the entry.
⚠️ Disclaimer:
This analysis is for educational purposes only. Please trade responsibly with proper risk management. Do not consider this financial advice.
📊 #BTCUSD #SmartMoneyConcepts #OrderBlock #LiquiditySweep #TradingStrategy #PriceAction #CryptoTrading #TradingViewAnalysis #SMC #FVG #TechnicalAnalysis
GBP/JPY 4H - Rejection from Supply Zone and Key Fib AreaOverview:
GBP/JPY is trading near 197.91, and recent price action suggests a potential short opportunity. The pair has been rejected from a key Fibonacci resistance zone, and bearish momentum appears to be building beneath a fading ascending channel. Let’s break down why this chart leans more bearish.
Market Structure Breakdown:
* Price action failed to sustain new highs above 199.90 and is now forming lower highs, a potential early sign of trend exhaustion.
* The recent bounce from 197.40 was muted and rejected near the 0.5 and 0.618 retracement levels, indicating strong supply around the 198.68–198.98 zone.
Fibonacci Confluence:
* The rejection occurred right at the 0.618 retracement of the prior downswing — a key Fibonacci level often used by institutional traders to re-enter in the direction of the trend.
* Price is now hovering below the 0.382 (198.38) and 0.5 (198.68) levels, which may now act as resistance.
* If the current rejection holds, downside targets are:
* 0.0 (197.40) – recent low
* -0.27 extension (196.70) – potential bearish continuation target
* -0.618 extension (195.81) – extended downside objective
Trendline & Channel Considerations:
* The ascending channel is losing momentum.
Moving Averages:
* Price is now below the 50 EMA, and testing the 200 EMA, which is at risk of breaking.
* A clear close below both EMAs would confirm bearish momentum.
RSI & Momentum:
* The RSI shows bearish divergence on recent highs and is struggling to break above the midline (50).
* Momentum is tilting to the downside and failing to build higher on bounces.
Key Zones:
* Resistance Zone: 198.60–198.98
* Strong Fibonacci confluence + previous supply
* Support Zone: 197.40
* Prior swing low and 0.0 Fib level
* Bearish Continuation Zone: Below 197.30
* Breakout would confirm downside acceleration toward 196.70 and 195.80
Conclusion:
GBP/JPY is showing signs of bearish pressure beneath key resistance. With the rejection from the 0.618 Fib level and weakening channel structure, the path of least resistance may be to the downside — especially if price breaks and holds below 197.40.
A confirmed breakdown opens the door toward 196.70 and possibly 195.80, as bearish continuation unfolds. Overall we can even see price hitting past historical levels at 189.50

Fiserv Falling Knife TradeLooks like Fiserv is entering an area of interest. I will SLOWLY start an accumulation here between $125 - $136 for my first buy and looking to lower levels to add more aggressively.
A vicious ABC correction and we are currently sitting on on the 0.786 Fib. If this fails to hold, we have a monthly and weekly level of support below. If this fails, it could head down to $100.
Not financial advice, do what's best for you.

MRPLMangalore Refinery and Petrochemicals Ltd. is a subsidiary of ONGC and operates a state-of-the-art petroleum refinery in Karnataka, processing a wide range of crude grades to produce value-added petroleum products. It caters to domestic and export markets through refined fuels, petrochemicals, and specialty products. The stock is currently trading at ₹155.89.
Mangalore Refinery and Petrochemicals Ltd. – FY22–FY25 Snapshot
Sales – ₹83,556 Cr → ₹87,218 Cr → ₹89,744 Cr → ₹91,880 Cr – Topline remains stable with high crude volumes
Net Profit – ₹2,222 Cr → ₹2,068 Cr → ₹2,420 Cr → ₹2,655 Cr – Strong bottom-line driven by GRM and cost cuts
Company Order Book – Moderate → Strong → Strong → Strong – Sustained procurement cycle and export contracts
Dividend Yield (%) – 1.12% → 1.23% → 1.31% → 1.38% – Steady payouts supported by cash flow visibility
Operating Performance – Moderate → Strong → Strong → Strong – Higher capacity utilization and blended margins
Equity Capital – ₹1,752.68 Cr (constant) – No dilution
Total Debt – ₹10,222 Cr → ₹9,780 Cr → ₹9,340 Cr → ₹8,960 Cr – Deleveraging trend aligned to profitability
Total Liabilities – ₹18,400 Cr → ₹19,150 Cr → ₹19,850 Cr → ₹20,520 Cr – Stable liability expansion with crude cost
Fixed Assets – ₹5,980 Cr → ₹6,270 Cr → ₹6,560 Cr → ₹6,850 Cr – Gradual capex for emission norms and refining upgrades
Latest Highlights FY25 net profit grew 9.7% YoY to ₹2,655 Cr; revenue rose 2.4% to ₹91,880 Cr EPS: ₹15.15 | EBITDA Margin: 11.8% | Net Margin: 2.89% Return on Equity: 14.36% | Return on Assets: 9.63% Promoter holding: 88.58% | Dividend Yield: 1.38% Complex refinery product mix helped optimize GRMs during volatile crude cycles Strength in petrochemicals and export demand boosted margin stability
Institutional Interest & Ownership Trends Promoter holding remains dominant at 88.58% via ONGC, with no pledging or dilution. FII interest is muted given PSU profile, while domestic institutions maintain stable exposure. Volume data reflects rotational interest from value-oriented fund desks and government-linked mandates.
Business Growth Verdict Yes, MRPL is maintaining strong financial metrics despite macro volatility Margins supported by efficient refining and blended product strategy Debt trajectory is improving with strong operating cash flows Capex remains focused and strategically aligned to long-term energy goals
Company Guidance Management expects stable revenue and GRM levels in FY26, supported by improved plant utilization, export momentum, and diversification into petrochemical derivatives.
Final Investment Verdict Mangalore Refinery and Petrochemicals Ltd. offers a steady play in India’s refining and energy infrastructure vertical. As a PSU subsidiary with consistent cash flows, balanced profitability, and strategic expansion into petrochemicals, the company is positioned for long-term value delivery. Its operational discipline and blend of domestic and export markets make it suitable for accumulation by investors focused on energy-linked stability.
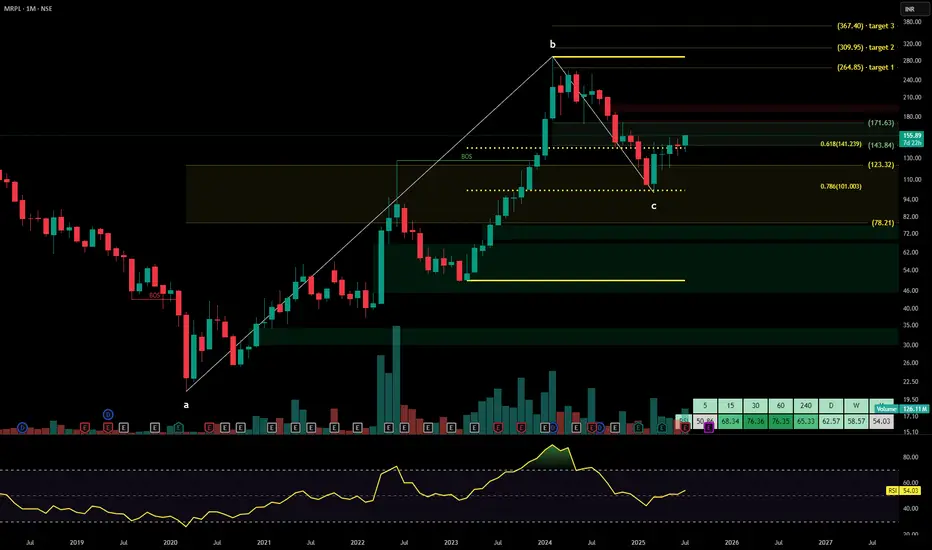
Correction over? Worth keeping an eye on itIs this the end of the final 5th wave? It’s hard to tell. This stock has been a disaster for those trying to pick bottoms. I’m waiting for a sign of strength before jumping in. We may be seeing that as the RSI is slowly gaining strength.
Personally I’d like to see it change market structure and take out some resistance levels to the upside.
Keeping an eye on this before I pull the trigger.

TRXUSDT Long SwingBINANCE:TRXUSDT Long Swing Trade, with my back testing of this strategy, it hits multiple possible take profits, manage your position accordingly.
This is good trade, don't overload your risk like greedy, be disciplined trader.
I manage trade on daily basis.
Use proper risk management
Looks like good trade.
Lets monitor.
Use proper risk management.
Disclaimer: only idea, not advice

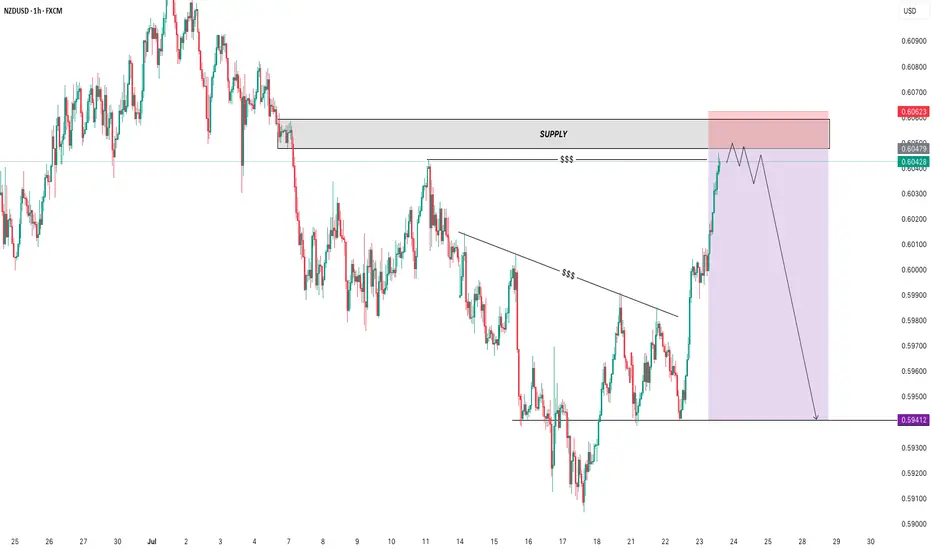
NZDUSD Short SwingOANDA:NZDUSD Short Swing Trade, with my back testing of this strategy, it hits multiple possible take profits, manage your position accordingly.
This is good trade, don't overload your risk like greedy, be disciplined trader.
I manage trade on daily basis.
this is good trade, lets see, don't be greedy, risk what you can afford.
Use proper risk management
Looks like good trade.
Lets monitor.
Use proper risk management.
Disclaimer: only idea, not advice

$BTC / Bitcoin Update - The Bitcoin Awakes? 7/23Hello fellow gamblers,
BTC price action has probably pissed off a lot of you, but I believe we are getting close to a breakout.
If my theory is correct, we are forming a wyckoff re-accumulation pattern that will give us an explosive move towards ATH.
- Right now will be a great buying opportunity for those with those that have nothing to lose(super risky entry), but I am suspecting that we formed a spring and the breakout happens next.
- The pattern is still valid as long as we stay above 116k.
- If we lose 116k, we will go towards 110k.
- Levels to watch: 116.7k, 117.9k, 120.3k, 123.2k

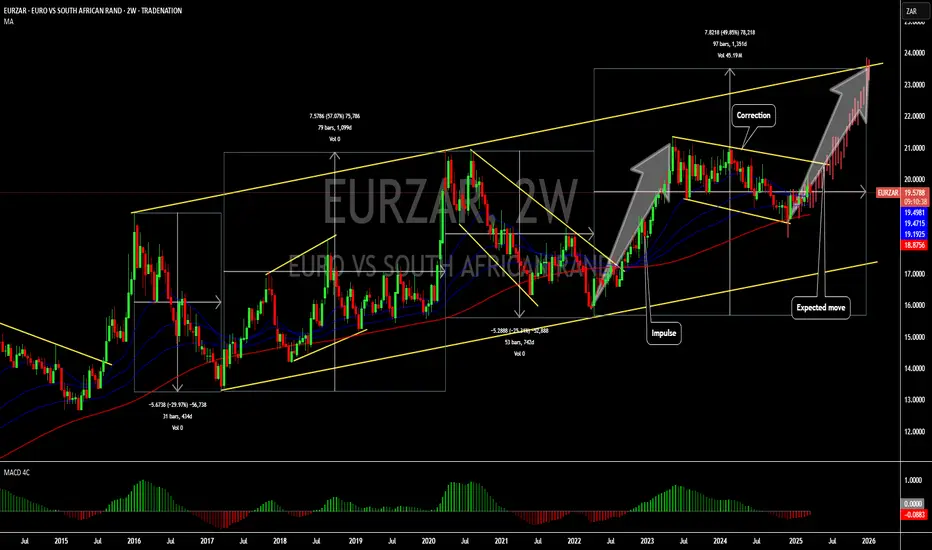
Buy opportunity on the EURZARHello,
A potential buying opportunity is emerging on the EUR/ZAR weekly chart. The pair is trading within a well-defined rising channel, where it has completed a strong impulse wave (April 2022 – May 2023) and is currently in a corrective phase.
With the correction seemingly reaching exhaustion, we anticipate a resumption of the uptrend, presenting a medium-to-long-term bullish opportunity from current levels. Additionally, the MACD zero-line crossover reinforces this setup, signaling a shift in momentum towards the upside.
Disclosure: I am part of Trade Nation's Influencer program and receive a monthly fee for using their TradingView charts in my analysis.
POWR/USDT IDEAPair: POWR/USDT
Timeframe: 8H
Structure: Descending trendline breakout watch
POWR has been moving within a broad descending structure and is now testing the upper trendline with price pushing into the resistance zone around 0.2000. Momentum is building as it tries to break out of the prolonged downtrend.
Bullish case:
A confirmed breakout above 0.2050 with strong volume could trigger continuation to the upside. If that happens, the next upside levels to watch are 0.2300 and 0.2600. Look for a retest of the breakout level for a safer entry.
Bearish case:
If POWR fails to sustain above 0.2000 and drops back under 0.1800, we might see selling pressure resume with targets back toward 0.1600 and 0.1500.
Price is at a critical decision point. Wait for clear breakout confirmation before taking a position. Set alerts and monitor volume closely.

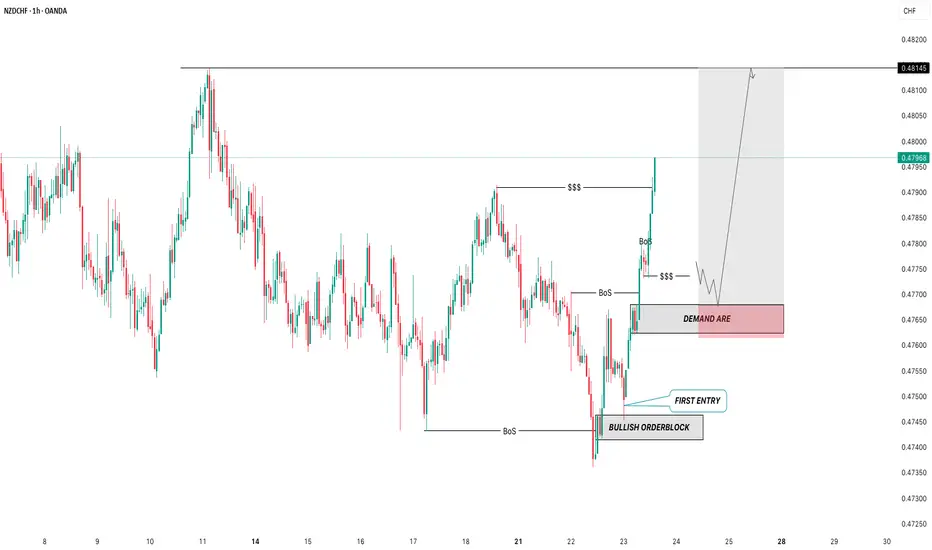
BUY LIMIT FOR NZDCHF Title: NZDCHF - Potential Long Opportunity - 30-Minute
Description: "NZDCHF on the 30-minute timeframe is currently exhibiting choppy price action. The recent selling pressure is likely influenced by the CHF's safe-haven status. However, I am anticipating a potential bullish move.
Entry: I will consider entering a long position if the price breaks above a key resistance level at . Stop-Loss: Place a stop-loss order below the recent swing low at . Take-Profit: Target a take-profit level at , considering the next resistance level. Rationale: Despite the short-term selling pressure, the potential for a bullish reversal exists. The CHF's safe-haven status may be temporarily overshadowing the underlying strength of the NZD. A break above the resistance level would confirm the bullish bias
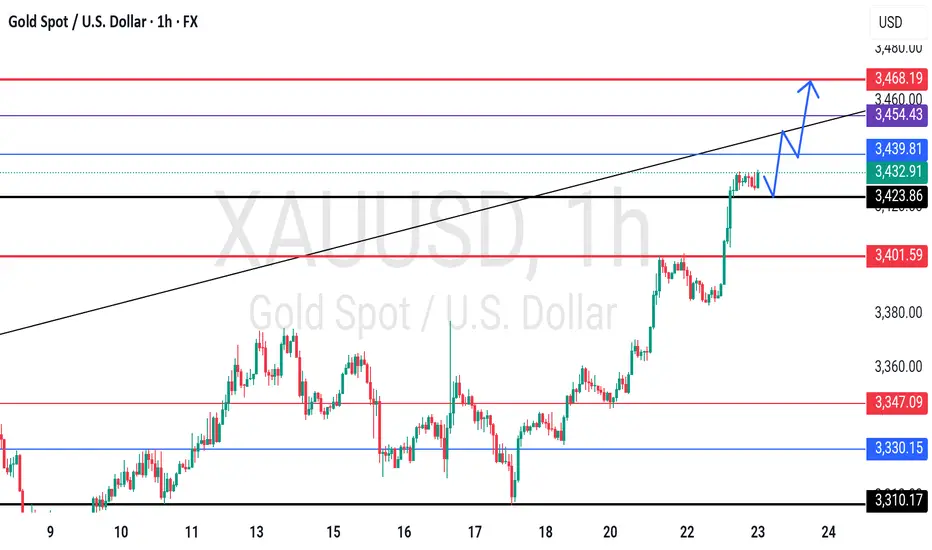
GOLD - single supporting area, further bounce??#GOLD - market perfectly moveed as per our video analysis and above our cut n reverse area as well.
Now market have single supporting area, tha tia around 3423-24
Keep close it and if market hold it then upside further bounce expected.
Good luck
Trade wisely
SELL NZDUSD SELL NZDUSD , without negleting the power of barish movement in NZDUSD the market has managed to make a maium retst towards a POI with liquidty swap where i expect the market to tur into a very shapbearish movement
remember to manage ur trades , use proper risk management and good luck family
AUDJPY Long TradeOANDA:AUDJPY Long Trade.
Entry price is already tapped in, I checked chart late, TP is intact, you can take little risk if you can afford.
Note: Manage your risk yourself, its risky trade, see how much your can risk yourself on this trade.
Don't be greedy.
Use proper risk management
Looks like good trade.
Lets monitor.
Use proper risk management.
Disclaimer: only idea, not advice
