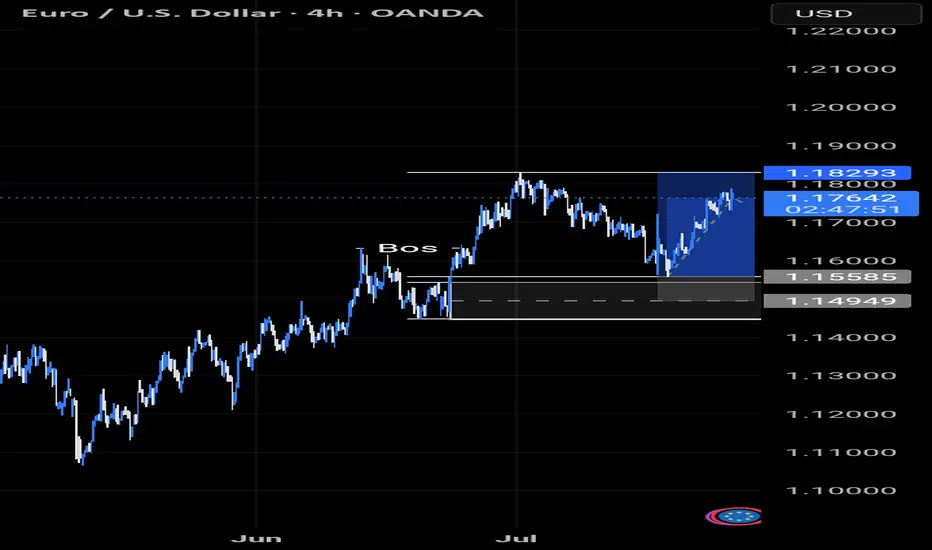
EURUSD Massive Bullish Breakout!
HI,Traders !
#EURUSD is trading in a strong
Uptrend and the price just
Made a massive bullish
Breakout of the falling
Resistance line and the
Breakout is confirmed
So after a potential pullback
We will be expecting a
Further bullish continuation !
Comment and subscribe to help us grow !
Wave Analysis

$BTCUSD bullish short term before Intermediary Wave 1 pullbackSupercycle (years): Wave (III)
Cycle (months): Wave III
Primary (weeks): Wave ((3))
Intermediate (days): Wave (1)
Minor (4H): Wave 5
Looks bullish in the short term.
Let's Go!

Nike - This is the bottom!💉Nike ( NYSE:NKE ) creates the bottom now:
🔎Analysis summary:
More than four years ago, Nike created its previous all time high. We have been witnessing a downtrend ever since and a correction of about -70%. But with the recent retest of an important horizontal structure and bullish confirmation, Nike is about to create a potential bottom.
📝Levels to watch:
$65, $80
🙏🏻#LONGTERMVISION
Philip - Swing Trader

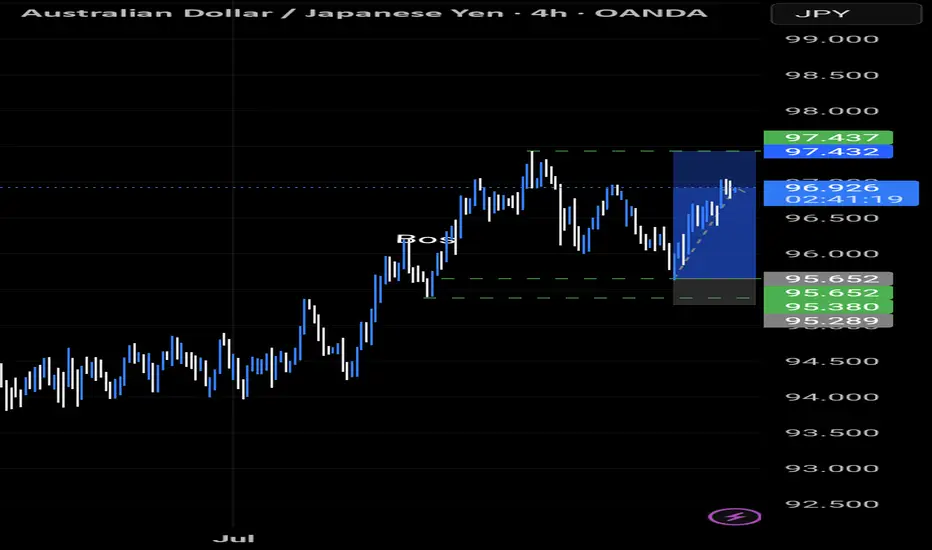
AUDJPY TRADE IDEA AUDJPY traded down to our Fibonacci level and has done it's thing to the upside....
EURUSD BUY SETUPFOLLOW THE PRICE WILL GO UP
BECAUSE WE HAVE PATTERN ON 5 M
WE have strong candle on frame 4h

XAUUSD SHORTAbsolutely. Here's your idea written in a **professional TradingView signal format**, ready for publishing as a powerful technical setup:
---
## 🟡 **GOLD (XAUUSD) – SELL SETUP BASED ON ELLIOTT + WOLFE WAVE**
🔔 **LegendFX Pro Idea | High-Confidence Reversal Pattern**
---
### 🧠 **Technical Confluence**:
We are combining two advanced price action concepts:
* ✅ **Elliott Wave (A–B–C)** correction structure
* ✅ **Wolfe Wave** bearish pattern with a perfect point 5 trap and wedge break
Wave B has completed near the top of a rising wedge (point 5 of Wolfe), and the breakdown has started. RSI is showing exhaustion and confirms bearish divergence.
---
### 🟠 **SELL TRADE PLAN:**
* 🔹 **Entry #1 (Aggressive):**
`3372.00 – 3377.00`
→ Zone of Wave B completion and Wolfe point 5
* 🔹 **Entry #2 (Confirmed):**
`Break below 3355`
→ Requires H4 or H1 candle close below to confirm structure break
* 🔴 **Stop Loss:** `3395.00` (above invalidation wick)
---
### 🎯 **Profit Targets:**
| 🎯 Target | Level | Reason |
| --------- | --------- | ----------------------------------------- |
| TP1 | `3300.00` | Prior structure level |
| TP2 | `3241.00` | Wolfe Wave target (Line from Point 1 → 4) |
| TP3 | `3180.00` | 1.618 Fibonacci extension of Wave C |
---
### 📌 **Confirmation Factors:**
* ✅ Rising wedge break (Wolfe structure complete)
* ✅ Wave B completed with 5 sub-waves
* ✅ RSI bearish divergence + overbought exhaustion
* ✅ Liquidity taken from top (Buy-side swept)
---
### 📛 **Invalidation:**
If price closes above `3395.00`, the bearish structure is invalidated.
---
📢 **Follow for more institutional-grade setups and automated tools by LegendFX AI.**
📍 Script version available soon: `LegendFX Wolfe + Elliott Engine (Smart Signals)`

NZD-CHF Local Bearish Bias! Sell!
Hello,Traders!
NZD-CHF made a retest of
The horizontal resistance
of 0.4810 so we are locally
Bearish biased and we
Will be expecting a
Further bearish move down
Sell!
Comment and subscribe to help us grow!
Check out other forecasts below too!
Disclosure: I am part of Trade Nation's Influencer program and receive a monthly fee for using their TradingView charts in my analysis.

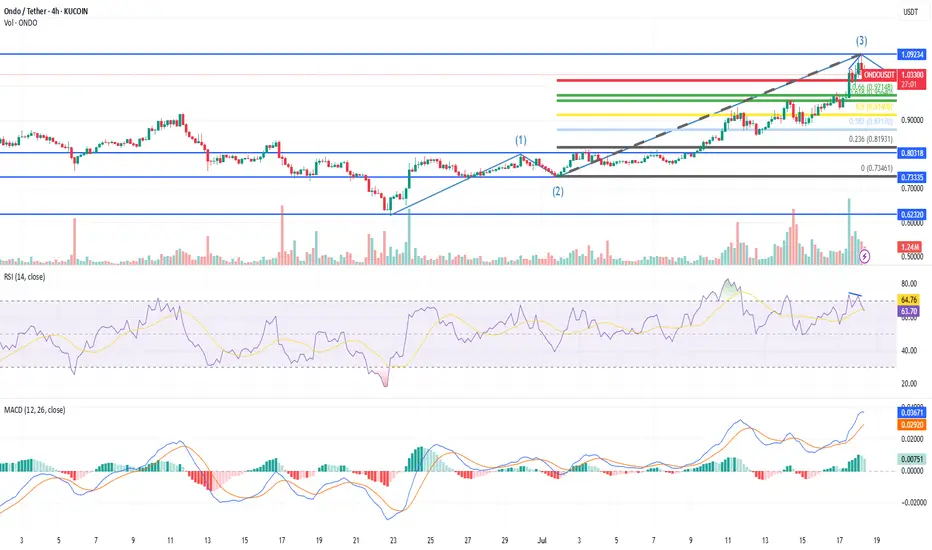
ONDO Elliott Wave AnalysisHi everyone! 👋
I want to share my current ONDO/USDT count on the 4H chart to get feedback from more experienced traders. Any comments, corrections, or tips are very welcome!
🟦 Where I started counting:
Wave (1): Started from around $0.62320 and topped at $0.80318
Wave (2): Retraced to $0.73807, around 36% of Wave 1 — quick and sharp, likely a zigzag
✅ So far, Wave 2 seems shallow and impulsive, which sets up for alternation in Wave 4.
🟩 Wave (3) development:
Wave 3 moved from $0.80318 → $1.09251
Strong volume and price action — fits well with what Elliott Theory defines as a powerful third wave
Wave 3 extension = about 1.6x Wave 1 — matches guidelines
📌 Based on this, I’ve marked Wave (3) completed at $1.09251
🟨 Now: Wave (4) Correction Zone
According to the Elliott Wave alternation rule:
Since Wave 2 was shallow and sharp, Wave 4 is expected to be deeper and more sideways. But BTC ATH bull run panic and hype all can change.
Here are the key retracement zones I’m watching for Wave 4:
| Retracement | Level | Meaning |
| ----------------- | --------------------- | -------------------------------------- |
| **0.382** | $0.98296 | Minor pullback, strong trend continues |
| **0.5** | $0.94884 | Common zone |
| **0.618** | $0.91472 | Deep but acceptable |
| ❌ Below $0.80318 | Invalidates structure | |
🟥 Wave (5) Projection:
Assuming Wave 4 ends shallow or deep, here are potential Wave 5 targets:
| Wave 4 End Price | TP1 (0.618 ext) | TP2 (1.0 ext) | TP3 (1.618 ext) |
| ---------------- | --------------- | ------------- | --------------- |
| \$1.09234 | **\$1.203** | \$1.272 | \$1.382 |
| \$1.04233 | **\$1.153** | \$1.222 | \$1.332 |
I’ll be watching RSI/MACD and volume to confirm when Wave 4 ends before entering Wave 5.
🙏 Open to Feedback!
I’m still learning and really enjoying Elliott Wave theory, so I’d love to hear from the TradingView community:
Do the waves look valid to you?
Would you count this any differently?
Any tips on catching the reversal of Wave 4?
Is the Wave 2 structure truly a zigzag, or am I missing something?
Thanks for reading — and I appreciate any support, corrections, or insights you can share. 📈💬
Let’s learn together!
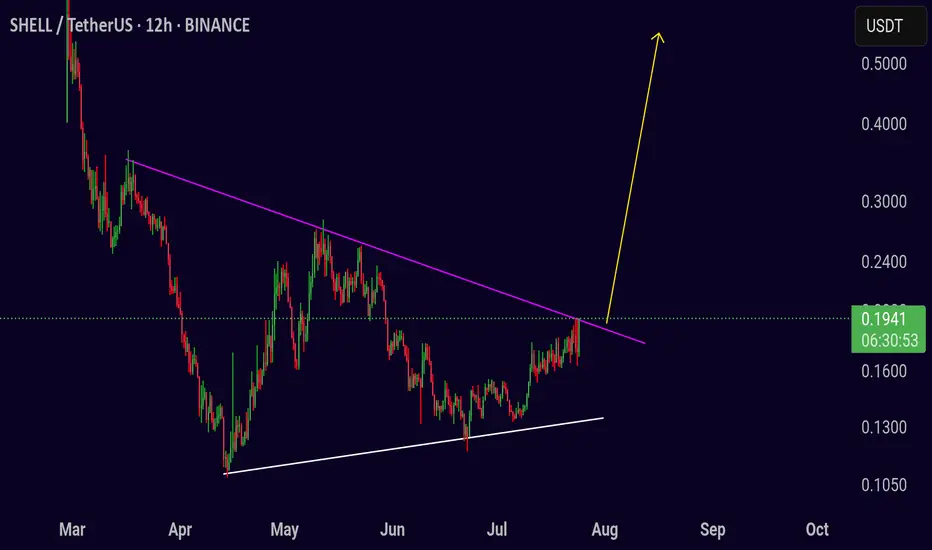
Trading Opportunity For ShellusdtTrading Setup:
A trading signal is seen in the SHELL/USDT pair (12h).
Traders can look for a breakout entry as price is approaching a key resistance level on the chart.
⬆️ Buy now or Buy on 0.1900
🛑 SL @ 0.1500
🔵 TP1 @ 0.2800
🔵 TP2 @ 0.4000
🔵 TP3 @ 0.5000
What are these signals based on?
Classical Technical Analysis
Price Action and Trendline Breakout
RSI, Moving Averages, Volume
Risk Warning
Trading crypto, futures, and CFDs involves a risk of loss. Please consider carefully if such trading is appropriate for you. Past performance is not indicative of future results.
If you liked our ideas, please support us with your 👍 and comments.
ETHEREUM: THE NEW BOND OF THE DIGITAL WORLDPrice isn’t the goal. Price is the side effect.
Meanwhile, BlackRock - a black hole with a trust-backed logo - just absorbed 42,000 ETH more.
Yesterday, you may have read this "regular" headline:
BlackRock increases its Ethereum exposure to $4 billion, adding $109.5 million via ETFs.
But here’s what you missed: there are no random numbers on the market.
When a player like this moves - it’s not hype. It’s a blueprint for the future.
Ethereum is no longer an altcoin.
It’s no longer speculation. It’s a financial infrastructure, already recognized by law, exchanges, and institutions.
What does this mean?
💡 Ethereum is now a digital bond - with yield flowing from blocks.
Profit is no longer built on promises, but on the structure of the chain itself.
Trust lies not in faces, but in code.
Growth is not artificial — it’s architectural.
And here’s why this is terrifyingly beautiful:
While you sleep, they are building an era.
Each ETF purchase removes ETH from circulation - permanently. Because:
✅ This ETH is gone from the open market
✅ It won’t be panic-sold
✅ It becomes income-bearing collateral, not a speculative asset
Still waiting for an entry signal?
The big players are already in.
This is no longer crypto - this is cash flow infrastructure, embedded into the digital economy.
And when pension funds, insurers, and sovereign investors move into Ethereum - they will come via ETFs.
Not because it’s trendy, but because it’s regulated, stable, and profitable.
📉 When institutional demand meets vanishing supply - the price won’t simply rise. It will explode, not as growth, but as a structural liquidity shift.
Ethereum is:
💸 Staking = passive yield
🔗 Backbone of DeFi
🖼 Fuel for NFTs
⚙️ Millions of transactions per second
⚖️ A regulated ETF asset
This is the new digital bond system, where the bet isn’t on the dollar - it’s on ETH as an income-producing asset.
💥 While you're reading this, the game is already on.
ETFs are rewriting the rules of time-ownership.
No hype. Just filings. Just intention.
Best regards EXCAVO

It's an Evacuation Through Green Candles💥 "One Last Leap of Faith?" - What Bitcoin Might Be Hiding Before September
The world’s on fire: Israel, Iran, Strait of Hormuz, oil, elections, the dollar, rates, black swan whispers.
And someone’s out here saying Bitcoin might still go up?
Yes. We are. Not because we believe - but because we see.
📉 Everyone’s afraid. The whales aren’t.
When the crowd goes into survival mode, the real game begins.
Whales aren’t exiting - they’re accumulating.
ETFs aren’t pausing - they’re inflowing.
The technical setup isn’t breaking - it’s compressing like a spring.
$104,000. Coil building.
If we break out - targets at $132K–$140K are absolutely in play.
👉 But that’s not the point.
The point is why this is happening while the world is burning.
🧠 The idea: Bitcoin isn’t a safe haven. It’s a distribution machine.
Gold is for panic.
Bitcoin is for structure.
Institutions don’t ask “is it scary?” - they ask “where’s liquidity?”
Everything is aligning for one last upside move.
Until September. After that - chaos is back on the table.
💣 The Global Playbook:
Now (Summer) - Consolidation, ETF flows, geopolitical fear - Strategic entries, low exposure
Breakout - FOMO panic, retail rushes in - Profit-taking via options
September–Fall - Macro/geopolitical shock - Already in cash or hedged
📌 Bottom Line
Yes, Bitcoin might pump. Not because the world is fine - but because someone needs to exit beautifully.
If you're reading this - you're early enough to think.
Markets don’t reward justice. They reward positioning.
🛠 What to do right now:
Watch the $104,000 level - it's the pivot
Breakout = final upside push to $132K–140K
Keep your eyes on September - reversal zone
Think in scenarios: entry, exit, protection
Follow EXCAVO - we don’t guess, we read the game
I've been talking about this scenario for a long time

Rheinmetall now faces a crucial testWill it continue to dominate as Germany’s biggest defence player—or is the soaring rally over, giving smaller names in the sector a chance to gain strength?
🟢 The green scenario outlines what I see as the healthiest outcome: a controlled correction to absorb parts of the massive rally, allowing the market to reset before pushing to new highs.
🔵 The blue path would be less ideal. It suggests a shift into a bearish structure, which could trigger a deeper retracement—potentially even breaking below Point B of our overarching white sequence.
For now, I’ve locked in some profits and will sit back.
No clear buy. No clear sell.
Stay sharp, friends—and remember: the chart speaks before the headlines.

AUDNZD Channel Trading Scenario AUDNZD is Trading down trend and the Price rejected from he recent resistance trendline and is likely go down.

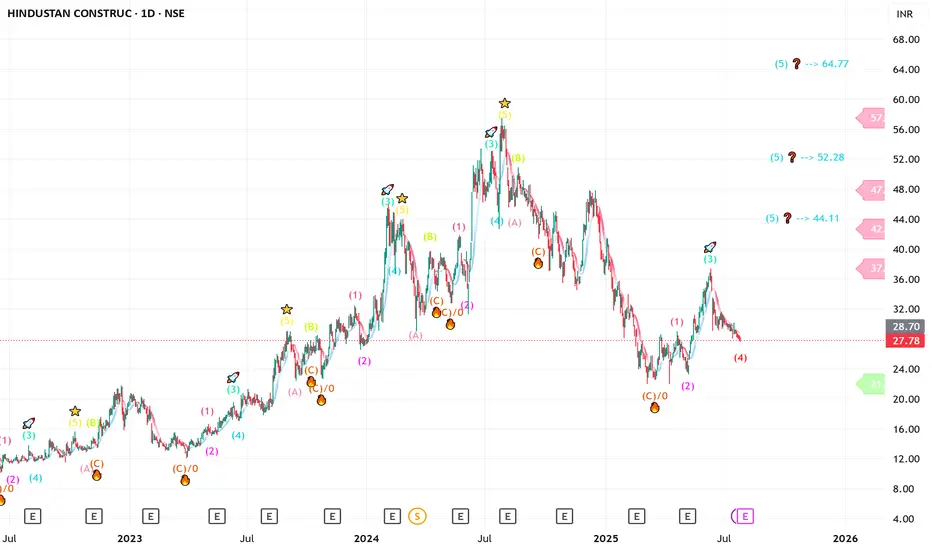
HCC - can give you 100 % or more ?? long term only HCC ----Daily counts indicate Excellent bullish wave structure.
Both appear to be optimistic and this stock invalidation number (S L) wave 2 low
target short / long term are already shared as per charts
correction wave leg seems completed (C)
ENTRY zone 24 & 19
Investing in declines is a smart move for short/ long-term players.
Buy in DIPS recommended
Long-term investors prepare for strong returns over the next two to five years.
one of best counter
Every graphic used to comprehend & LEARN & understand the theory of Elliot waves, Harmonic waves, Gann Theory, and Time theory
Every chart is for educational purposes.
We have no accountability for your profit or loss.
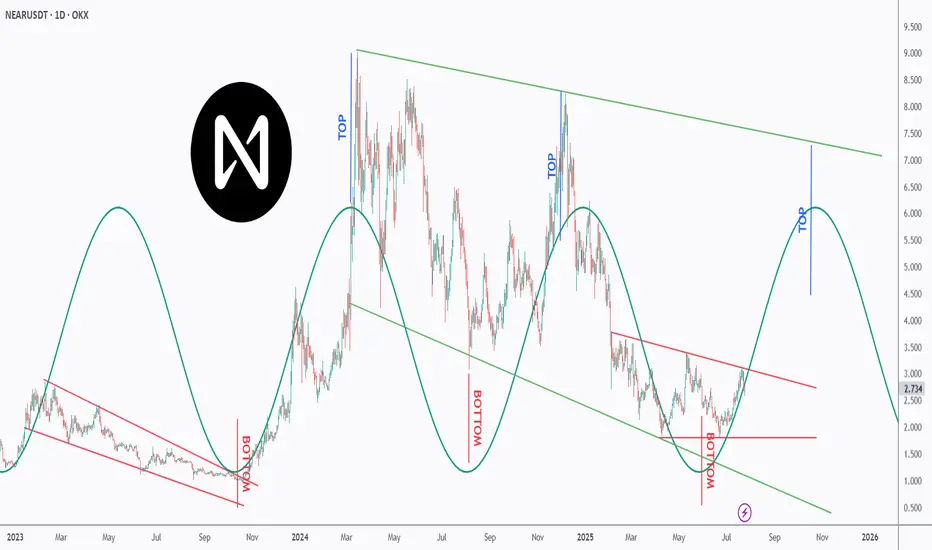
Is NEAR NEARing Its Next Explosion? Watch This Perfect Pattern!NEAR is dancing to a powerful rhythm — and it’s all in the cycles 🔁
This chart uncovers a repeating top-bottom cycle that has held since early 2023, with precise peaks and valleys emerging every few months 📉📈.
After bouncing off a major bottom at ~$2, NEAR is now approaching the mid-line of the descending red channel, suggesting a potential trend reversal is underway 🔄.
Each previous “BOTTOM” aligned with strong recovery waves 🚀, while the projected “TOP” now points toward the $6–7 zone — aligning perfectly with the upper green trendline resistance 🎯.
If the pattern continues, we could be looking at another macro push before year-end 2025 📆.
📊 Will NEAR ride this wave to new local highs — or is it just another lower high in the making? Either way, the rhythm of this chart is too clean to ignore.
📚 Always follow your trading plan regarding entry, risk management, and trade management.
Good luck!
All Strategies Are Good; If Managed Properly!
~Richard Nasr
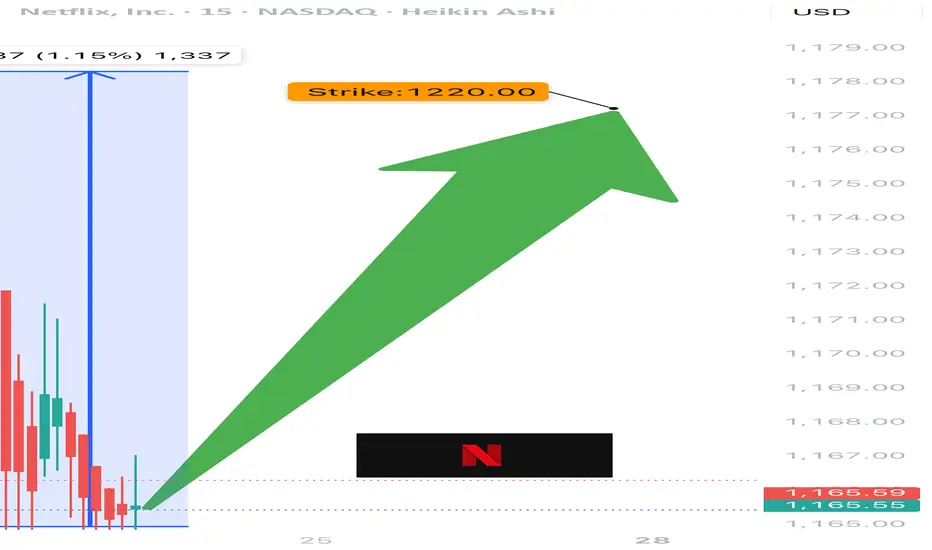
NFLX TRADE IDEA (07/24)
🚨 NFLX TRADE IDEA (07/24) 🚨
⚔️ Bulls vs. Bears… but calls are winning 🐂📈
🧠 Quick Breakdown:
• Call/Put Ratio: 1.27 → bullish edge
• RSI < 45 = 🔻oversold territory
• VIX favorable = room to run
• High gamma = big moves incoming ⚡️
• Expiry: TOMORROW = 🔥 time decay risk
💥 TRADE SETUP
🟢 Buy NFLX $1220 Call exp 7/25
💰 Entry: $0.50
🎯 Target: $0.90
🛑 Stop: $0.30
📈 Confidence: 65%
⚠️ Watch volatility closely. Fast exit = smart exit.
#NFLX #OptionsFlow #OptionsAlert #BullishPlay #DayTradeSetup #NetflixStock #TechOptions #UnusualOptionsActivity #TradingView #GammaSqueeze
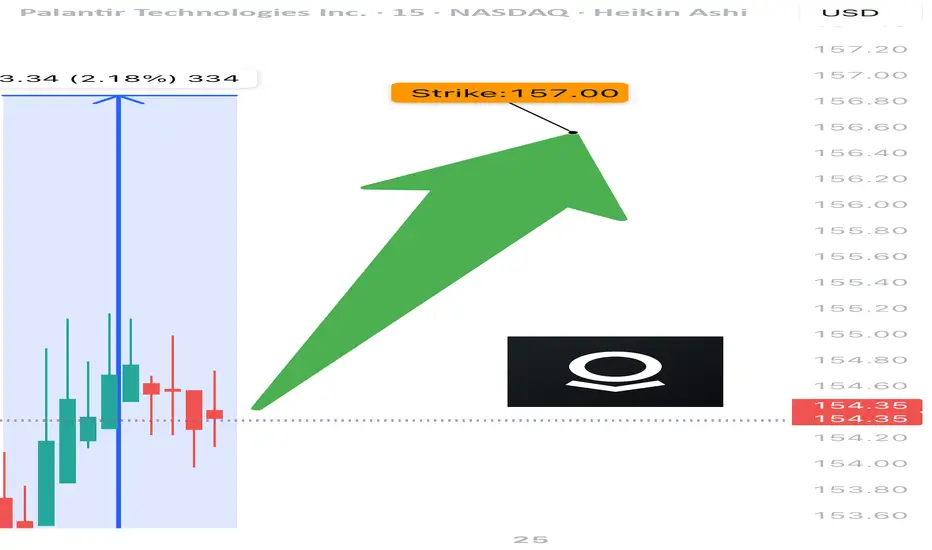
PLTR TRADE SIGNAL (07/24)
🚨 PLTR TRADE SIGNAL (07/24) 🚨
💥 Expiry in 1 day = HIGH GAMMA risk = BIG MOVES coming
🧠 Key Highlights:
• Call/Put Ratio: 1.40 → bullish options flow
• Strong institutional positioning 📈
• RSI cooling off = ⚠️ watch momentum
• Volume concerns → cautiously bullish
💥 TRADE SETUP
🟢 Buy PLTR $157.50 Call exp 7/25
💰 Entry: $0.59
🎯 Target: $0.89 (50%+)
🛑 Stop: $0.24
📈 Confidence: 65%
⚠️ Gamma + Time Decay = explosive but risky. Tight execution needed.
#PLTR #OptionsAlert #OptionsFlow #UnusualOptionsActivity #TechStocks #DayTrading #GammaSqueeze #TradingView #BullishSetup #CallOption
TSLA Honey Ticking Bull Trap! UPDATE 1This is an updated chart, as I keep being prompted to reach "My Target" by TV.
No matter how bad things get for Elona and TSLA, there are always people who are willing to pile in and buy at any price. The problem is the chart is showing lower highs, as TSLA no longer attracts the people needed to boost price, just like TSLA the brand. As a result, people keep getting honey ticked.
Don't Get HONEY TICKED!
As I always say, never EVER!! Invest in toxic people like Elona. They always blow themselves up in the end. It's in their nature!
Click Boost, Follow, subscribe, and let's reach 5,000 followers. ;)

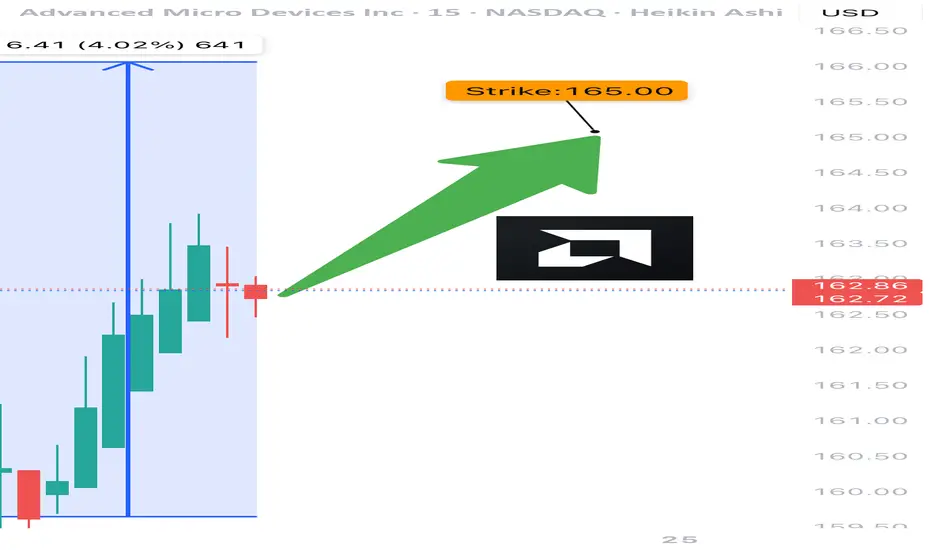
AMD TRADE ALERT (07/24)
🚨 AMD TRADE ALERT (07/24) 🚨
Options flow is screaming bullish 📈
🧠 Key Insights:
• Call/Put Ratio: 1.80 (🔥 heavy call bias)
• RSI: Daily 75.5 / Weekly 77.2 = strong momentum
• Volume = weak ⚠️ but sentiment remains bullish
• High gamma risk = explosive potential near expiry
💥 TRADE IDEA
🟢 Buy AMD $165 Call exp 7/25
💰 Entry: $0.80
🎯 Target: $1.60
🛑 Stop: $0.48
📊 Confidence: 75%
⚠️ Quick expiry = fast moves. Monitor closely.
#AMD #OptionsFlow #UnusualOptionsActivity #TradingView #OptionsTrading #BullishSetup #TechStocks #DayTrading #GammaSqueeze #OptionAlerts
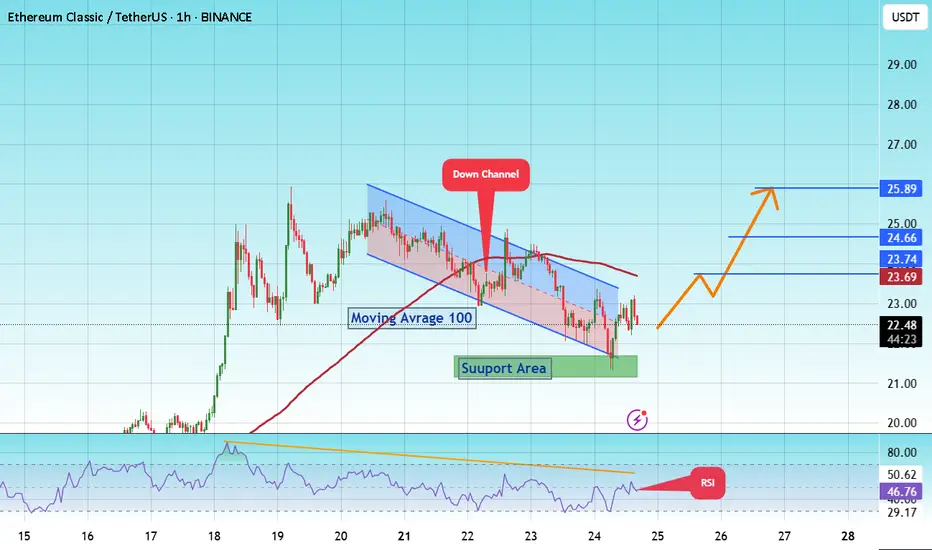
#ETC/USDT Forming Strong Bullish Potential#ETC
The price is moving within a descending channel on the 1-hour frame and is expected to break and continue upward.
We have a trend to stabilize above the 100 moving average once again.
We have a downtrend on the RSI indicator that supports the upward move with a breakout.
We have a support area at the lower boundary of the channel at 21.80, acting as strong support from which the price can rebound.
We have a major support area in green that pushed the price upward at 21.20.
Entry price: 22.50
First target: 23.70
Second target: 24.66
Third target: 25.90
To manage risk, don't forget stop loss and capital management.
When you reach the first target, save some profits and then change your stop order to an entry order.
For inquiries, please comment.
Thank you.
#GTC/USDT Long Trade Plan#GTC
The price is moving within a descending channel on the 1-hour frame and is expected to break and continue upward.
We have a trend to stabilize above the 100 moving average once again.
We have a downtrend on the RSI indicator that supports the upward break.
We have a support area at the lower boundary of the channel at 0.282, acting as strong support from which the price can rebound.
We have a major support area in green that pushed the price upward at 0.275.
Entry price: 0.293
First target: 0.303
Second target: 0.317
Third target: 0.332
To manage risk, don't forget stop loss and capital management.
When you reach the first target, save some profits and then change the stop order to an entry order.
For inquiries, please comment.
Thank you.

GOLD - WAVE 5 BULLISH TO $3,734 (UPDATE)Just because our 'sell trade' is running in deep profits, does not mean we completely rule out the possibility of any alternative trades.
As long as Gold remains above Wave 2 high ($3,245), this Gold bullish bias remains an option. As traders we always have to be prepared to adapt to different market conditions.
