XAUUSD H4 | SELL 💡Why Gold Pulled Back
- Gold pulled back today after hitting $3439.04, just below resistance at $3451.53. Traders took profits ahead of key Fed and trade headlines. Right now, it’s trading around $3414.48, down 0.50%.
- The dip came after the U.S.-Japan trade deal eased geopolitical tension, cutting safe-haven demand. Plus, U.S. bond yields are climbing (10-year at 4.384%), which adds pressure on gold.
Support is building at $3374.42, with stronger buying interest expected around $3347.97 and the 50-day moving average at $3336.40 — a key level bulls want to defend.
Short-term looks a bit weak, but as long as gold holds above the 50-day MA, the bullish trend remains intact. Longer-term, weakness in the dollar, central bank gold buying, and concerns about Fed independence could push prices higher.
🔍Watching the Fed’s July 29–30 meeting next
Wave Analysis
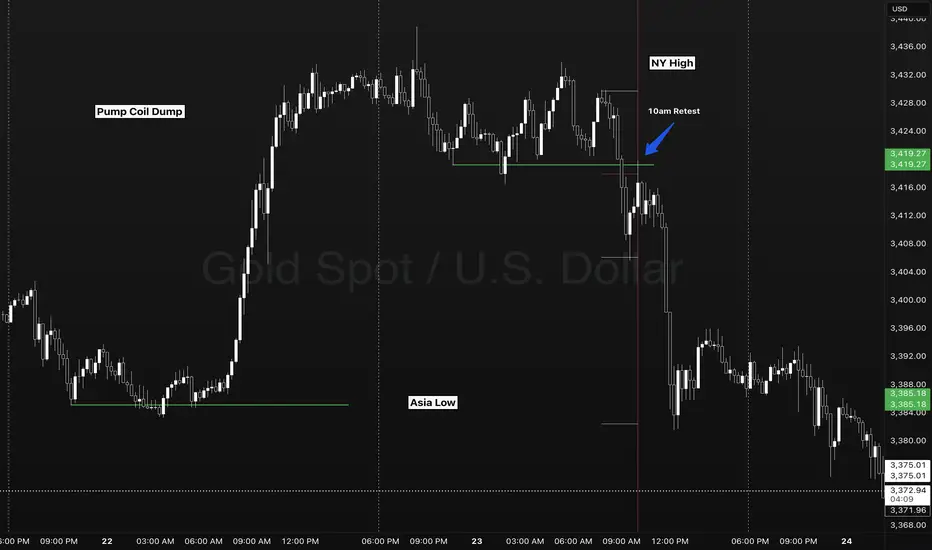
Gold two session setups - Timings Levels Behavior of PriceIn this example we see FOREXCOM:XAUUSD forming a simple and scalable setup interacting with key session levels and key times of day.
- 4HR OPEN CLOSE (10:00am)
- SESSION TIME RANGES
- DAILY HIGH/LOW
- SESSION HIGH/LOW
Here on my chart I use no lagging indicators. A previous session ranges high and low represents the major liquidity levels. A classic break and retest going into the NY session took place at 10:00am offering a parabolic opportunity back to a previous days session low.
SIMPLICITY IS KEY. Stay away from trading gaps, sweeps, hunts, soups on the inside of a high and low. The market only does two things.
- Breakout, fail, reverse.
- Breakout, pullback, continue.
Its important to be on a higher time frame to capture multiple sessions of liquidity areas. As a new trader I found looking to take a trade instead of waiting for a setup. 1 minute charts with multiple moving averages, oscillators, macd. Essentially a science project! Keep it simple traders. Patience pays. Timing, levels, behavior of price.
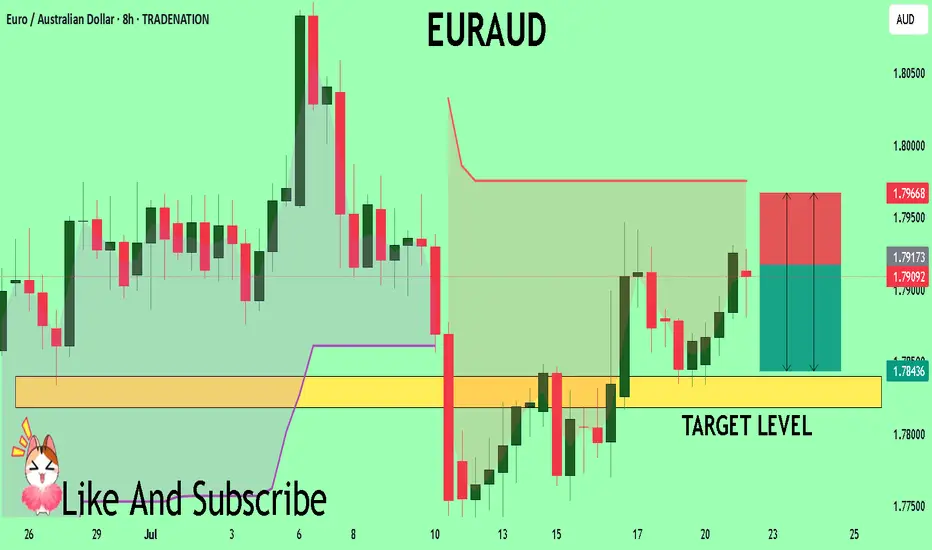
EURAUD Set To Fall! SELL!
My dear followers,
I analysed this chart on EURAUD and concluded the following:
The market is trading on 1.7917 pivot level.
Bias - Bearish
Technical Indicators: Both Super Trend & Pivot HL indicate a highly probable Bearish continuation.
Target - 1.7840
Safe Stop Loss - 1.7966
About Used Indicators:
A super-trend indicator is plotted on either above or below the closing price to signal a buy or sell. The indicator changes color, based on whether or not you should be buying. If the super-trend indicator moves below the closing price, the indicator turns green, and it signals an entry point or points to buy.
Disclosure: I am part of Trade Nation's Influencer program and receive a monthly fee for using their TradingView charts in my analysis.
———————————
WISH YOU ALL LUCK
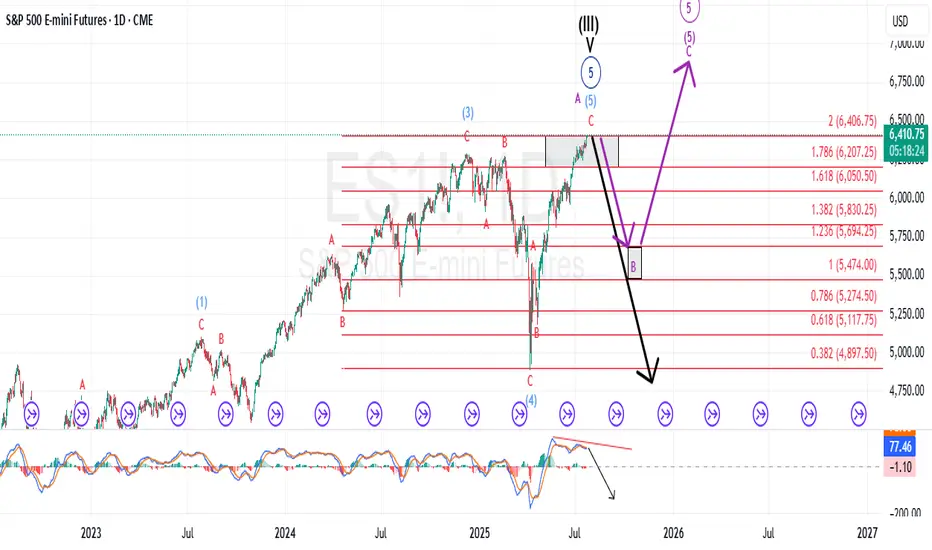
Extended rally off April lows should be completing imminentlyEvery so often, a market move defies conventional expectations of retracement—and the rally off the Liberation Day lows is exactly that. It’s extended longer and climbed higher than even the most bullish forecasts imagined in early April. No one remembers the calls for an imminent recession by most large Wall Street firms.
Now, we're pushing into yet another all-time high—despite glaring negative MACD divergence and a financial media landscape that’s nothing short of euphoric.
The narratives being pushed? Honestly, it’s hard to write them with a straight face:
Tariffs are no longer inflationary. Apparently, I wasted time and tuition learning international trade theory and macroeconomics. Who knew deficits and trade imbalances didn’t matter anymore? Who pays tariffs again? ...never mind.
Weak momentum since mid-May signals not exhaustion—but an “unhealthy absence” of institutional selling, which apparently means the retail trader is in full control now. Because that always ends well... right?
EURCAD Buyers In Panic! SELL!
My dear friends,
My technical analysis for EURCAD is below:
The market is trading on 1.6005 pivot level.
Bias - Bearish
Technical Indicators: Both Super Trend & Pivot HL indicate a highly probable Bearish continuation.
Target - 1.5956
About Used Indicators:
A pivot point is a technical analysis indicator, or calculations, used to determine the overall trend of the market over different time frames.
Disclosure: I am part of Trade Nation's Influencer program and receive a monthly fee for using their TradingView charts in my analysis.
———————————
WISH YOU ALL LUCK

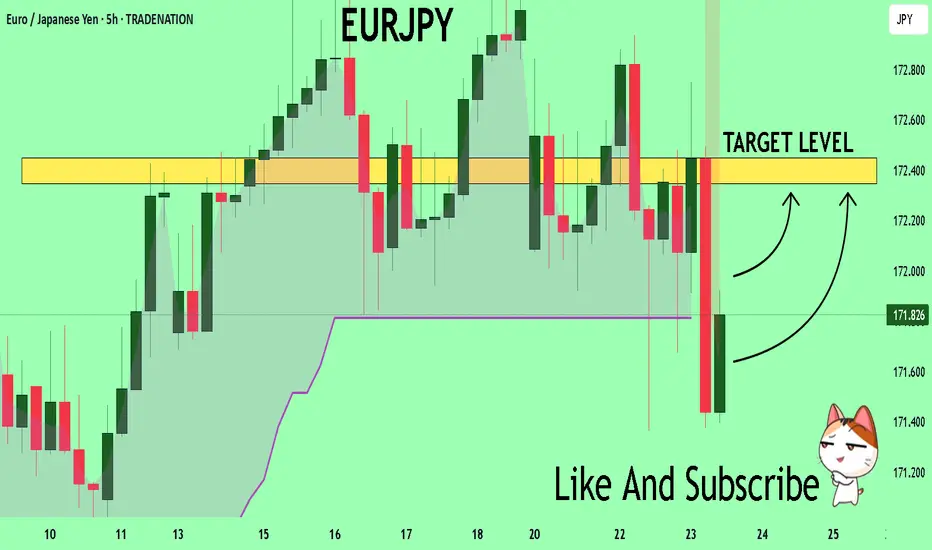
EURJPY Will Explode! BUY!
My dear subscribers,
My technical analysis for EURJPY is below:
The price is coiling around a solid key level - 171.82
Bias - Bullish
Technical Indicators: Pivot Points Low anticipates a potential price reversal.
Super trend shows a clear buy, giving a perfect indicators' convergence.
Goal - 172.34
About Used Indicators:
By the very nature of the supertrend indicator, it offers firm support and resistance levels for traders to enter and exit trades. Additionally, it also provides signals for setting stop losses
Disclosure: I am part of Trade Nation's Influencer program and receive a monthly fee for using their TradingView charts in my analysis.
———————————
WISH YOU ALL LUCK
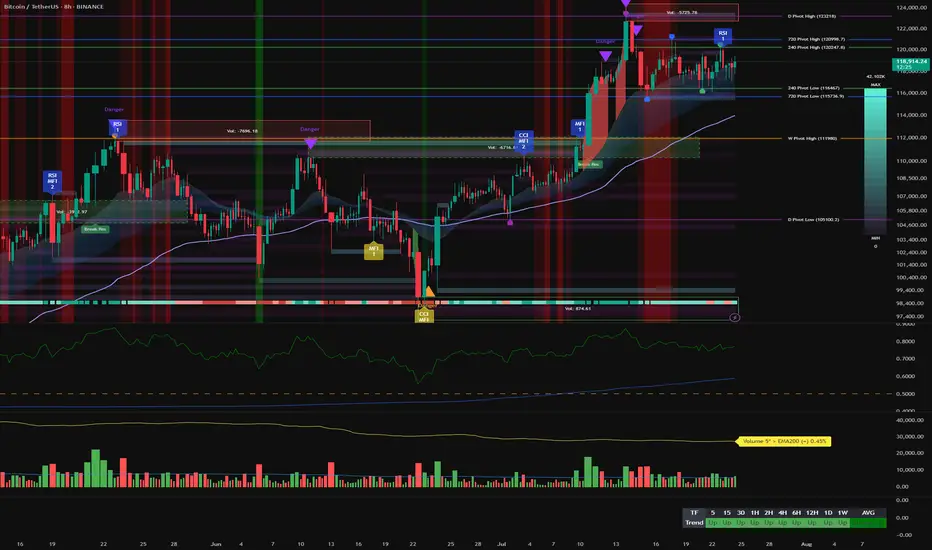
Bitcoin Bullish Structure Holds: Focus on Support Entries & Brea__________________________________________________________________________________
Technical Overview – Summary Points
__________________________________________________________________________________
Momentum: Uptrend synchronization on all timeframes (MTFTI Strong Up). Risk On / Risk Off Indicator: strong buy on larger TF, neutral intraday.
Supports/resistances: Main HTF supports well below current price (115,736–117,000, 111,980). Key resistances to break: 120,998.7 and 122,318.
Volumes: Normal to moderate, no climax, no distribution detected.
Multi-TF behaviour: No behavioural excess, no sell signal, intraday phases are consolidative just below resistance, which is normal.
__________________________________________________________________________________
Strategic Summary
__________________________________________________________________________________
Overall bias: Strong bullish, no end-of-trend alert. Buying retracement towards the Pivot Lows is preferred.
Opportunities: Entries on dips to 115,700–117,000 (2H/4H); breakout above 120,250/122,300.
Risk zones: Return below 115,700 or 111,980 = structural alert. Increased vigilance for macro releases (ECB/PMI/Jobless Claims).
Macro drivers: Fed in focus (no move expected), volatility risk around July 29–30 (FOMC).
Action plan: Entry on retracement, dynamic management. Stop-loss under 115,736 then 111,980. Partial exits on excess or confirmed breakout.
__________________________________________________________________________________
Multi-Timeframe Analysis
__________________________________________________________________________________
1D: Resistances 122,318, 120,998.7; supports 115,736.9, 105,100.2. Risk On / Risk Off Indicator: strong buy, all synchronized bullish, no exhaustion. Daily bias: robust uptrend.
12H/6H/4H: Bullish confluence. Strong momentum, stable volume, validated supports. No ISPD excess, sectoral strength intact.
2H/1H: Consolidation below resistance; healthy structure. Supports to be favored for swing/intraday positioning. Minor intraday hesitation, no reversal.
30min/15min: Behavioural neutrality, lateral movement. Volume normal to mildly elevated, no overheating. Structural risk absent.
Additional indicators:
Risk On / Risk Off Indicator: Strong buy up to 2H; neutral on short TF.
ISPD DIV: Neutral, healthy market, no excess detected.
Volume: No climax or distribution, multi-TF structural support.
Cross-timeframe synthesis: Multi-timeframe bullish alignment, no structural weakness. Opportunities on retracement, breakout plays above all-time highs.
__________________________________________________________________________________
Synthesis & Strategic Bias
__________________________________________________________________________________
BTC trend and momentum remain aligned, sector leadership (Risk On / Risk Off Indicator) intact.
Strong HTF support, major resistances must break for extension.
External risk: macroeconomic catalysts (Fed, ECB, US PMI).
Premium opportunities on dips to supports, dynamic management essential around macro events.
Final bias: as long as supports and indicator alignment hold, bull run continues. Partial exit at resistance; stops below validated pivots.
EURCAD: Expecting Bearish Continuation! Here is Why
Balance of buyers and sellers on the EURCAD pair, that is best felt when all the timeframes are analyzed properly is shifting in favor of the sellers, therefore is it only natural that we go short on the pair.
Disclosure: I am part of Trade Nation's Influencer program and receive a monthly fee for using their TradingView charts in my analysis.
❤️ Please, support our work with like & comment! ❤️

USDJPY: Short Trading Opportunity
USDJPY
- Classic bearish pattern
- Our team expects retracement
SUGGESTED TRADE:
Swing Trade
Sell USDJPY
Entry - 146.78
Stop - 146.96
Take - 146.43
Our Risk - 1%
Start protection of your profits from lower levels
Disclosure: I am part of Trade Nation's Influencer program and receive a monthly fee for using their TradingView charts in my analysis.
❤️ Please, support our work with like & comment! ❤️

GBPUSD buy setupsimply
this is 6 deals after 5 CONSECUTIVE WINNING traders
we have demand
uptrend
the price can't make lower low
and make more candle in the area with more rejection
so the price will go up
be careful on your risk money management
BEST WISHES
CADJPY - The Bulls Are Stronger than Ever!Hello TradingView Family / Fellow Traders. This is Richard, also known as theSignalyst.
📈CADJPY has been overall bullish trading within the rising wedge pattern marked in red.
This week, CADJPY has been retesting the lower bound of the wedge.
Moreover, the green zone is a strong weekly support.
🏹 Thus, the highlighted blue circle is a strong area to look for buy setups as it is the intersection of the lower red trendline and green support.
📚 As per my trading style:
As #CADJPY approaches the blue circle zone, I will be looking for trend-following bullish reversal setups (like a double bottom pattern, trendline break , and so on...)
📚 Always follow your trading plan regarding entry, risk management, and trade management.
Good luck!
All Strategies Are Good; If Managed Properly!
~Rich
Disclosure: I am part of Trade Nation's Influencer program and receive a monthly fee for using their TradingView charts in my analysis.

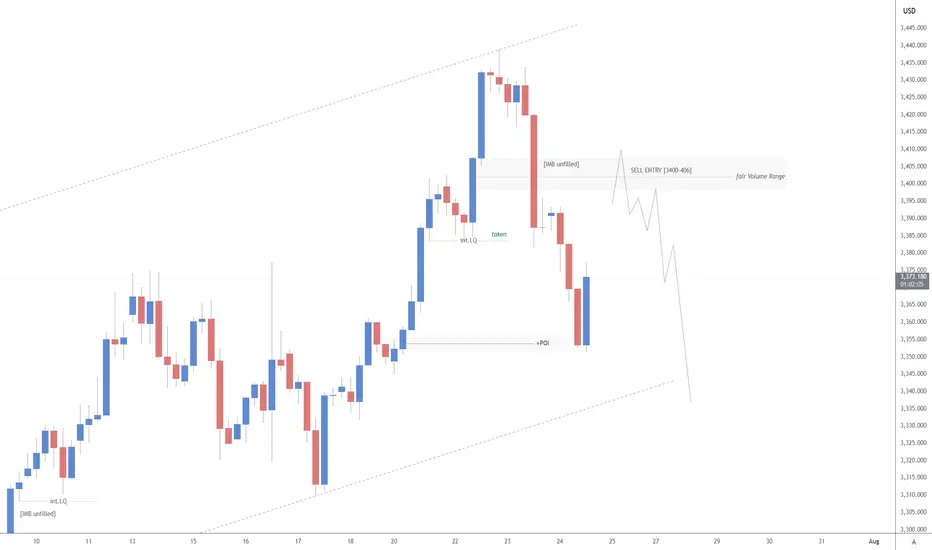
Elliott Wave Analysis – XAUUSD July 24, 2025📊
________________________________________
🔍 Momentum Analysis:
• D1 Timeframe: Momentum is currently in a downtrend, indicating that the dominant trend in the short term (at least until early next week) is likely to remain bearish or sideways.
• H4 Timeframe: Momentum has entered the oversold zone and is showing signs of a potential bullish reversal. This suggests that a corrective upward move may occur today.
• H1 Timeframe: Momentum is still declining and is expected to need around two more H1 candles before entering the oversold zone, implying that one more leg down may occur before a recovery begins.
________________________________________
🌀 Elliott Wave Structure Update:
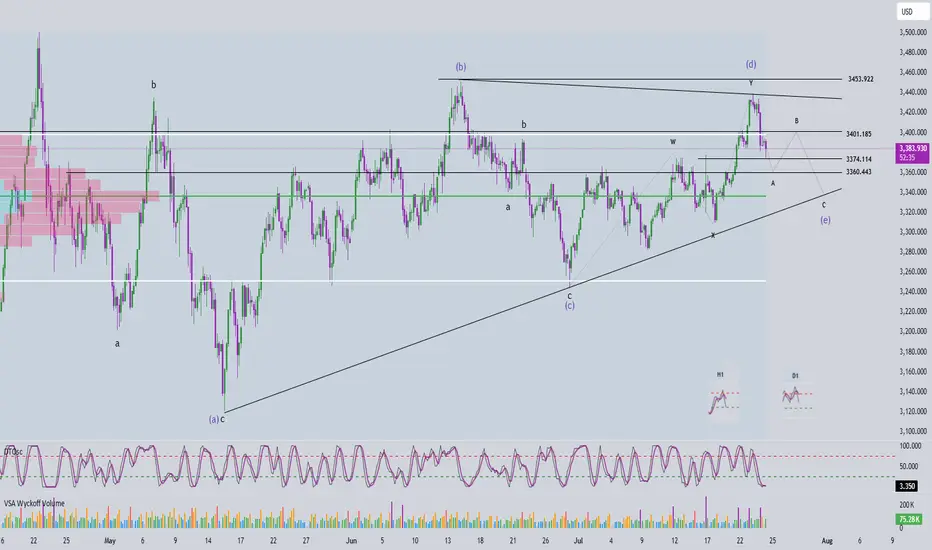
Yesterday’s expectation of a breakout above the resistance zone at 3453 to confirm the start of a new bullish trend did not materialize. Instead, price dropped to the 3374 region, opening up two primary scenarios:
✅ Scenario 1: The correction is still unfolding
• Wave (d) in blue appears to be complete.
• The current leg is likely wave (e), the final leg in a contracting triangle correction.
• In this case, the lower boundary of the triangle and overlapping support zones will serve as key levels to watch for the completion of wave (e).
✅ Scenario 2: Wave 1 of a new bullish trend has completed
• The current decline is wave 2 in a new bullish impulsive sequence.
• The objective here is to identify the bottom of wave 2 to prepare for a potential buy entry into wave 3, which is expected to be stronger and longer than wave 1.
📌 Key difference between the two scenarios:
• Scenario 1 → Wave (e) completes, followed by wave 1 of wave 5.
• Scenario 2 → Wave 2 completes, followed by a powerful wave 3 of wave 5.
________________________________________
🧩 Current Wave Structure:
• A five-wave bearish structure is currently unfolding on the chart.
• According to Elliott Wave Theory, corrective patterns do not typically form five-wave structures.
• Therefore, this is likely wave A in a zigzag (5-3-5) formation.
• Possible targets for wave 5 within wave A:
o Target 1: 3374 – current reaction zone.
o Target 2: 3360 – next significant support level.
________________________________________
📌 Combining Wave Structure with Momentum:
The D1 momentum is firmly bearish, reinforcing the view that the market is undergoing a larger ABC correction.
On the H4 timeframe, momentum is oversold and showing early signs of reversal, aligning with the potential formation of wave B — typically a weak, sideways upward move. The likely resistance zone for the end of wave B lies between 3401 and 3410.
Meanwhile, H1 momentum is still falling and not yet in the oversold zone, suggesting there may be one more move down to complete wave 5. The ideal target for this final leg is around 3360.
Summary:
• D1 bearish → confirms ongoing major correction.
• H4 oversold → supports a potential weak wave B.
• H1 still declining → wave 5 may complete around 3360 before a recovery begins.
________________________________________
💼 Suggested Trading Plan:
For traders with limited experience or those not yet confident in reading live market signals, a Buy Limit strategy at clear support levels is recommended:
• Buy Zone: 3362 – 3360
• Stop Loss: 3352
• Take Profit:
o TP1: 3384
o TP2: 3400
🎯 For experienced traders, it is advised to observe price action at the target support zones and look for real-time reversal signals to optimize entry timing.
GBPAUD Sellers In Panic! BUY!
My dear followers,
This is my opinion on the GBPAUD next move:
The asset is approaching an important pivot point 2.0491
Bias - Bullish
Technical Indicators: Supper Trend generates a clear long signal while Pivot Point HL is currently determining the overall Bullish trend of the market.
Goal - 2.0573
About Used Indicators:
For more efficient signals, super-trend is used in combination with other indicators like Pivot Points.
Disclosure: I am part of Trade Nation's Influencer program and receive a monthly fee for using their TradingView charts in my analysis.
———————————
WISH YOU ALL LUCK

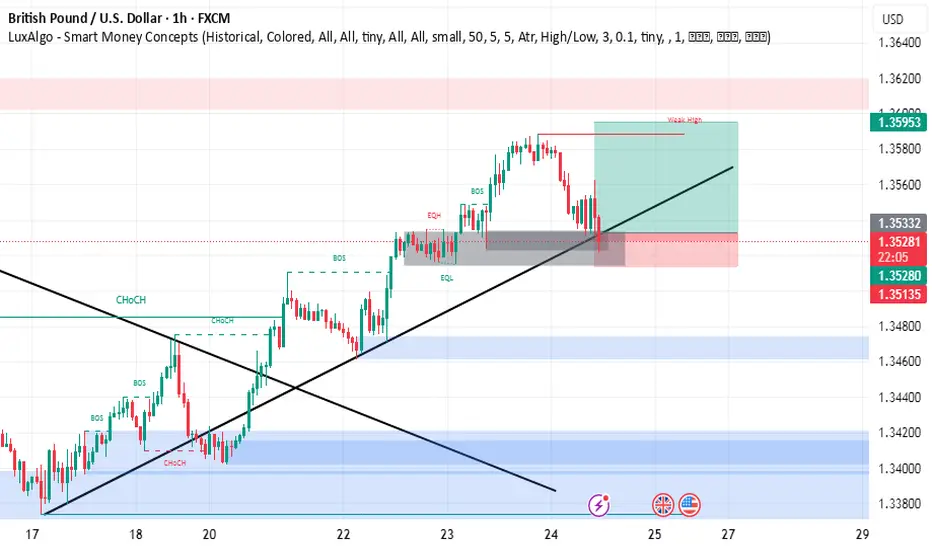
GBPUSD Massive Long! BUY!
My dear friends,
GBPUSD looks like it will make a good move, and here are the details:
The market is trading on 1.3528 pivot level.
Bias - Bullish
Technical Indicators: Supper Trend generates a clear long signal while Pivot Point HL is currently determining the overall Bullish trend of the market.
Goal - 1.3556
Recommended Stop Loss - 1.3512
About Used Indicators:
Pivot points are a great way to identify areas of support and resistance, but they work best when combined with other kinds of technical analysis
Disclosure: I am part of Trade Nation's Influencer program and receive a monthly fee for using their TradingView charts in my analysis.
———————————
WISH YOU ALL LUCK

Visa: Waiting in the Wings Visa has entered a phase of sideways consolidation — but this does not affect our primary scenario. We continue to see the stock moving within magenta wave , which is expected to complete the larger turquoise wave 4 inside our turquoise Target Zone between $308.09 and $292.19. After that, we anticipate a renewed upward impulse. Turquoise wave 5 should then push the stock beyond the resistance levels at $375.51 and $394.49. Meanwhile, we are keeping two alternatives on our radar. The first has a 35% probability and assumes the correction is already over, meaning turquoise wave alt.4 is complete. The second is a more bearish scenario (32% probability) visible on the daily chart. It suggests that the high of green wave alt. may already be in, which would imply that the ongoing alt. wave is headed toward a lower low below the $234.30 support level.
📈 Over 190 precise analyses, clear entry points, and defined Target Zones - that's what we do (for more: look to the right).

GBPUSD (2H - long)GBPUSD (2H - FXCM) chart analysis with Ichimoku Theories. The price has recently broken above the trendline, signaling the start of a new upward trend. On the Ichimoku cloud, the price has moved above the cloud, indicating a bullish shift, with the Tenkan-sen crossing above the Kijun-sen, reinforcing the bullish momentum. Traders should watch for potential resistance levels and monitor the cloud thickness for confirmation of strength. Stay cautious of any pullbacks as the market establishes this new trend!
if you like hint it

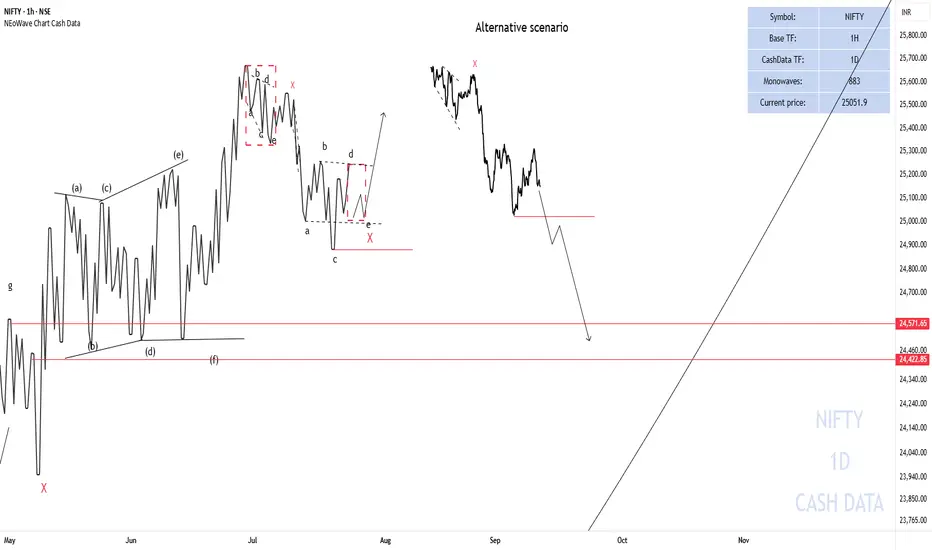
NIFTY50 Analysis ScenariosNIFTY briefly went below 25000 points but could not consolidate so a possible scenario is that X- wave is forming, triangle - X - triangle and then the upward movement starts.
Alternative scenario
If the end of wave-c of the reverse triangle breaks (red horizontal line), NIFTY could decline to the specified range.
Good luck
NEoWave Chart
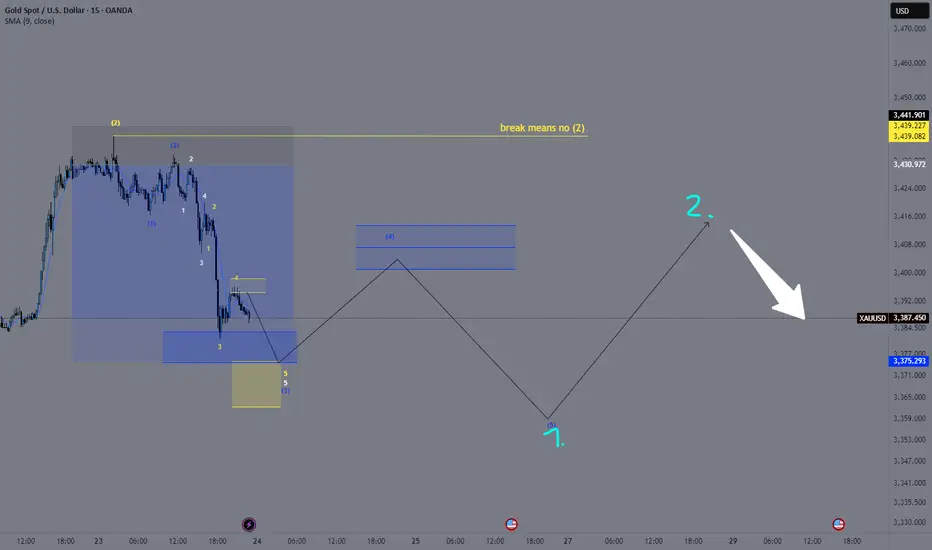
XAU/USD – Wave 2 Breakout Confirmed | Tracking the ImpulseOANDA:XAUUSD
We’ve now seen the first bullish push out of the blue (2) Fibonacci zone.
This allows us to start tracking a potential blue (1)-(2) structure, setting the stage for an impulsive move into blue (3) – although we haven't fully arrived there yet.
Within this blue wave (2) to (3), we can already identify a white 1-2-3-4 in progress, and from white 4, we're seeing a yellow 1-2-3-4-5 impulse forming.
📌 Currently, we are at yellow wave 4, right below the Take Profit zone of the Fibonacci extension projected for blue wave (3).
This level aligns perfectly with the yellow Fibonacci extension zone calculated from yellow wave 2 to 3 to 4, which gives us the expected yellow wave 5 target.
🚀 Once that move is complete, I anticipate a potential upward breakout above 3400, leading to a blue wave (5).
This blue wave (5) would then mark the blue wave 1 of a larger bearish sequence: specifically, the broader move from yellow wave (2) to (3).
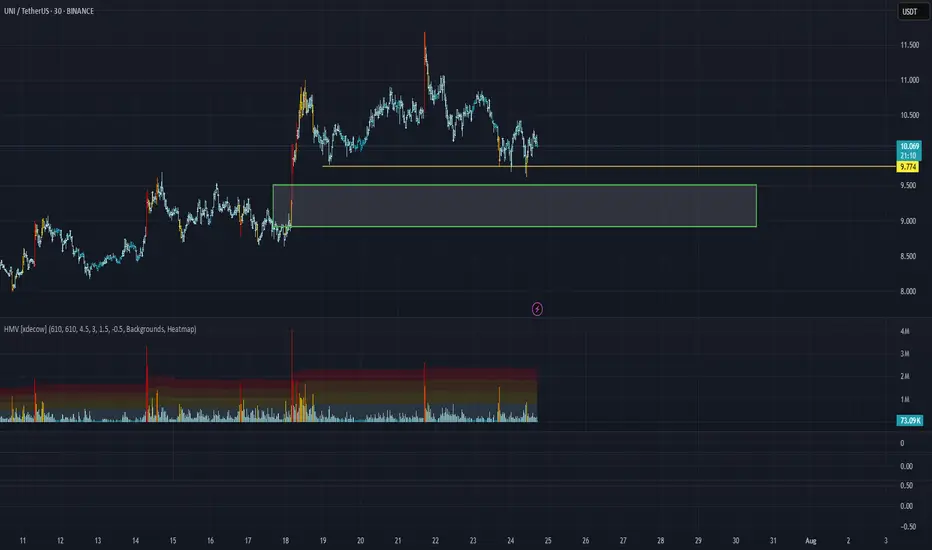
UNI/USDT Analysis. Strong Support
This pair has been in a downtrend since July 21st, but after approaching the important $9.8 level, the price has failed to break below it on three separate attempts.
Below that, there is a very strong buyer zone between $9.5 and $8.9. If this zone is tested and we see a reaction from buyers, we will consider a long position.
This publication is not financial advice.
GOLD - SHORT TO $2,880 (UPDATE)Beautiful melt overnight, with Gold down close to 400 PIPS so far. Zoom in to the left & you'll see I've also added in a trendline which sellers have now start taking out. Another strong confluence of sellers taking control.
I warned you all last night not to sleep on Gold. My Gold Fund investors are in deep profits😉

META Slows Down For A Correction Within UptrendMeta has seen a strong recovery recently, but barely retested February highs around 740, from where we can see some nice pullback, but it appears corrective, since it’s unfolding in three waves, and forming a potential bull flag — likely wave 4. A breakout above the downward channel on a daily close could signal the start of wave 5 and a push to new highs.
However, keep a close eye on the 666.1; a break below this level would invalidate the bullish view and suggest a deeper consolidation phase may follow.
Highlights:
Direction: Up (pending breakout)
Structure: Wave 4 bull flag; wave 5 possible soon
Support: 680 / 690

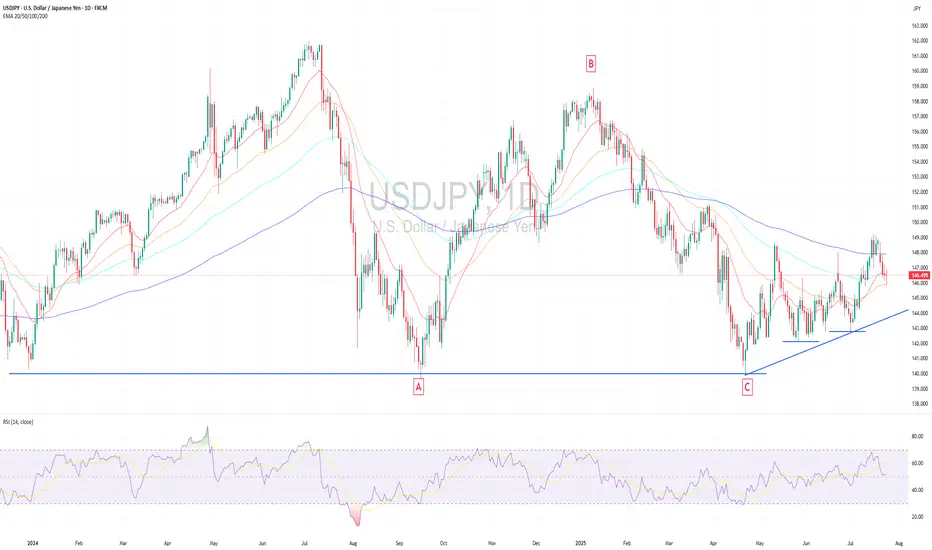
USDJPY may have already found its bottom and is now on a rising USDJPY may have already found its bottom and is now on a rising path
Technical Analysis USDJPY found long-term horizontal support (1.5 yrs) at 140.00 in April and began a slow rebound, forming consistent higher lows—signaling strengthening bullish momentum despite no clear breakout yet.
The EMAs across multiple timeframes are starting to converge after an extended bearish phase for months, indicating a possible bullish reversal as momentum shifts.
From an Elliott Wave perspective, the correction phase appears to have completed a full three-subwave, with Wave C ending at the same level as Wave A—forming a "Regular Flat Corrective Wave." This means USDJPY may now in an early stages of a new bullish impulse wave, signaling potential for extended upside.
If USDJPY can break and close above the previous high near 150.00, it would confirm the bullish reversal and could further strengthen upward momentum.
However, this analysis would be invalidated if the price closes below the key support around 142.00, in particularly if it drops below 140.00, which could signal a significant deeper downside.
Macroeconomic Analysis
In the long term, Japan has already passed its golden era driven by the Baby Boomer workforce and has now in an aging society. This structural demographic shift is reducing Japan's economic dynamic by slowing growth in productivity and overall consumption. As a result, demographic headwinds will likely weigh on Japan’s long-term economic momentum.
Japan’s tech and industrial edge, once dominant in autos and electronics, has eroded under pressure from China and South Korea, weakening long-term competitiveness and weighing on the yen.
On the trade front, Trump’s tariffs have reshaped global trade, hurting Japan’s export-led sectors like steel and autos. This likely reduced Japan’s trade surplus with the U.S., and by economic theory, this will cause the yen to weaken against the dollar. (Although the yen has recently strengthened due to President Trump’s announcement on Wednesday that Washington and Tokyo had reached a trade agreement, this is likely just a short-term market sentiment that will fade.)
In the near term, political uncertainty is also weighing on the yen. The Liberal Democratic Party's loss in the Upper House elections could hinder the government's legislative efforts. Rumors that PM Ishiba plans to resign could further undermine investor confidence in the yen.
Moreover, an uncertain impact of US tariffs on Japan makes it unlikely that the Bank of Japan (BoJ) can raise interest rates soon. This supports the continuation of the Yen Carry Trade, putting additional pressure on the yen.
Japan’s July Manufacturing PMI stayed in contraction at 48.8, while services slightly recovered. Q1 2025 GDP shrank -0.7% QoQ (annualized), reinforcing slowdown concerns and limiting BoJ’s room to hike rates.
Japan needs a new S-curve driver—like a tech revolution—to regain strong growth and restore confidence in the yen. Without it, further yen depreciation is likely.
Analysis by: Krisada Yoonaisil, Financial Markets Strategist at Exness
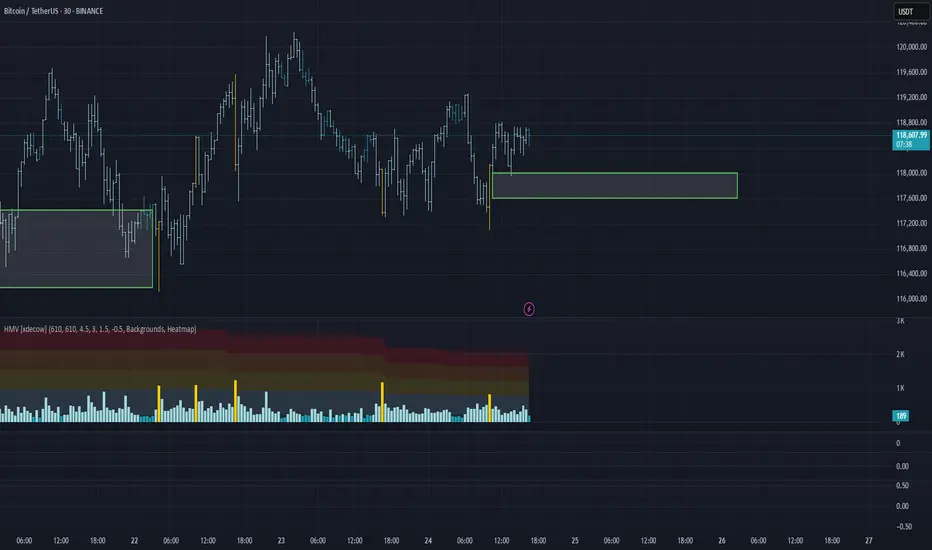
BTC/USDT Analysis. Inside the Range
Hello everyone! This is the daily analysis from a trader-analyst at CryptoRobotics.
Yesterday, Bitcoin tested the previously mentioned POC (the point of control — the area with the highest volume concentration within the range). A reaction followed: buyers prevented the price from falling below that level.
At the moment, we still expect a breakout from the range to the upside. On the lower timeframe, buyers are once again trying to gain control through delta. If the price breaks above $118,800, we can expect a move at least toward ~$120,000. A potential retest of the local zone at $118,000–$117,600 (signs of market buying aggression on the 15m timeframe) is also possible, followed by a continuation of the uptrend. Larger buy zones are marked below.
Buy zones:
~$115,000 (zone of initiating volumes)
$110,000–$107,000 (accumulated volumes)
This publication is not financial advice