#PEPE/USDT or Breakdown? PEPE Eyes 0.00001166 Target !#PEPE
The price is moving within a descending channel on the 1-hour frame and is expected to break and continue upward.
We have a trend to stabilize above the 100 moving average once again.
We have a downtrend on the RSI indicator that supports the upward break.
We have a support area at the lower boundary of the channel at 0.00000980, acting as a strong support from which the price can rebound.
We have a major support area in green that pushed the price upward at 0.00000990.
Entry price: 0.00001030.
First target: 0.00001075.
Second target: 0.00001120.
Third target: 0.00001166.
To manage risk, don't forget stop loss and capital management.
When you reach the first target, save some profits and then change the stop order to an entry order.
For inquiries, please comment.
Thank you.
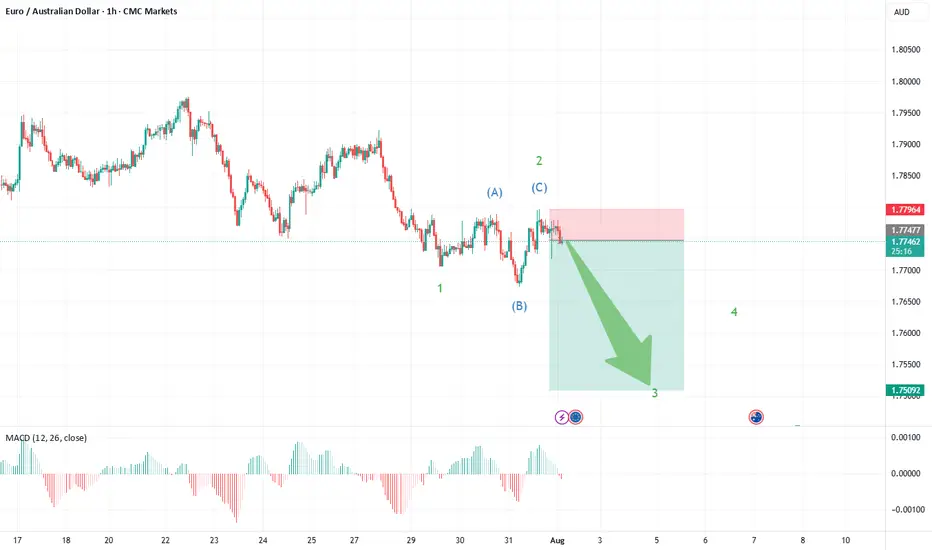
Wave Analysis

EUR/AUD: Short Setup Forming—Is the Downside Just Beginning?EUR/AUD is flashing the early signs of a new short trading opportunity, with the latest chart pointing toward a fresh move lower as the corrective phase may be wrapping up.
What the Current Structure Shows (Primary Scenario)
Corrective Pattern Complete: The strong advance off the May 14th, 2025 lows at 1.7247 unfolded as a classic double zigzag (WXY), culminating at recent highs. Price action has since reversed and formed an initial impulse down—clear evidence that the correction may be over.
Wave 1 Down, Expanded Flat for Wave 2: The chart now displays a completed wave 1 on the downside, followed by an expanded flat for wave 2—where price retraced upward but failed to break the previous peak, a sign of fading bullish momentum.
The recent structure shows a sharp, impulsive move down (wave 1), fitting Elliott Wave expectations for a new trend immediately after a complex correction.
The expanded flat for wave 2—where the B wave exceeded the start of A and C pushed higher—typically heralds a strong, extended wave 3. This supports a bearish outlook from current levels.
GBPUSD: Bearish Continuation & Short Signal
GBPUSD
- Classic bearish setup
- Our team expects bearish continuation
SUGGESTED TRADE:
Swing Trade
Short GBPUSD
Entry Point - 1.3264
Stop Loss - 1.3287
Take Profit -1.3218
Our Risk - 1%
Start protection of your profits from lower levels
Disclosure: I am part of Trade Nation's Influencer program and receive a monthly fee for using their TradingView charts in my analysis.
❤️Please, support our work with like & comment! ❤️

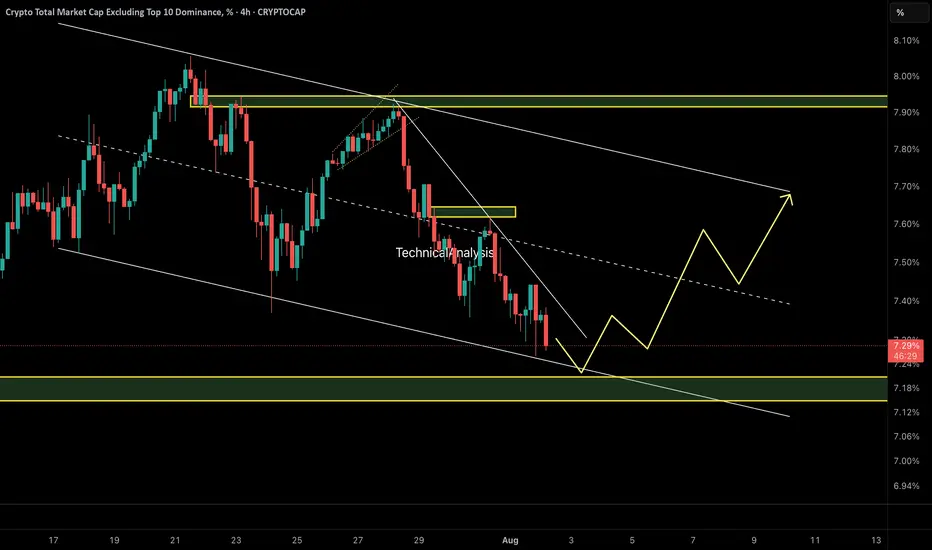
OTHERS.D – Perfect Reaction to Previous AnalysisAs predicted in the last update, OTHERS.D broke structure and dropped sharply toward the 7.20% demand zone — exactly as expected.
Now, we’re waiting for a potential bullish reaction from this key area. If demand holds, a move toward the upper channel boundary (~7.70%) could follow.
🧭 Technical Outlook:
• Price tapped into a key demand zone at 7.20%, which aligns with the lower boundary of a descending channel.
• A bullish reaction is forming, suggesting short-term strength in altcoins.
• A move toward the channel top near 7.70% is now on the table if demand holds.
⚠️ Important Note:
This move is likely to remain a corrective rally unless we see a proper breakout above 7.70% with volume and structure shift. Be selective with altcoin longs.
🔍 Watch for:
• Reaction at 7.50% midline
• Price behavior at 7.70% resistance
• Structure shift or failure pattern near channel top
⚠️ Caution: This remains a corrective rally unless price breaks 7.70% with structure shift.
🔗 Analysis by CryptoPilot
XLM Stellar - Previous video continuation, as forecasted.Not much to say. Just watch the forecast on previous video a few days back. Close to Fib now - no entries.
Video:
Enjoy!
BTCUSD looking for corrective drop towards $111K!1). "Indecisive" weekly Doji retail candle! 2). Price rejection off higher times! 3). Risk indicator is heading south! 4). Trump said "BUY!" 5). There appears to be a cluster of "BUY" orders around $114$K as typically, price drops to trigger those orders!

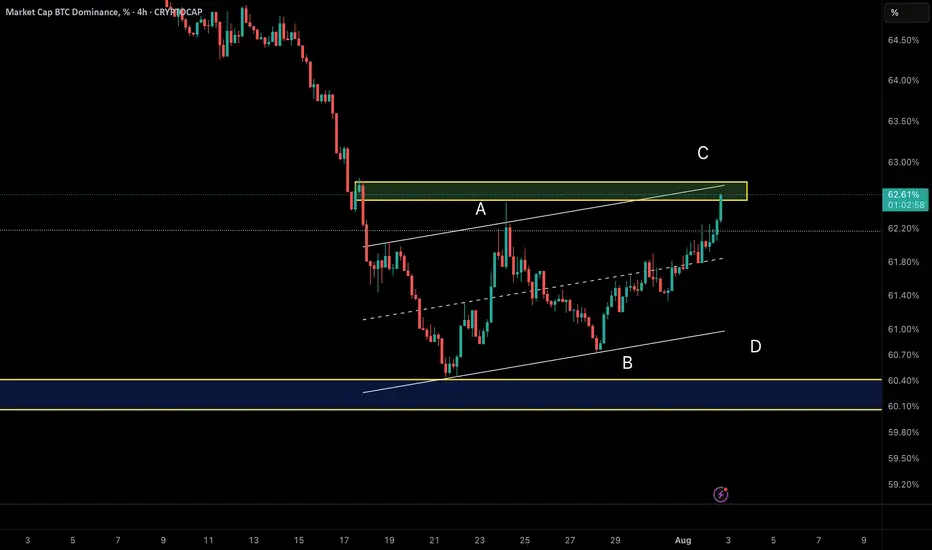
Smart Money Watching BTC Dominance – Rotation to Alts IncomingAfter a deep correction, BTC Dominance has entered a corrective upward phase inside an ascending channel.
Wave A rallied from 60.5% to 62.3%, followed by Wave B retracing to 60.74%.
Currently, Wave C is developing and has reached around 62.2%.
The key resistance sits near 62.7%, exactly at the upper trendline of the channel. This could act as a reversal point, potentially ending Wave C and triggering a bearish move.
💡 Implication:
If dominance drops from this zone, we could see capital rotation into altcoins, supporting a bounce across the broader altcoin market.
BTCUSDT: Good Opportunity to buy Bitcoin has dropped sharply since NFP data came out. We can now see price reversing nicely from 109k area.


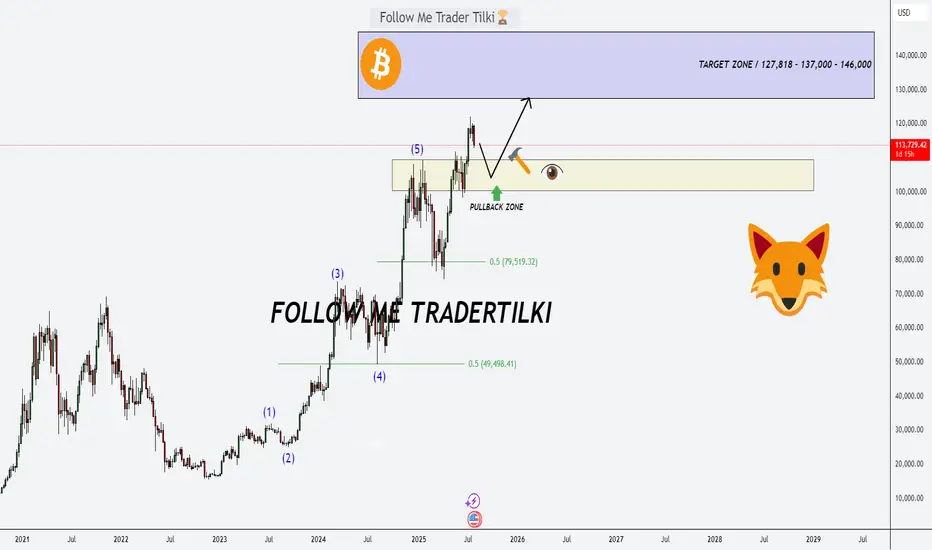
Bitcoin’s Game Has Changed: Fresh Support Zone, Targets Sky-HighHey Dear Friends,
Until recently, Bitcoin had been stuck in a range between 112,331 and 105,344 for quite some time. But that range has now been clearly broken. So, what does this mean? This zone, which used to act as resistance, is now expected to flip and act as support.
According to my weekly trading model, the long-term target levels I’m tracking for Bitcoin are: 127,818 – 137,000 – 146,000.
Since this is a weekly setup, it might take a while for these targets to play out. Even if we see pullbacks to the 112K, 105K, or even 100K levels, I expect to see strong buying pressure from that zone.
I’ll keep sharing regular updates as this setup develops.
To everyone who’s been supporting and appreciating my work—thank you, truly. Your encouragement means the world to me and keeps me motivated to keep showing up. Much love to all of you—I’m grateful we’re in this journey together.
The End of BTC correction? BTC analysis 2/8/2025In my point of view, BTC has completed its correction and is now ready for a strong upward move, potentially targeting the $137,000–$139,000 range, based on the following factors:
1. Confirmation of the Butterfly Harmonic Pattern
The recent reversal occurred within the expected range of the Butterfly harmonic pattern. Typically, the XD leg in a Butterfly harmonic extends to 1.27, but in practice, this can stretch up to 1.414, which is commonly used as a flexible stop-loss zone. After testing the 1.27–1.414 range, a clear 5-wave impulse followed—testing a key trendline and making an attempt to break above the recent high. This sequence, followed by a corrective move, suggests that the broader correction may be complete.
2. Complex WXYXZ Correction Structure
In my previous analysis, I underestimated the duration and depth of the correction. The wave (4) (blue), which is part of the wave (iii), has taken considerable time—likely to allow wave (5) to extend sufficiently to break above the $130,000 level. This would support the assumption that wave (5) (purple) is the extended wave. The overall corrective structure appears highly complex, and can be counted as a W–X–Y–X–Z pattern, supported by the presence of multiple internal corrections within the wave components.
3. 0.618 Fibonacci Retracement of Wave (3)
Wave (4) has now reached the 0.618 Fibonacci retracement level of wave (3), which is significant. Historically, BTC’s corrections rarely retrace beyond the 0.87 level. This deep retracement suggests wave (4) is likely complete—unless price were to fall below that threshold, which would invalidate this assumption.

AAVE Daily Chart – Key Buy Zone & Two ScenariosAAVE is currently moving within a well-defined ascending channel on the daily timeframe. The last major bullish leg began from the $120 support and surged nearly +180% to a local high near $330.
Now, after a 25% pullback, price is consolidating around the midline of the channel near $250. More importantly, there’s a strong bullish order block sitting between $220–230, making this a low-risk buy zone with a stop below the order block.
🔸 Scenario 1 (bullish preferred):
Price dips into the $220 OB zone, completes a possible ABC correction, and launches a new bullish leg targeting the channel top above $500.
🔸 Scenario 2 (bearish alternate):
If the $220 order block fails, deeper correction could follow toward the channel bottom near $135.
⏳ This is a critical area to watch for reaction – Smart Money will likely show its hand soon.
🔗 Analysis by CryptoPilot

Telusdt Buy opportunitySpotted a potential ascending formation with price currently developing a mini bullish flag. This structure suggests an underlying accumulation phase ahead of a potential breakout.
The strategic focus is the Buy Back Zone, a key area for strong accumulation entries. Targets are clearly mapped on the chart, with 0.009896 as the first short-term objective, followed by 0.061317.
The final critical area to monitor is the Crucial Resistance Zone, acting as the neckline of the entire setup—its breakout will confirm a long-term structural shift. Watching closely for sustained momentum.

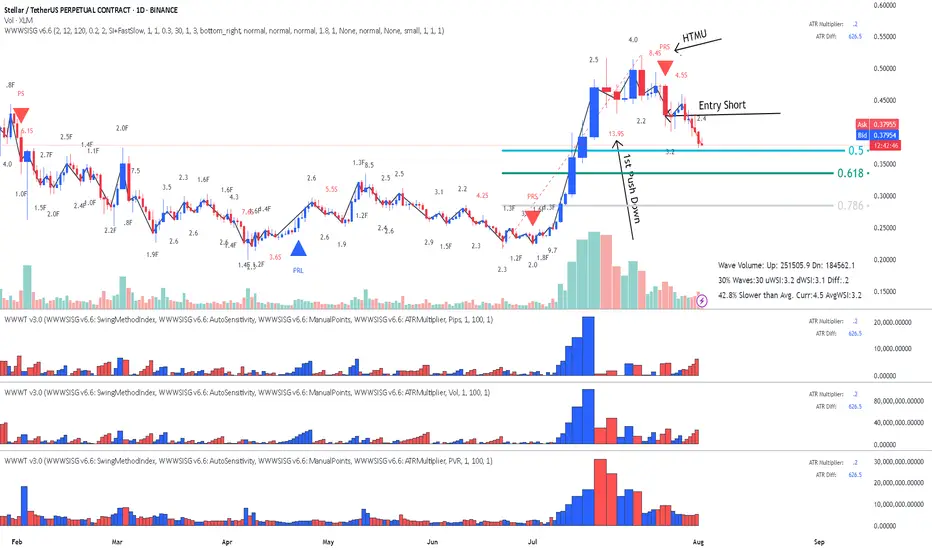
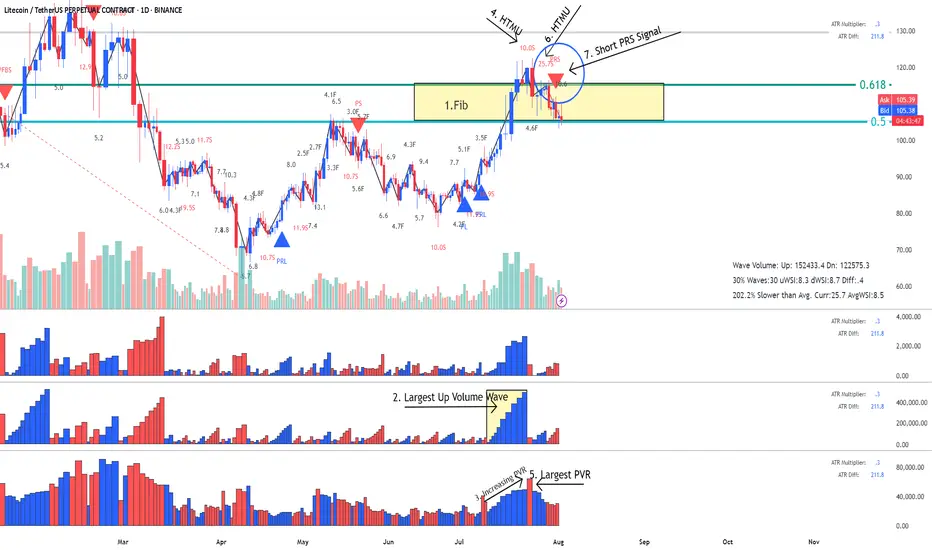
LTC- LitCoin - This is how a Fake Break on Fib looks like This is how a Fake Break on Fib looks like using Weis Wave with Speed Index
Reading the Daily Cha rt
1. Fib Location - Sellers could enter here
2. Largest Up volume wave after a while - also sellers could be hidden in there.
3. Increasing PVR (progressing volume rate) = as we approve the top more volume comes in (sellers)
4. This up wave has the highest Speed Index 10.0S of all the up waves in the trend, that's a HTMU (hard to move up = sellers)
5. The highest PVR bar =sellers
6. Another Abnormal Speed Index 25.5 S - that's another HTMU = more sellers on the up move, price cannot progress upward anymore.
7. and finally down we go with a PRS signal.
All the ingredients for the Short were there. Reading Weis Wave with Speed Index is like reading a book, page after page, until you reach to the last page that the writer has kept the surprise, the only difference is that this is never ending chart book with many stories. This was the story of LTC for now. I think this story has not ended yet and continue to drop to another Fib, the details on the 1HR!.
I hope you enjoy this chart reading lesson using Weis Wave with Speed Index.
Gold long: Completion of Cycle degree Wave 4Hello, in this video, I go through Gold Elliott Wave structure on a cycle level (again) before zooming in on the latest 5-waves structure that is Cycle level wave 4. I talk about using existing broken trendlines and how that allows me to determine the strength of a move when there are false breakouts, whether to the upside or the downside.
Lastly, I discuss on how to trade this on the short-term using lower timeframe and price action. Most importantly, where to set the stop and the rationale for it.
Good luck!

Bitcoin Long: Completion of wave 4 (5-wave instead of 3-wave)In this video, I updated the wave counts for Bitcoin, primarily the change is in wave 4 where I believed that it has formed in 5-waves instead of 3-waves.
Because of the new low, both our stop loss and take profit are now lowered:
SL: $113,858.
TP: $124,000
Good luck!

BITCOIN - Price can turn around and start to move upHi guys, this is my overview for BTCUSD, feel free to check it and write your feedback in comments👊
The price reversed its prior downtrend with a decisive breakout from a falling channel.
This breakout triggered a strong upward impulse, which then began to consolidate into a large symmetrical pennant.
However, the price recently failed to hold the lower support trendline of this pennant and broke to the downside.
The asset is currently trading just below this broken trendline, in what appears to be a liquidity grab.
To continue upwards, buyers must now overcome the immediate resistance located at the $116300 level.
I expect that this breakdown was a fakeout, and the price will soon reverse, break through the $116300 resistance, and continue its rally toward the $121000 target.

AUDNZD Technical + Fundamental Align for DownsideToday I want to analyze a short position on the AUDNZD ( OANDA:AUDNZD ) pair, first, let's look at it from a fundamental analysis perspective .
Fundamental View on AUDNZD
Key reasons to short AUDNZD:
Australian weakness:
Recent data show weakening consumer sentiment and declining building approvals. The RBA seems hesitant to hike further, putting pressure on the Aussie.
New Zealand resilience:
The RBNZ maintains a relatively hawkish stance. Inflation is still a concern, and the central bank is committed to keeping rates high, supporting NZD strength.
Monetary policy divergence:
The divergence between RBA’s dovish stance and RBNZ’s hawkish approach supports further downside in AUDNZD.
----------------------
Now let's take a look at AUDNZD from a technical analysis perspective on the 4-hour timeframe .
AUDNZD is currently trading in a Heavy Resistance zone(1.0963 NZD-1.0870 NZD) near the upper line of the Range Channel , Potential Reversal Zone(PRZ) and Yearly Pivot Point .
In terms of Elliott Wave theory , AUDNZD appears to be completing microwave B of microwave Y of the main wave 4 .
I expect AUDNZD to drop to at least 1.0904 NZD(First Target) based on the above explanation .
Second Target: 1.0886 NZD
Note: Stop Loss(SL): 1.0963 NZD
Please respect each other's ideas and express them politely if you agree or disagree.
Australian Dollar/New Zealand Dollar Analyze (AUDNZD), 4-hour time frame.
Be sure to follow the updated ideas.
Do not forget to put a Stop loss for your positions (For every position you want to open).
Please follow your strategy and updates; this is just my Idea, and I will gladly see your ideas in this post.
Please do not forget the ✅' like '✅ button 🙏😊 & Share it with your friends; thanks, and Trade safe.

BTC Daily Elliott Wave CountAs mentioned in my analysis on youtube post on Total Market Cap short-term, the daily bullish case is now verified, canceling the bearish case with a break through the daily bearish invalidation level.
This past week price action suggests a move towards the completion of a blue wave x. Make sure to check out my latest analysis on short-term Crypto Total Market Cap.
The link to the chart:
Bullish Count

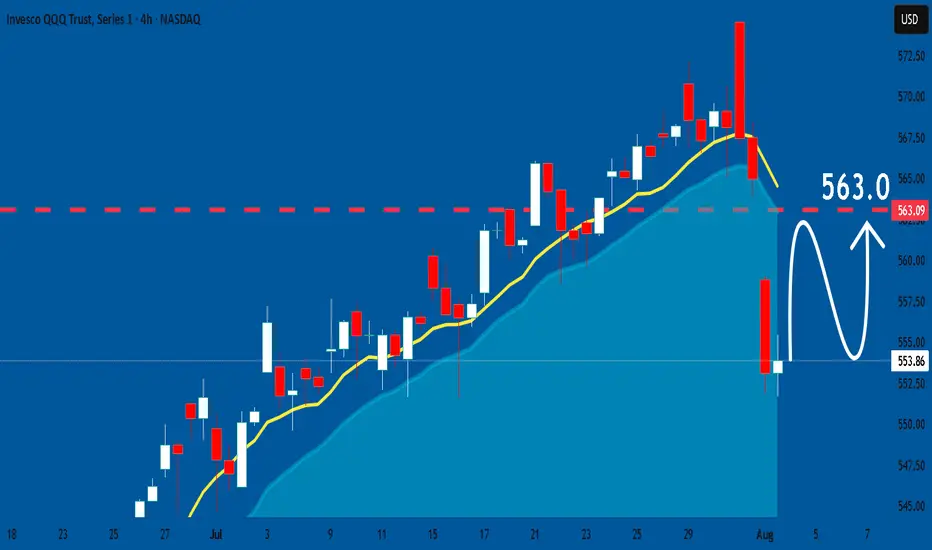
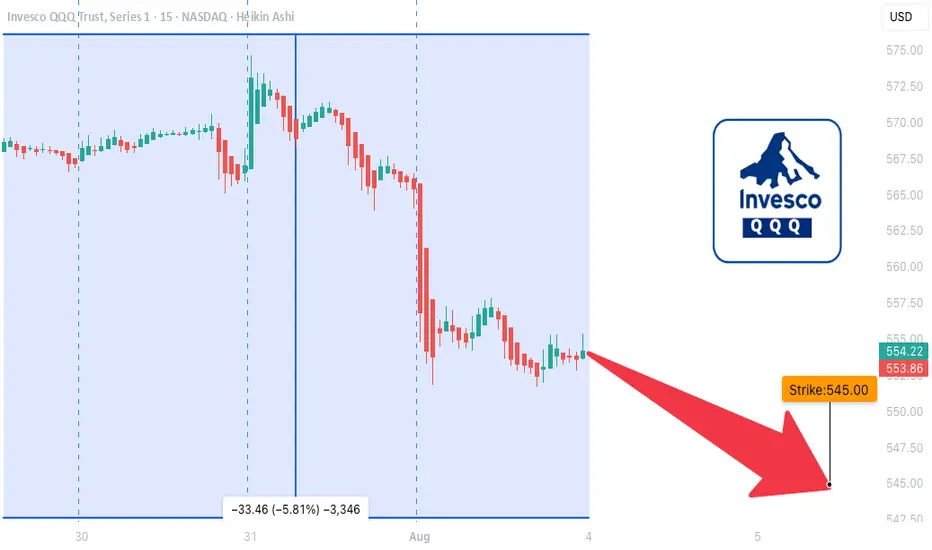
QQQ LEAP Trade Thesis – Aug 1, 2025
🧠 **QQQ LEAP Trade Thesis – Aug 1, 2025**
🎯 **Setup**: High-conviction LEAP PUT
📉 **Bias**: 🔻 *Moderate Bearish*
📆 Horizon: Long-Term (12+ months)
---
📊 **Multi-Model Intelligence Summary**
🧪 **Grok (xAI)**
• Monthly RSI = bearish 📉
• Trading near 52W highs = overvalued 💥
• Suggests: \$545 PUT
🧠 **Gemini (Google)**
• High conviction bearish
• Suggests: \$590 PUT (expensive premium)
🧬 **Claude (Anthropic)**
• RSI breakdown = confirmed weakness
• Recommends: \$530 PUT for max downside
🦾 **Meta (LLaMA)**
• Moving averages turning over
• Suggests: \$555 PUT – moderate confidence
🛰️ **DeepSeek**
• Long-term RSI confirms bearish drift
• Volatility ideal for LEAP entries
• Recommends: \$545 PUT
---
📍**MODEL CONSENSUS**
✅ Bearish trend across all models
✅ Favorable volatility (VIX ✅)
✅ Overvaluation = downside pressure
⚠️ Strike variance across models → we anchor at **\$545** for balance
---
💼 **TRADE SETUP (LEAP PUT)**
• 🔻 Direction: PUT (Short)
• 🎯 Strike: **\$545**
• 📆 Expiry: **2026-09-18** (413 days)
• 💰 Entry Price: **\$38.33**
• 🎯 Target: **\$76.66**
• 🛑 Stop: **\$24.91**
• ✅ Confidence: **75%**
• ⏰ Entry: Monday Open
• 📏 Size: 1 contract
---
📌 **Narrative**:
Every model says the same thing: RSI rollover, inflated price, and perfect LEAP conditions. Institutions are neutral → retail can front-run the decay. You don’t often get long-dated PUTs this clean.
🎯 Asymmetric risk/reward.
📉 Macro setup aligns.
🎯 Strong long-term positioning play.
---
🧠 Stay smart. Position early. Ride the macro shift.
🔔 Like + Follow for more AI-driven trade setups.
avaxusdtThe Avaxusdt is in the two areas, one of the supports is 618, the corrective wave before, and one is dynamic support. If supported, it can rise to 0618.

#LINK/USDT targeting 17.77 $ ?#LINK
The price is moving within a descending channel on the 1-hour frame and is expected to break and continue upward.
We have a trend to stabilize above the 100 moving average once again.
We have a downtrend on the RSI indicator that supports the upward break.
We have a support area at the lower boundary of the channel at 15.60, acting as strong support from which the price can rebound.
We have a major support area in green that pushed the price higher at 15.30.
Entry price: 15.84
First target: 16.47
Second target: 17.00
Third target: 17.77
To manage risk, don't forget stop loss and capital management.
When you reach the first target, save some profits and then change the stop order to an entry order.
For inquiries, please comment.
Thank you.

QQQ: Expecting Bullish Continuation! Here is Why:
Our strategy, polished by years of trial and error has helped us identify what seems to be a great trading opportunity and we are here to share it with you as the time is ripe for us to buy QQQ.
Disclosure: I am part of Trade Nation's Influencer program and receive a monthly fee for using their TradingView charts in my analysis.
❤️ Please, support our work with like & comment! ❤️