Here’s a fresh Nasdaq100 analysis I’ve put together for you.Hey Guys,
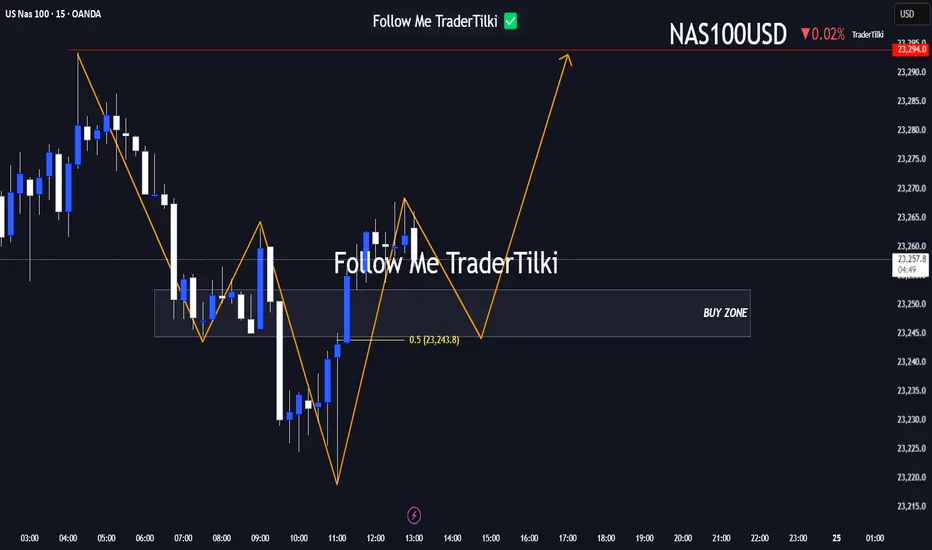
Here’s a fresh Nasdaq100 analysis I’ve put together for you.
I’ve marked the buy zone between 23,252 and 23,240. If price dips into that range, I’m anticipating a potential move upward toward 23,294.
Your likes and support are my biggest source of motivation to keep sharing these insights.
Huge thanks to everyone backing me with a thumbs-up!
Wave Analysis
Oil Brent I think Brent oil will make another low and then rise again to the $90 range and then have a sharp correction.
Majidbabaeiasl Tehran iran
1404 / 05/02

Sell Signal on Bitcoin (1-week timeframe)The IQTrend indicator shows a Sell signal on the weekly timeframe for BINANCE:BTCUSDT .
I also noted the percentage of movement after previous signals so that you understand the seriousness of the situation.
Of course, this time it may be a little different, but I think it's worth keeping this signal in mind anyway.
DYOR

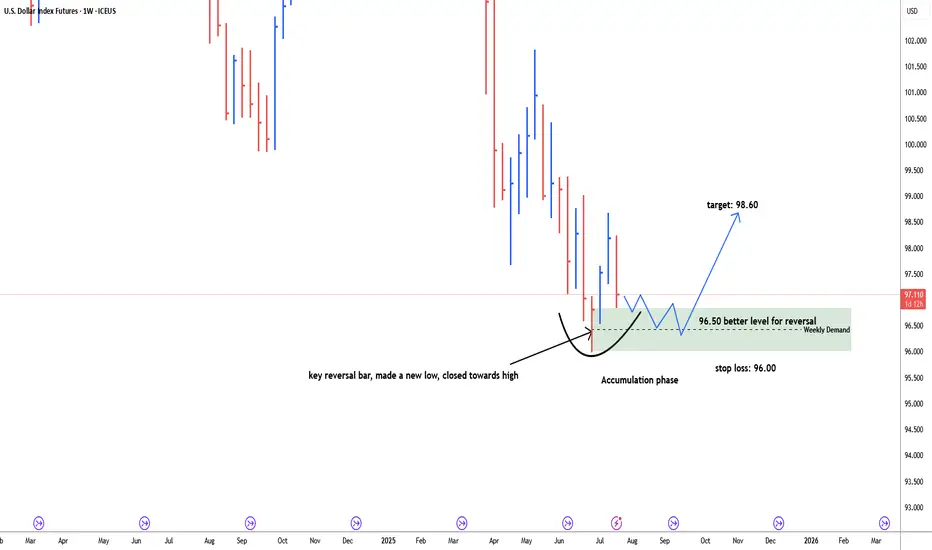
USD Dollar index possbile bullish reversal#usddollarindex, last weekly bar of the month of June is key reversal bar, made a new low and closed towards high. price retracing back down to test weekly demand zone. discount zone of demand is 96.50. possible bullish reversal target: 98.60. Stop loss below 96.00. price need time to build energy for bullish momentum. 96.50-96.00 is more secure level for long.
Nifty Smallcap 100 Index Trading plan 📈 Current Market Context
1H Chart:
The index is in a short-term downtrend after a strong rally.
Price is nearing a potential demand zone (previous bullish order block) from late June around 18,500–18,600, a likely mitigation point for re-accumulation.
5M Chart:
There’s a liquidity sweep and potential bullish reaction forming at the lower end.
Signs of selling exhaustion are visible after sharp moves down with diminishing momentum.
✅ Best Smart Money Buy Setup (Intraday Swing)
🔍 Step-by-Step Signal (5M chart):
1. Order Block Identification
The last bullish candle before a strong bearish move on July 22 (around 18,825–18,845) is a valid Bearish Order Block.
But more importantly, below 18,690, you can see a small Bullish Order Block forming after liquidity grab.
2. Liquidity Sweep
Price has swept liquidity below the recent July 23 swing low (~18,700) and formed equal lows around 18,680–18,690.
This is classic stop hunt behavior (smart money collects retail sell stops).
3. Entry Zone
Look for entry at 18,690–18,700, just above the low of the bullish OB.
4. Confirmation Trigger
Wait for a 5M bullish engulfing or FVG fill + BOS (break of structure above a lower high – e.g., 18,720).
This is your entry confirmation.
🎯 Trade Plan
Component Level / Detail
Entry Zone ₹18,690–18,700
Stop Loss ₹18,655 (Below liquidity sweep)
Target 1 ₹18,770 (Gap fill / OB revisit)
Target 2 ₹18,820 (Structure reclaim)
Target 3 (Swing) ₹18,900–18,925 (FVG/OB above)
Risk-Reward 1:2.5 to 1:4 depending on TP
🧠 Smart Money Logic Used
Liquidity Grab below equal lows.
Bullish Order Block formation.
Price action confirmation after sweep (ideal if price reclaims 18,720 level).
Potential for bullish retracement or reversal to fill Fair Value Gaps and test previous OBs.

AUDJPY BullishAfter exiting a correction, the first impulse (Wave 1) appears. I expect a retracement of at least 50% of the Fibonacci.

Building a Future for RWAs and Multichain DeFi: A Strategic OutlThe intersection of real-world assets (RWAs) and decentralized finance (DeFi) has become one of the most transformative trends in the blockchain space. As traditional financial institutions explore blockchain integration, and DeFi continues to mature, tokenized RWAs—like real estate, bonds, and commodities—are poised to redefine the global financial landscape. Combined with multichain interoperability, this evolution promises greater efficiency, transparency, and accessibility.
The Rise of Real-World Assets on Blockchain
Tokenization is the process of converting rights to an asset into a digital token on a blockchain. For RWAs, this means that tangible assets—such as property, equities, or art—can be fractionalized and traded globally in real-time. This unlocks liquidity in previously illiquid markets, enables 24/7 trading, and reduces administrative overhead.
Use cases are rapidly emerging: real estate funds issuing tokenized shares; commodities like gold being represented on-chain; and even government bonds available on DeFi platforms. These developments democratize access to assets once limited to high-net-worth individuals and institutions.
However, integrating RWAs into DeFi isn't just a technical feat. It requires robust legal frameworks, clear custodianship, and standardized processes for valuation and dispute resolution. Without proper infrastructure, tokenized RWAs risk becoming speculative rather than transformative.
The Role of Multichain Ecosystems
No single blockchain can accommodate the entire spectrum of financial use cases. Multichain architecture—where assets and applications span multiple blockchains—is essential to scale RWA integration effectively.
Cross-chain interoperability enables users to leverage different blockchains for what they do best. Ethereum offers deep liquidity and composability. Algorand and Avalanche deliver scalability and low fees. Polkadot and Cosmos focus on seamless interoperability. Bridging these ecosystems creates a holistic, resilient financial infrastructure.
Protocols like Wormhole, LayerZero, and Chainlink’s CCIP are leading the charge in enabling these connections. By ensuring assets can move securely and efficiently across chains, they support a unified liquidity layer that benefits both RWA issuers and investors.
Challenges and Opportunities
Despite the promise, several hurdles remain. Regulatory compliance is fragmented across jurisdictions, making it difficult for global RWA platforms to operate consistently. Many DeFi protocols are not yet equipped to handle the complexities of asset custody, identity verification, or investor rights enforcement.
Moreover, education is a significant barrier. Institutional investors and retail users alike must understand the risks and mechanisms of DeFi to participate confidently. Projects that prioritize transparency, usability, and regulatory alignment are more likely to gain mainstream adoption.
The opportunity, however, is vast. RWAs could unlock trillions in idle capital, while multichain frameworks reduce friction in global capital markets. Combined, they offer a future where financial products are borderless, inclusive, and programmable.
Conclusion
The convergence of RWAs and multichain DeFi represents a critical shift in finance—from centralized gatekeeping to decentralized participation. It has the potential to create a more accessible and efficient global financial system. While challenges persist, technological advances and increasing institutional interest suggest that this transformation is not only possible, but inevitable. The next few years will be pivotal in shaping the architecture, governance, and standards of this emerging ecosystem.
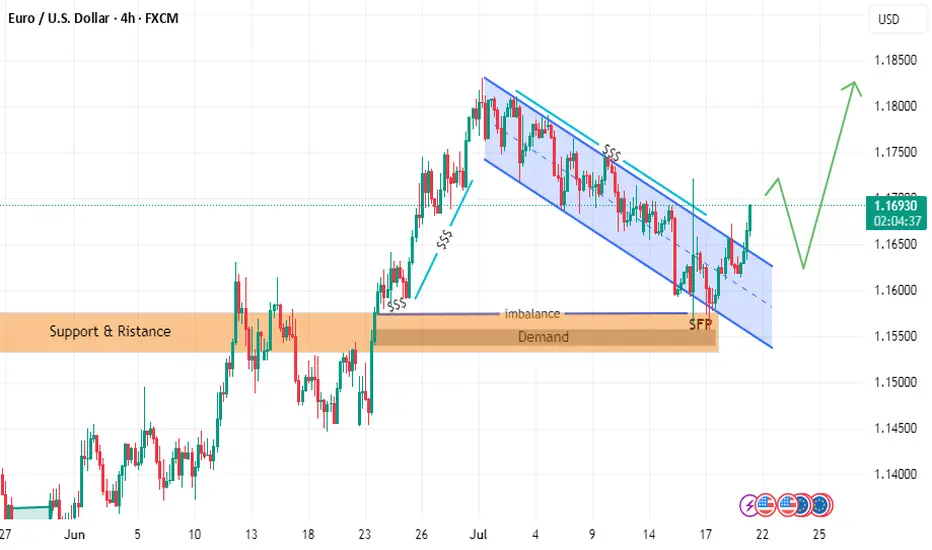
follow EURUSD LION & PLANE BUY SETUPTHE PRICE has moved as I explained in the last two posts
but we have some update to go along the way
the price could break failing channel
and withdrawal liquidity and filled imbalance
hence reflect from demand zone with zero reflection as i explained in last post with rock and plane
and it will go up to take liquidity in failing channel or downtrend
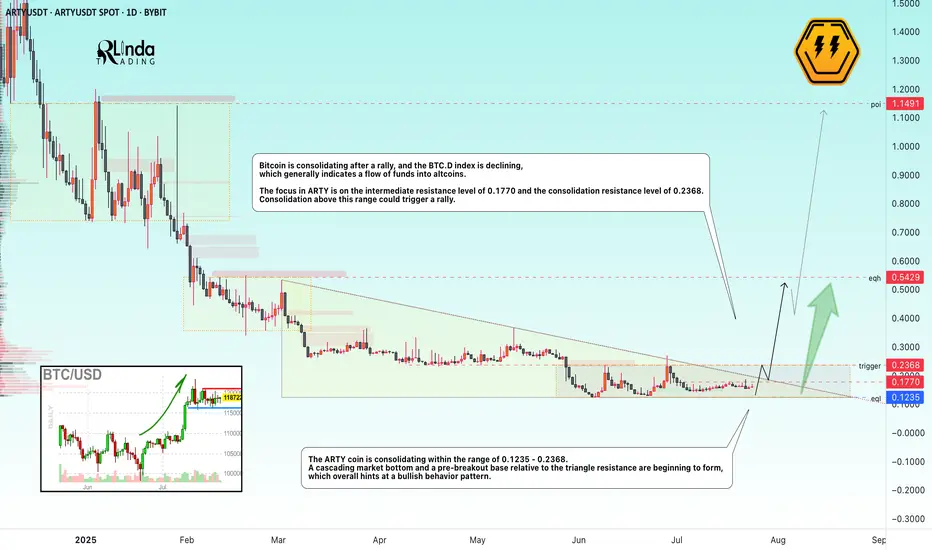
ARTYUSDT → A breakout of resistance could trigger another rallyBYBIT:ARTYUSDT is forming a cascading bottom as part of consolidation before a possible breakout of resistance. The decline in Bitcoin's market dominance gives altcoins a chance.
( (Idea from September 29, 2024!) We previously discussed this coin before its 300% rally. The root causes of its emergence from accumulation and readiness for strong growth were correctly identified).
The dump phase is coming to an end, a cascading market bottom is beginning to form, and a pre-breakout base relative to the triangle resistance is forming, which overall hints at a bullish behavior pattern.
Bitcoin is currently consolidating after the rally, and the Bitcoin dominance index is declining, which generally indicates a flow of funds into altcoins. The situation is such that the altcoin market has another chance for the season. The correction across the entire market may end in the near future, and under favorable conditions (the fundamental background is strengthening, Trump has announced another important event for cryptocurrencies), the market may return to strong movements...
The focus in ARTY is on the intermediate resistance at 0.1770 and the consolidation resistance at 0.2368. Consolidation above this range could trigger a rally.
Resistance levels: 0.2368
Support levels: 0.1235
Technically, a few days ago, the coin tested the consolidation resistance, but the decline did not continue, which generally indicates that buyers are showing interest and holding the market. Consolidation in the near term may end with a retest of 0.1770, 0.2368, a breakout, and further growth.
Best regards, R. Linda!
GBPJPY Potential UpsidesHey Traders, in today's trading session we are monitoring GBPJPY for a buying opportunity around 197.700 zone, GBPJPY is trading in an uptrend and currently is in a correction phase in which it is approaching the trend at 197.700 support and resistance area.
Trade safe, Joe.

XAUUSD Looking to buy GOld now as tarrif is expecting to keep driving the rally and for technicals, therea is a cup and handle formation

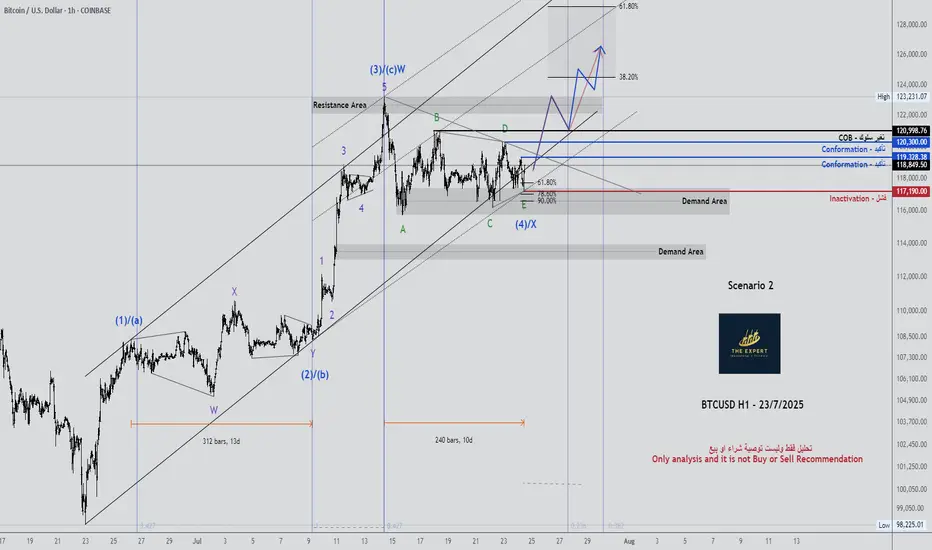
BTCUSD H1 - Updated 23/7/2025BTCUSD H1 - Updated 23/7/2025
chart has language
Only analysis and it is not Buy or Sell Recommendation.
Good-luck.
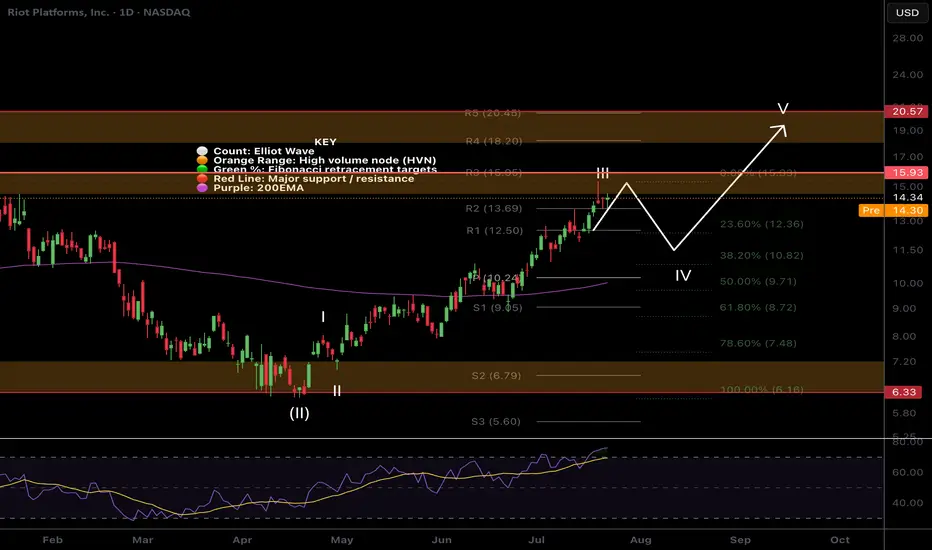
$RIOT Targets hitNASDAQ:RIOT has hit my take profit target at the High Volume Node and R3 daily pivot where it has found resistance.
Wave III appears to be complete with wave IV expected targets being the 0.382-0.5 Fibonacci retracement, also the daily pivot point and ascending daily 200EMA, $10.24.
Analysis is invalidated if we continue to the upside with a new swing high. RSI is overbought no bearish divergence.
Safe trading
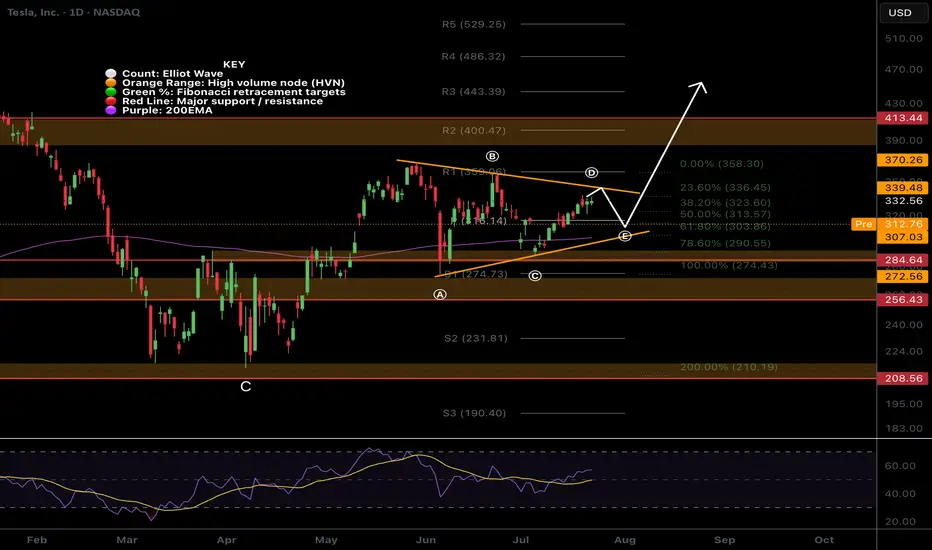
$TSLA Triangle?NASDAQ:TSLA triangle has presented itself with the recent price action. Triangle pattern target is $443 at the R3 daily pivot.
Wave e is expected to end at the daily pivot and wave d break is the signal to go long.
Analysis is invalidated below wave c.
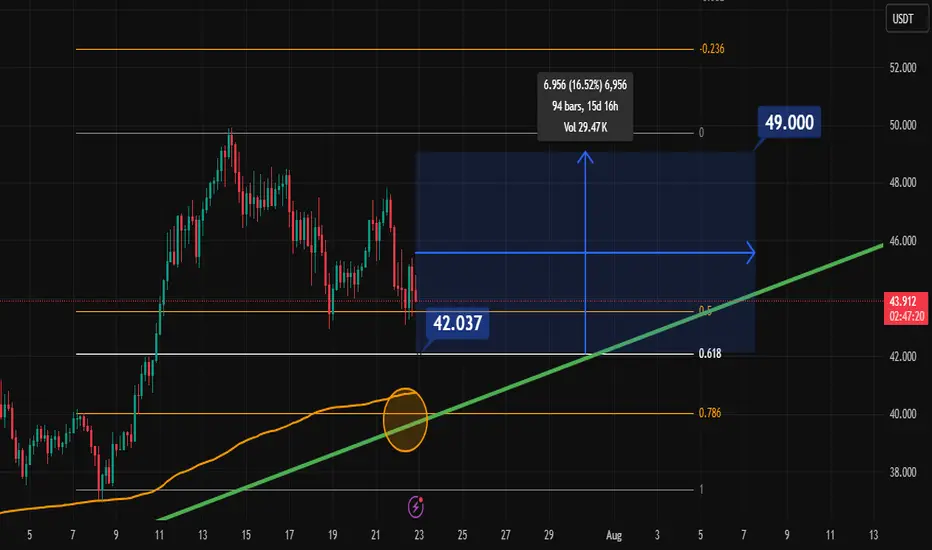
Does Hype Pump from 42 to 49 before August?Well, I have my SPOT chips on that.
I wanna hold on to that in the next 15 days. That is Untill 7th August.
$IREN More downside after huge rally!NASDAQ:IREN is printing bearish divergence on the daily RSI at all tie high resistance.
An Elliot wave motif wave appears complete and wave looks underway with a shallow target of the daily pivot, 0.382 Fibonacci retracement and ascending daily 200EMA.
The daily red wick after printing a 20% start to the day is reminiscent of a blow off top in this asset trapping newbs with FOMO price discovery pump. Market behaviour in action!
Analysis is invalidated if price returns to all time high.
Safe trading

$HBAR Wave 4 finishing soon?CRYPTOCAP:HBAR Hedera appears to have completed wave 4 with the test of the High Volume Node support at the 0.382 Fibonacci retracement.
Wave 5 has an expected target of the High Volume Node resistance at $0.4 before a larger retracement in wave 2 aligning with my summer pump august / September dump view.
Analysis is invalidated below $0.1933 at the 0.5 Fib retracement and will be updated to a wave 2 instead of 4.
Safe trading

GOLD: In-depth Fundamental and Technical AnalysisGOLD: In-depth Fundamental and Technical Analysis
In this video analysis, I discussed in detail how gold can develop from a fundamental and technical perspective.
It remains a very risky and highly manipulated instrument.
You may watch the analysis for further details
Thank you!

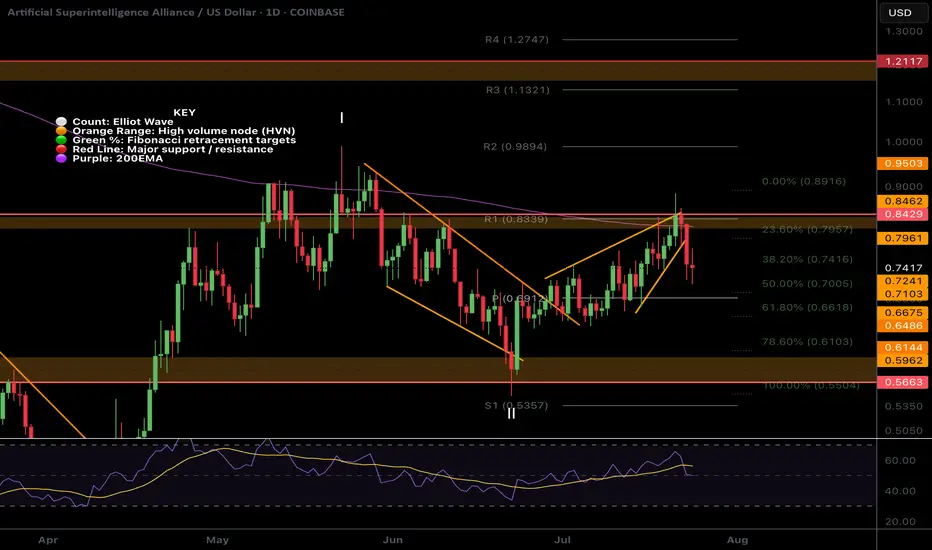
$FET local ending Diagonal and wave 2 near completion?NYSE:FET was rejected for the 4th time at the daily 200EMA! Each time the probability of a breakout increases.
I have adjusted the High Volume Nodes for accuracy.
Locally Fetch appears to have completed a motif wave up with an ending diagonal for wave 5. Wave 2 is expected to find support at the daily pivot and .618 Fibonacci retracement before attempting a breakout of the daily 200EMA once more.
A move below wave II will invalidate this analysis.
Safe trading
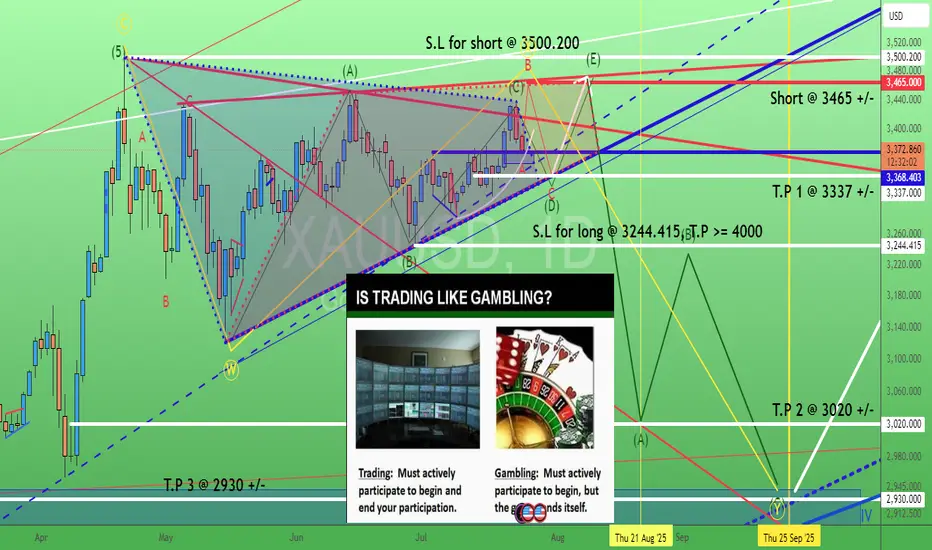
Gold. How to "kill" bull or bear (triangle)? 24/July/25XAUUSD. are you betting (gambling) OR trading for bull/bear triangle? With or without "active lost/cut lost"?.. No stop lost = passive (cut) lost = Let the "gambling" games end for you. Not you end the "trading" any time actively. The "happy ending" always come with good risk management with good risk/reward ratio where ONLY happened when we have T.P and S.L plans.
$ETH Hit Our Targets and was rejectedCRYPTOCAP:ETH hit our signal take profit target at $3820 and was rejected at the High Volume Node EQ to the penny.
That appears to have completed wave 3 of this motif wave. Wave 4 has an expected target of the R2 daily pivot and 0.236-0.382 Fibonacci retracement, $3260 before continuing to the upside in wave 5 with a target of the all time high.
This aligns with my views of a significant pullback at the end of August and September which is typical after a summer rally.
No divergences yet in daily RSI.
Safe trading

Gold sets sights on 3,500 USD – will the rally continue?Hello traders, do you think gold will keep rising?
Today, OANDA:XAUUSD is trading around 3,380 USD after a slight pullback from the 5-week high of 3,438 USD reached on Tuesday. Despite this short-term dip, the overall trend remains bullish, supported by both technical structures and market expectations.
On the news front, the US Dollar Index (DXY) has dropped to 97.4 – its lowest level in weeks. This reflects growing expectations that the Federal Reserve may cut interest rates by the end of the year, as recent data points to slowing inflation and weakening consumer spending. A softer dollar typically strengthens gold’s appeal.
From a technical perspective, the daily chart reveals a clear bullish structure supported by the rising trendline and the EMA34 and EMA89. Price is consolidating just above the trendline, forming a potential bullish continuation pattern. The resistance zone near 3,440 USD is being repeatedly tested – and if gold breaks out with strong volume, the path toward 3,500 USD could open up quickly.
From my perspective, I expect gold to make new highs above this level soon. What’s your take? Drop your thoughts in the comments!
