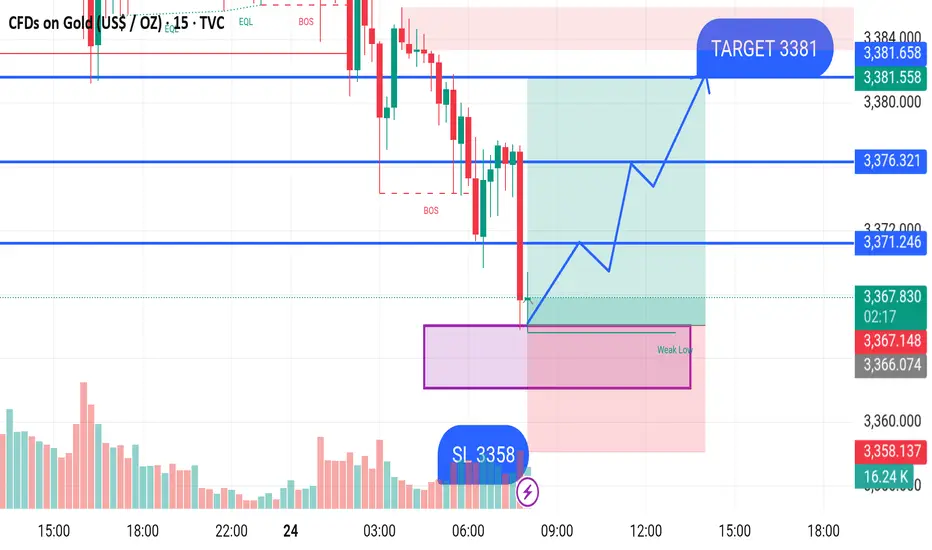
GOLD BUY M15 Gold (XAU/USD) 15-Minute Chart Analysis – July 24, 2025
Price has recently broken structure (BOS) to the downside, creating a weak low around the 3360–3365 zone. This area has acted as a liquidity grab, where the price tapped into a marked demand zone (highlighted in purple), indicating a potential bullish reversal.
Entry Plan:
Buy Entry Zone: 3360–3365 (demand zone)
Stop Loss (SL): 3358 (below the weak low)
Take Profit (TP) / Target: 3381
Key Resistance Levels:
First Target Level: 3371.246
Second Resistance Level: 3376.321
Final Target: 3381.658
Bias:
Bullish Reversal expected from the demand zone with confirmation of structure break and volume increase. A clean risk-to-reward setup is visible with the SL below the liquidity zone.
Wave Analysis
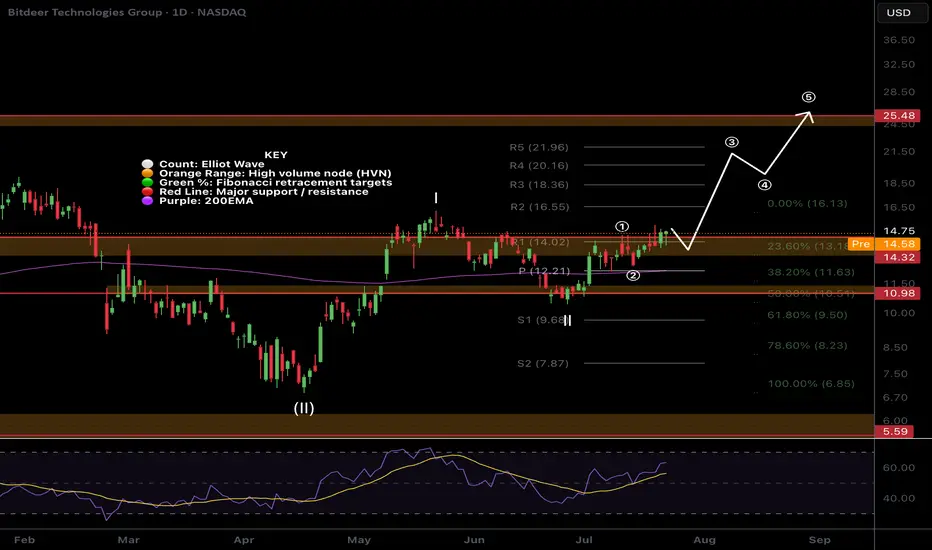
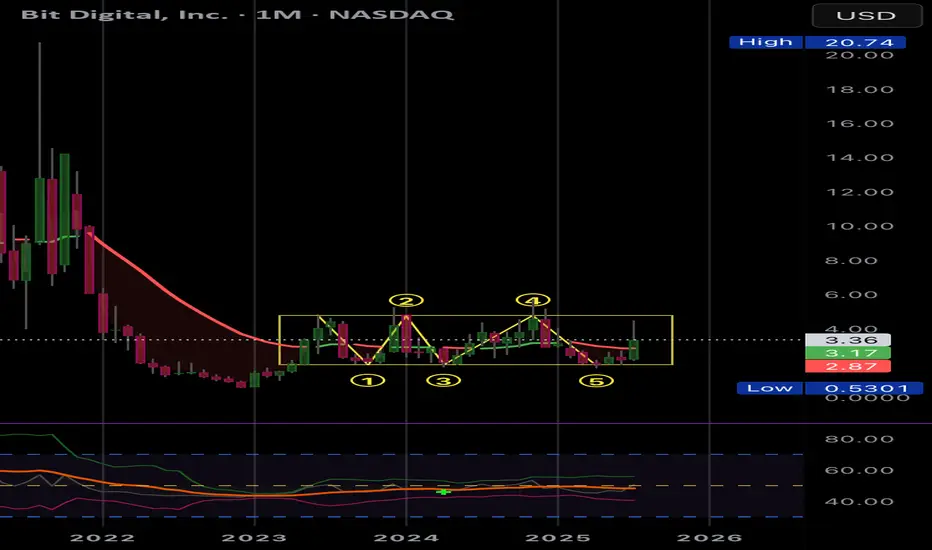
$BTDR Closed above resistance!NASDAQ:BTDR Bitdeer closed above major resistance yesterday, despite BTC and alt coins having a bearish day, triggering our long signal in the Weekly Trade signals substack.
I am looking for price to start to accelerate in wave 3 and resistance now support to hold. If BTC reverses it will add additional tailwinds with a target of the major resistance above the R5 daily pivot $24
Safe trading
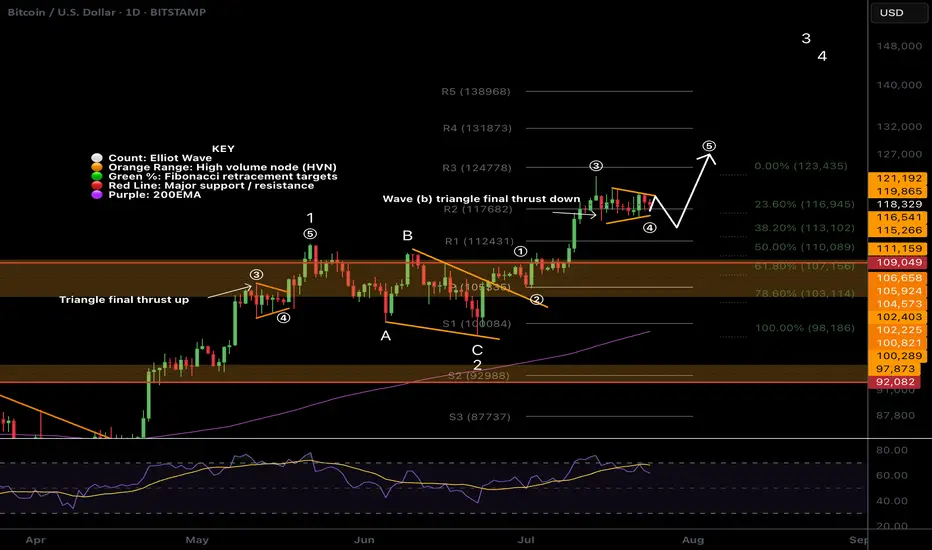
$BTC Wave (b) triangle?CRYPTOCAP:BTC Bitcoin appears to have competed wave 3 up, wave (a) down and now finishing a triangle in wave (b) which would result in a thrust down to around $113k before continuing to the upside in wave (5).
There is slight bullish divergence on daily RSI and wave (4) meets the Fibonacci retracement rules of between 0.236 - 0.382 adding confluence.
Previous all time high is expected to be tested as support on a larger correction, perhaps when the ascending daily 200EMA creeps up to the same level after we blow off.
Safe trading
Crude Oil Short Setup
Entry: 66.40
SL: 67.20
TP: 64.85
Risk to Reward: 1.93
Bias: Bearish
I expect mid-term downside pressure on crude oil prices, mainly due to the following reasons:
The U.S. is mitigating the impact of energy tariffs by increasing domestic supply.
Pressure on OPEC to boost production is rising.
Global demand growth remains uncertain.
These factors may keep energy prices capped in the medium term and support bearish scenarios.

XAUUSD📈 Gold (XAUUSD) Price Prediction After Weekly Resistance Rejection
After gold price touched a weekly resistance and faced a strong rejection, while the overall trend remains bullish, we can outline two potential scenarios:
🔹 Primary Scenario (Bullish Continuation)
Price performs a healthy pullback to the nearest support zone (e.g., 50 EMA on H4 or previous minor support).
A rejection candle forms (e.g., pin bar or bullish engulfing), indicating buyers are still in control.
If the pullback holds:
Price could break through the weekly resistance again
And continue rallying toward the next resistance zone (e.g., $2,480 or $2,500)
✅ Confirmation:
RSI remains above 50 (bullish momentum intact)
No strong bearish divergence on H4/D1
Volume or open interest increases during upward moves
🔸 Alternative Scenario (Deeper Correction)
If the rejection leads to weaker buying volume:
Price may correct deeper toward a stronger support zone like the previous consolidation area (e.g., $2,400 or even $2,375)
Possible formation of a double bottom or higher low before resuming the uptrend
📊 Trading Strategy:
Buy on dip: Look for entries around key support zones, wait for bullish reversal confirmation
Use trailing stop if already in a buy position, as breakouts can be sharp and quick
Watch for upcoming fundamental catalysts (e.g., FOMC, CPI, US labor data) that may drive volatility

UPDATES ON GUMoving in our direction! The British pound seems to be respecting our analysis, moving up words, no drawdown so far still watching closely.

BITCOIN DOMINANCE PULLBACK FOR ALTSCOINS RELIEFJust as we discussed over the weekend, Bitcoin dominance has arrived at intended target in an A-B-C wave on the 1 hour and 4 hour timeframe with a shooting star at the 50EMA on 4 hour set. This candlestick pattern will surely give altcoins a relief tonight but we will analyze if this is done or there will another wave up to the 21EMA on the daily chart. That will be updated once dominance finishes the pullback. Stay tuned fellow traders!

lONG FOR XAUUSDHello my friends
Get ready for the last bullish wave of gold.
You can hope for the roadmap I drew and have a buy guard with your own setup in the bullish direction.
Be profitable and successful

A bearish 12 Month candle could be in the cardsBitcoin made an yearly high of 20% after 6 months in on the yearly candle
This does not make me feel great about the rest of the year
a clear sell signal would be an higher timeframe close under 100k after an upthrust to new ath around 110k - 120k
around 50k-54k for me is an good buy level to build an longterm position:
0.382 fib retracement for an primary 1-2 wave
0.500 fib retracement from the 25k low
0.886 fib retracement from 49k low
50% pullback from current high to projected low
where will bitcoin go ? i don't know, but i do know where i want to buy and when i want to sell

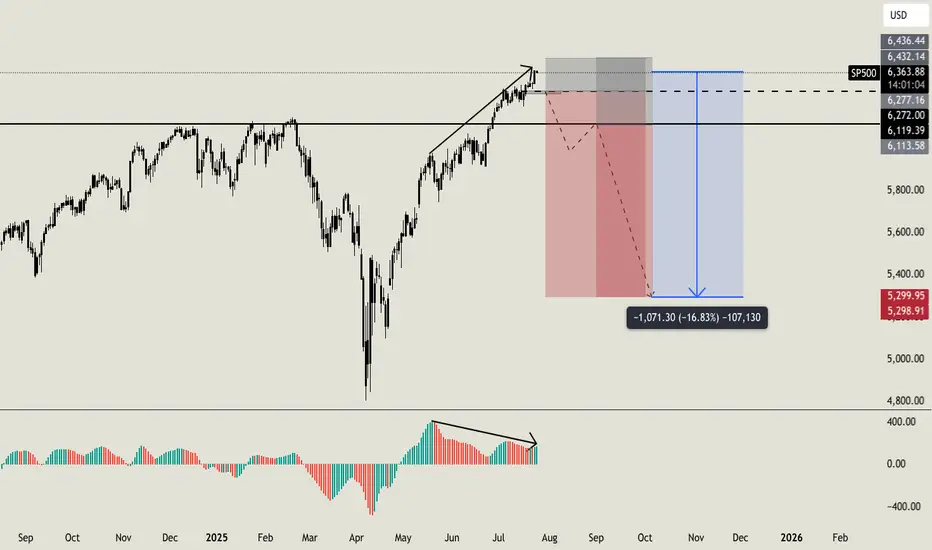
Do you want to keep buying SP500?Hello all. I usually love to work analyzing volumes, times and key level, i am not used to check the standard indicators, but this time i'll made an exception. Lot of indicators (AO, MACD, RSI, OBV) are showing weakness on higher timeframe with a strong bearish divergence (like the one i am sharing now on AO). On smaller timeframe i usually ignore this signals, because they can result in a little retrace, but on higher timeframe like this one can be a strong reversal indicator. But this is not the only things that let me open this position. Going deeper into my analysis, i have a first key level at $6270. Once we will break below this level, i'll open my first sell order with a stoploss a little higher than ATH. If price will break below my second key level at $6120 i'll open my second short order. My main and final target is $5300 (around -16% from now) but i will consider to secure profits before this level. I'll update you guys, and let me know if you are agree with me or not. Cheers
BTBT Consolidated, Ready to GoBTBT sideways consolidation is done. Check the wavetrend. BTBT holds Ethereum. Will have positive upside via altcoin bull.
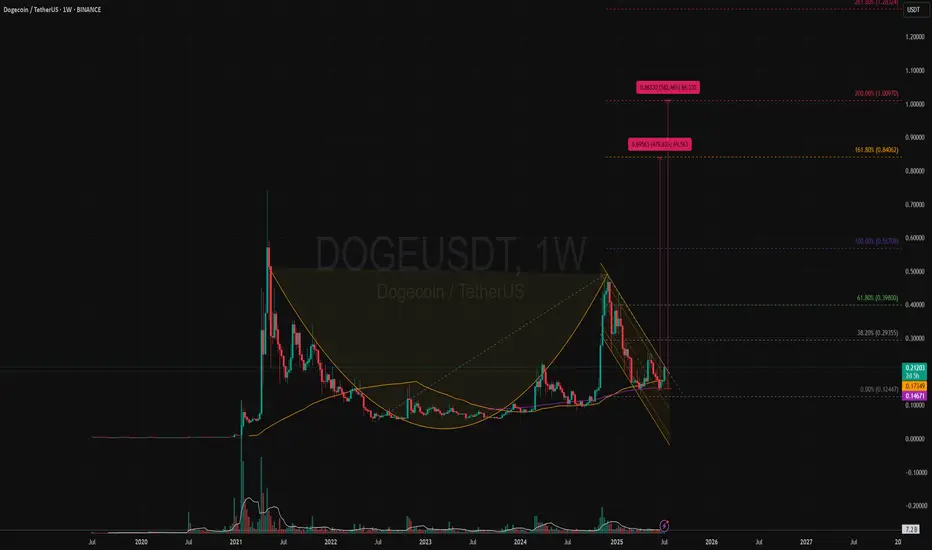
DOGEUSDT | Bullish Cup & Handle Revisiting Target +500% (1 USD)?Price Action and Chart Pattern Analysis:
DOGE cup bottom happened around $0.05 with the rim around $0.48. That gives a depth of roughly $0.42. If the breakout occurs near the rim, the measured move target would be $0.90 zone.
This aligns with several analyst projections suggesting DOGE could reach $0.90 to $1.00 if the breakout confirms.
Another way to project this cup & handle is the fibonacci-based target. These levels suggest that if DOGE breaks above the handle and sustains momentum, $0.85–$1.00 is a realistic zone for profit-taking at 161.8% and 200% extension as 1-2-3 wave pattern.
Reliability of the Cup and Handle Pattern for DOGE
The cup and handle is a classic bullish continuation pattern, but when applied to Dogecoin, its reliability depends on several dynamic factors:
Strengths of the Pattern in DOGE’s Context
Historical Accuracy: DOGE has previously respected technical patterns like rounded bottoms or (THE CUP) and breakout channels (THE HANDLE), especially during alt coin rallies.
Current Setup: a well-formed cup and handle on DOGE’s weekly chart, with price rebounding from $0.14 and testing resistance at $0.2 zone which also the key resistance SMA50W and the downtrend channel (the handle)
WATCH OUT: still a possible throw-under pattern or a final bear trap liquidity below previous low!
Key Action: If breakout confirmed with volume > Follow BUY | if not, wait for retraced SMA20 or breakout support.
Always trade with affordable risk and respect your stop...
EURJPY will retest yesterday's lowest priceBased on Asian session price action, price broke the 172.00 mark.
due to this, i believed it will continue downtrend at least to test yesterday's lowest price (around 171.37).
I'm instant sell from current market price.
calculate your own risk & reward.
Good Luck.

EFERT PROBABLY IN WAVE " 3 "- LONGThis is in continuation of our ongoing EFERT wave tracking
Last week price just broke above 214 (check previous posted idea/chart) providing confirmation that either the 4th wave is completed or it will further unfold into a complex correction.
Our preferred wave count suggest that wave 4 is over and we are in the 5th wave which will take price toward 265 - 270 and then 310 - 330 levels
Alternately, prices will consolidate sideward for a couple of more weeks before starting its upside move.
Unfortunately, we are not trading this setup at the moment because our hands are full.
Let see how this plays, Good Luck!
Disclaimer: The information presented in this wave analysis is intended solely for educational and informational purposes. It does not constitute financial or trading advice, nor should it be interpreted as a recommendation to buy or sell any securities.

What's Next On EURUSDPrice currently leans toward a bearish pullback after a series of impulsive bullish moves. So far, we haven’t seen any significant retracement since the rally began. As we anticipate a potential correction, could this be the awaited moment for the bears to step in—especially with only weaker structures left behind and bearish pressure building?
Regardless, every market scenario demands discipline and proper risk management.
Thinking of taking this outlook? Be sure to wait for strong confirmation before jumping in.
Good luck, traders, as we watch price unfold.
👉 Follow for more updates. See you in the next one 😉.

ETHUSD: A potential short term trade setting upHello,
The ETHUSD pair is currently forming a well-defined bullish flag pattern, a reliable indicator of a potential continuation of the upward trend. Risk-tolerant investors may consider entering at the lower boundary of the flag, while risk-averse investors might prefer to wait for a confirmed breakout to the upside before entering a position.
The MACD is showing a bullish zero-line crossover, further supporting our bullish outlook. Additionally, the cryptocurrency market has experienced significant growth recently, with Bitcoin trading at all-time highs. While Ethereum has underperformed Bitcoin, this lag presents a compelling buying opportunity, as investors who missed Bitcoin's rally may turn to Ethereum to capitalize on its potential catch-up
Disclosure: I am part of Trade Nation's Influencer program and receive a monthly fee for using their TradingView charts in my analysis.
