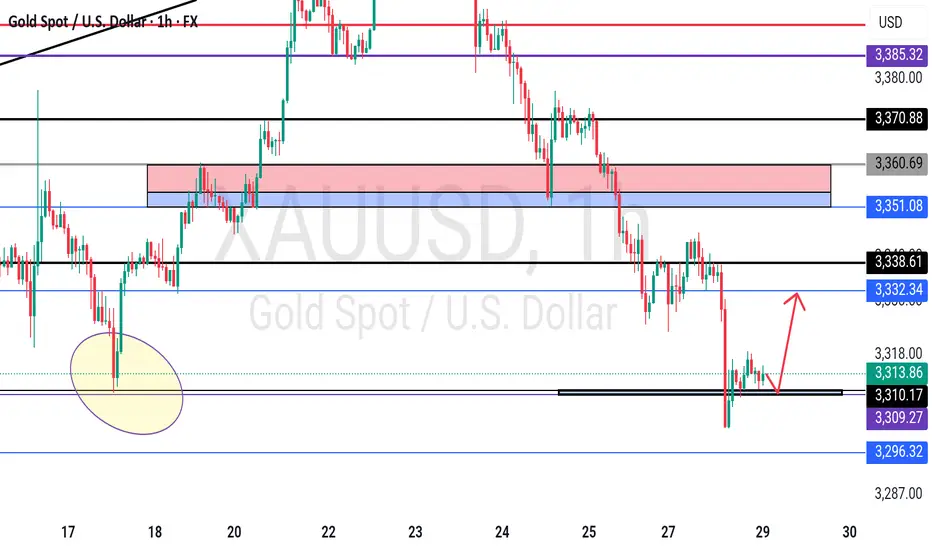
GOLD - One n Single Area, what's next??#GOLD... market just reached at his ultimate area as we discussed in our last week analysis and in Friday analysis as well.
The area is 3309-10
Keep close and don't be lazy here.
NOTE: we will go for cut n reverse below 3309 in confirmation.
Good luck
Trade wisley
Wave Analysis
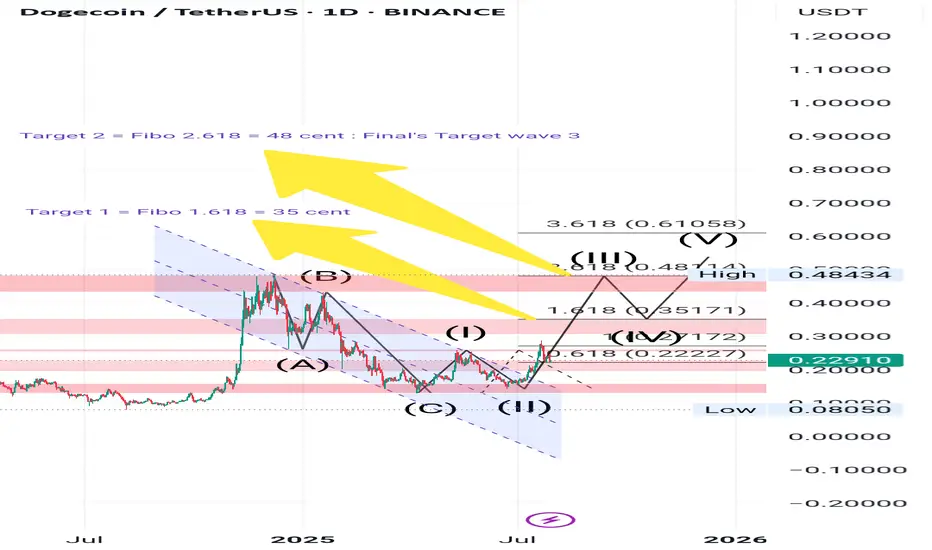
Doge: Daily TimeFrame: wave 3 ?! MaybeDogecoin chart on Daliy Timeframe.
Price is completing wave 3.
The targets are clearly visible on the chart.
Target 1 = 35 cent
Target 2 = 48 cent
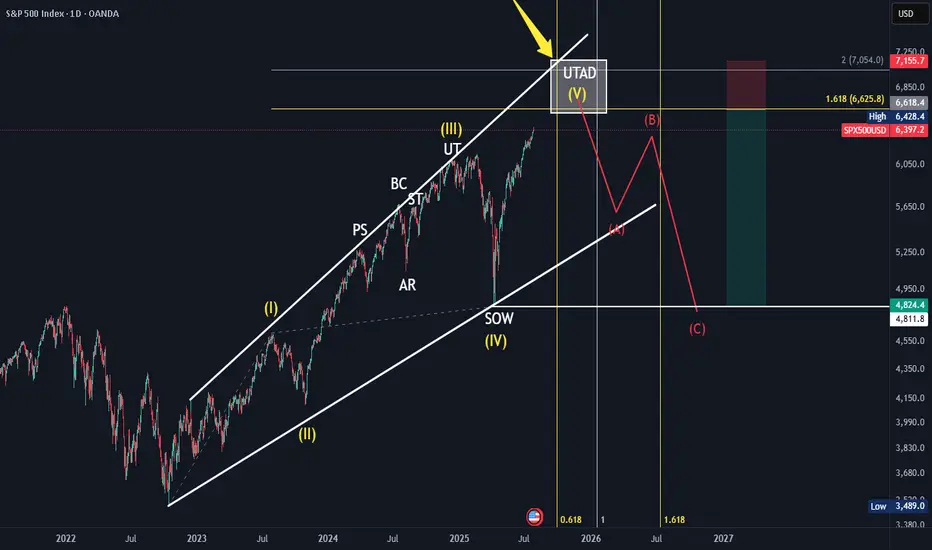
SPX Elliot Wave Count, Wykoff DistributionBased off the HTF elliot wave count aligning and in confluence with a HTF Wykoff distribution. With the top coming in between 6600-7000ish around September 2025 till January 2026. Further confluence with trendline, fibonnacci time and fibonnaci trend and extension.
Soluna Holdings Inc.Stock nearly completed wave b of Expanding Flat correction.
Side C will start up soon 🔊
Target price above 9 $ .
Highly recommended for Buying 👌 and wait .

INJ - Back Bullish!Hello TradingView Family / Fellow Traders. This is Richard, also known as theSignalyst.
📈INJ has been overall bullish trading within the rising wedge pattern marked in blue.
This week, INJ has been retesting the lower bound of the wedge.
Moreover, the green zone is a strong demand.
🏹 Thus, the highlighted blue circle is a strong area to look for buy setups as it is the intersection of the lower blue trendline and green demand.
📚 As per my trading style:
As #INJ approaches the blue circle zone, I will be looking for trend-following bullish reversal setups (like a double bottom pattern, trendline break , and so on...)
📚 Always follow your trading plan regarding entry, risk management, and trade management.
Good luck!
All Strategies Are Good; If Managed Properly!
~Richard Nasr

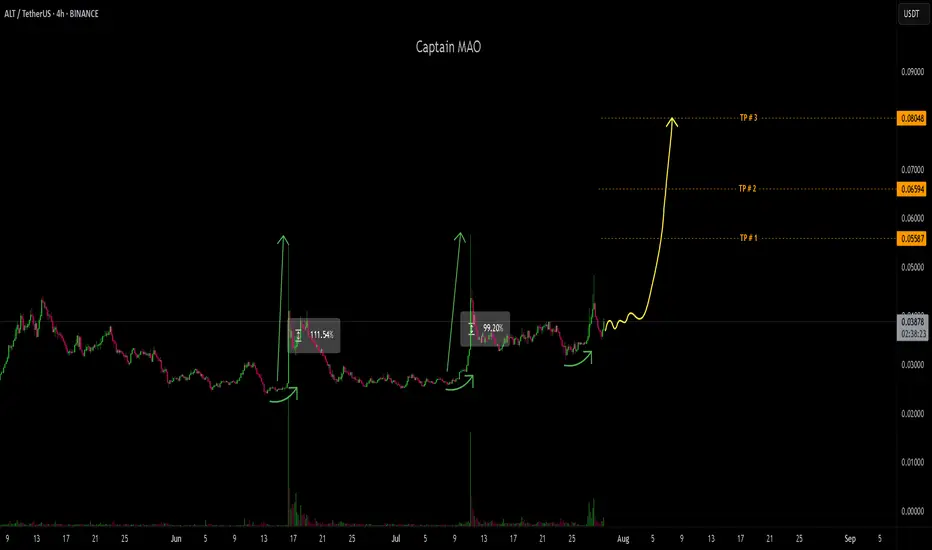
ALT/USDT - Superbullish ALT/USDT is shaping a superbullish market structure, driven by aggressive buyer pressure and consistent demand. Price has repeatedly defended the $0.035 zone, which now stands out as a strong base support—a clear sign of accumulation and market confidence.
This level has acted as a springboard for multiple bullish pushes, with buyers stepping in early and heavily on every dip. The chart suggests that momentum is coiling tightly for an upcoming parabolic move as demand continues to outpace supply.
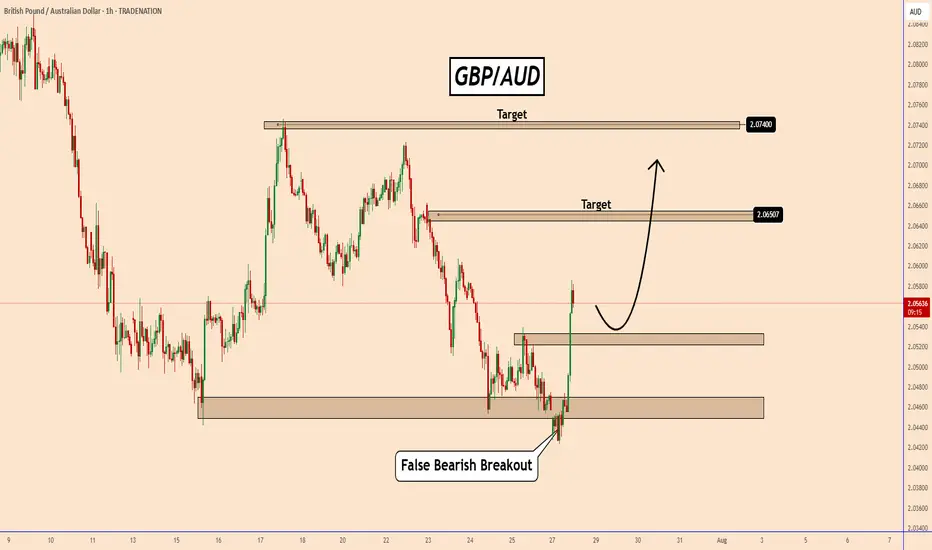
GBPAUD transformed its chart quickly from bearish to bullish!GBPAUD transformed its chart quickly from bearish to bullish!
During the opening of the Market today, GBPAUD created a clear bearish breakout structure and later canceled that breakout.
From the chart we can see a false bearish breakout and GBPAUD is already positioned for a bullish move.
The bullish move is very aggressive and the price increased by almost 135 pips in just 2.5 hours.
After a short pause, GBPAUD should increase further to 2.0650 and 2.0740.
You may find more details in the chart!
Thank you and Good Luck!
PS: Please support with a like or comment if you find this analysis useful for your trading day
Disclosure: I am part of Trade Nation's Influencer program and receive a monthly fee for using their TradingView charts in my analysis.
EUR/USD Latest Update TodayHello everyone, what do you think about FX:EURUSD ?
EUR/USD previously broke the downward price channel, but failed to maintain the momentum, leading to a strong correction phase. Currently, the price is trading around 1.156 and testing key Fibonacci levels, with the 0.5 - 0.618 levels marked as potential reversal zones, as highlighted in the analysis.
With the current market sentiment, the strong recovery of the USD has been the main factor driving the EUR/USD movement in recent days. Positive economic data from the US has strengthened the US dollar, decreasing the appeal of gold and safe-haven assets like the EUR. Furthermore, expectations surrounding Fed policy decisions continue to add pressure on EUR/USD, with investors bracing for the possibility of the Fed maintaining high interest rates for a longer period.
For traders, it's clear that the bearish trend is in favor, as indicated by the EMA reversal. The Fibonacci levels 0.5 (1.164) and 0.618 (1.161) will be crucial zones, where reaction signals could open opportunities for SELL positions. The next target will be at Fib 1 and Fib 1.618.
That's my perspective and share, but what do you think about the current trend of EUR/USD? Leave your comments below this post!

SOLUSD Good Buying Price - Target Weekly ZoneBINANCE:SOLUSDT pullback to weekly level, buying price is good and cheap
Note: Manage your risk yourself, its good trade, see how much your can risk yourself on this trade.
Don't be greedy.
Use proper risk management
Looks like good trade.
Lets monitor.
Use proper risk management.
Disclaimer: only idea, not advice

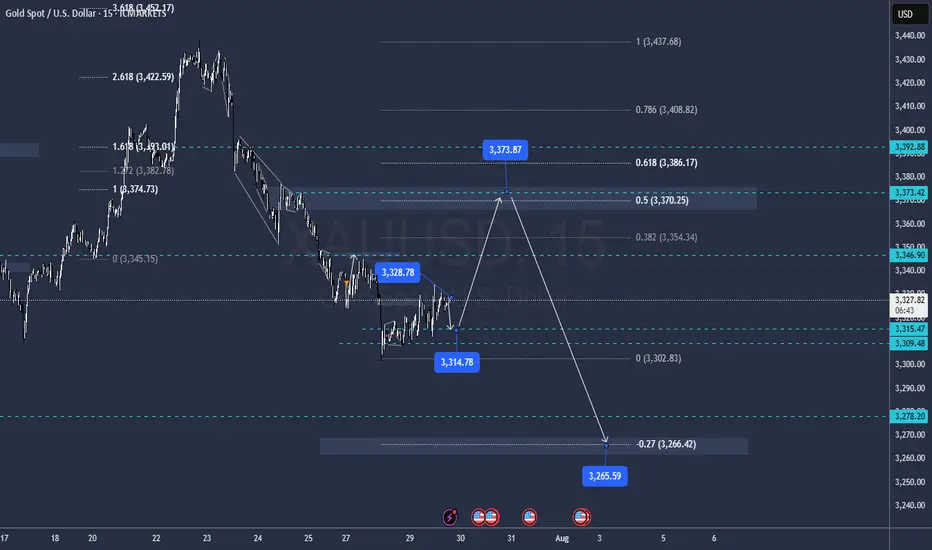
GOLD this snicky GuyTruth be told, im not a big fan of this scenario, its going up mssy but it still looking Bulish, i I have to make a call I will be tking the sell from 3370 and yeah mayb the buy with really, really small risk, but its is up to you
Levels labeled in the chart
GG
ETHUSDT short positionhi traders
🔻 Short Position Setup – Overextended at Resistance
ETH/USDT is currently trading near a major resistance zone (~$4,080–$4,330), which historically marks the top of the trading range. This level has acted as strong resistance multiple times in the past, and price is now showing signs of overextension after a sharp upward move.
📊 Technical Indicators
RSI (14): Currently overbought at 77.44, with the moving average at 81.65 — levels that have previously led to pullbacks.
Volume: Elevated during the move up, but may begin to taper as momentum slows into resistance.
🧭 Trade Strategy: Short From the Top
Entry Zone: Around current levels near $4,080–$4,330
Rationale: Shorting the top of the range with overbought RSI, expecting a retracement or range rejection
🎯 Target Zones (Take-Profit Levels)
We are monitoring multiple support levels for potential profit-taking:
TP1: $3,494
TP2: $3,133
TP3: $2,827
TP4 (max target): $2,354–$2,363
⚠️ Important Note: Although we’ve identified several potential targets, we expect to close the short position earlier — depending on how the price behaves during the retracement. We'll monitor market structure, volume, and lower timeframe signals on the way down.
🛡️ Risk Management
Stop-loss: Above the previous highs (~$4,330), to limit downside risk if the breakout is sustained
Regular monitoring is essential, as macro conditions and ETH sentiment can shift rapidly.
✅ Conclusion:
We're recommending a short trade at the top of a well-defined range, with confirmation from overbought RSI and historical rejection zones. The trade includes multiple targets, but it’s likely to be managed actively and closed partially or fully before reaching the final levels.

BTCUSD IdeaWe are waiting for our asset to reach our action zone, and based on the reaction, we’ll decide on our next moves.ALWAYS WAIT FOR A CONFIRMATION TO SEE IF THE PRICE VALIDATES THE ZONE.and you what is your vision of the EURUSD its interests me! i wait you in the commentary

EURUSD Long Trade - Bounce Back from Monthly SupportFX:EURUSD Long Trade.
EURUSD is Bouncing Back from Monthly Support.
Note: Manage your risk yourself, its risky trade, see how much your can risk yourself on this trade.
Don't be greedy.
Use proper risk management
Looks like good trade.
Lets monitor.
Use proper risk management.
Disclaimer: only idea, not advice

ADAUSD – Recovery, But Below The LineADA broke below the 200 SMA yesterday, selling off from $0.83 into $0.78 before forming a strong reversal pattern. It's now pushing back toward $0.81 resistance, but volume and RSI are showing signs of slowing. A reclaim of $0.8100 could trigger another leg toward $0.8170+. Until then, it’s a fading rally inside a bear structure.

EURGBP Wave Analysis – 29 July 2025- EURGBP reversed from the resistance zone
- Likely fall to support level 0.8635
EURGBP currency pair recently reversed down from the resistance zone between the multi-month resistance level 0.8735 (which stopped sharp wave (A) in April) and the upper daily Bollinger Band.
The downward reversal from this resistance zone created the daily Japanese candlesticks reversal pattern Dark Cloud Cover.
Given the strength of the resistance level 0.8735, EURGBP currency pair can be expected to fall to the next support level 0.8635 (low of the previous minor correction ii).

USDCAD Bullish Breakout!
HI,Traders !
#USDCAD was trading in a
Falling wedge pattern
But now we are seeing a
Bullish breakout so we
Will be expecting a
Further bullish move up !
Comment and subscribe to help us grow !

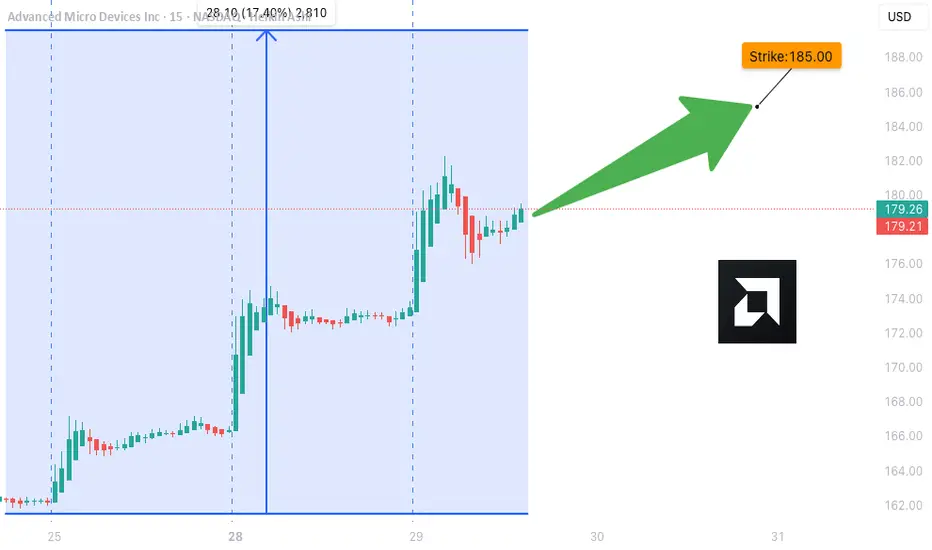
AMD Weekly Trade Alert (2025-07-29)
**🔥 AMD Weekly Trade Alert (2025-07-29) 🔥**
💹 *Momentum Confirmed. Calls Loaded. Let’s Ride.*
📈 **Key Bullish Signals**
✔️ Daily RSI: **83.2** (Rising)
✔️ Weekly RSI: **79.9** (Rising)
✔️ Call/Put Ratio: **2.03** 🧨
✔️ Volatility: Low (VIX = 15.2)
⚠️ Volume Weak (0.9x) – But not a dealbreaker.
---
**🎯 TRADE SETUP**
🔹 **Ticker**: \ NASDAQ:AMD
🔹 **Strategy**: Weekly Naked Call
🔹 **Strike**: \$185C
🔹 **Entry**: \$0.66
🔹 **Profit Target**: \$1.32 (100%)
🔹 **Stop Loss**: \$0.33
🔹 **Expiry**: 2025-08-01
🔹 **Size**: 3 Contracts
🔹 **Confidence**: 75%
---
**🧠 WHY THIS WORKS**
🔋 Momentum → STRONG
💰 Institutions are loading up calls
🧘 VIX = calm
⚡ Short gamma risk = fast payoff or cut
---
📢 **Watchlist it. Trade it. Exit fast.**
💬 Comment “🔥AMD” if you’re in.
🔁 Repost if you see \$190 coming.
\#AMD #OptionsTrading #CallOptions #TradingView #WeeklySetup #MomentumPlay #BullishSignal #MarketMomentum
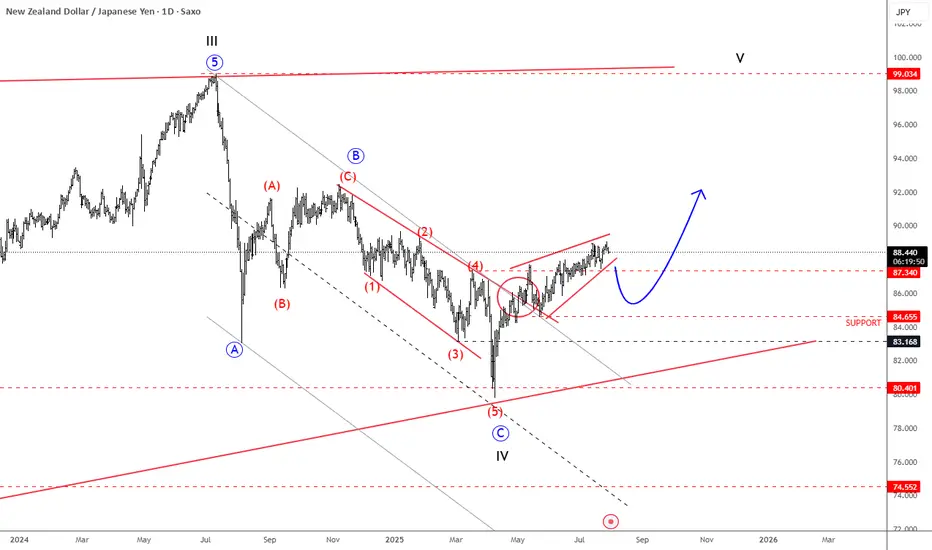
NZDJPY Is Back To Bullish ModeNZDJPY Is Back To Bullish Mode from technical and Elliott wave perspective, as we see it breaking back above trendline after a corrective decline.
NZDJPY is nicely recovering over the last few weeks after a strong rebound from 80.40 support, a key level going back to March 2023. Notice that it’s recovering after a three-wave ABC corrective decline that belongs to a higher degree wave IV correction. Current recovery looks to be in five waves, as a leading diagonal; so its a motive wave structure that already pushed above the 87.34 resistance, which is a strong bullish signal, suggesting more upside ahead. Of course, short-term pullbacks are always possible and welcome, and in that case, the 86 – 84 area could act as a nice support. But overall, we think that sooner or later the pair will target the 90 or even 92 levels, which are still possible this year. Wave V is eyeing even 100 area.
Check the trend A triangle pattern is expected to form within the current support range. Then the start of an uptrend is likely. If the price breaks through the 78.6% level, a continuation of the correction and downtrend is possible.

EURNZD Will Go Down From Resistance! Short!
Here is our detailed technical review for EURNZD.
Time Frame: 6h
Current Trend: Bearish
Sentiment: Overbought (based on 7-period RSI)
Forecast: Bearish
The market is on a crucial zone of supply 1.941.
The above-mentioned technicals clearly indicate the dominance of sellers on the market. I recommend shorting the instrument, aiming at 1.927 level.
P.S
We determine oversold/overbought condition with RSI indicator.
When it drops below 30 - the market is considered to be oversold.
When it bounces above 70 - the market is considered to be overbought.
Disclosure: I am part of Trade Nation's Influencer program and receive a monthly fee for using their TradingView charts in my analysis.
Like and subscribe and comment my ideas if you enjoy them!

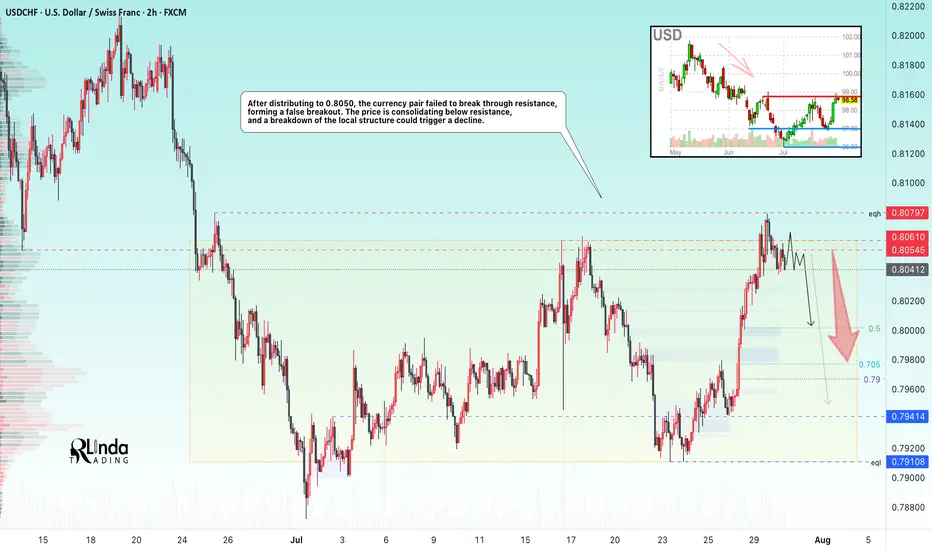
USDCHF → The resistance retest ended with a false breakoutFX:USDCHF tested resistance at 0.805 - 0.806 and formed a false breakout without the possibility of continuing growth. The global trend is downward...
Against the backdrop of the dollar's growth (reaction to news), the currency pair also moved to distribution to 0.8050. The price failed to break through resistance, forming a false breakout. USDCHF is consolidating below resistance, and a breakdown of the local structure could trigger a decline.
The dollar index is also facing fairly strong resistance and may continue its downward trend, which will also affect the decline in the USDCHF price.
Resistance levels: 0.805, 0.806, 0.81
Support levels: 0.800, 0.794, 0.791
If, within the current consolidation, the price begins to fall and break the local structure, then we can expect the decline to continue towards the specified targets!
Best regards, R. Linda!
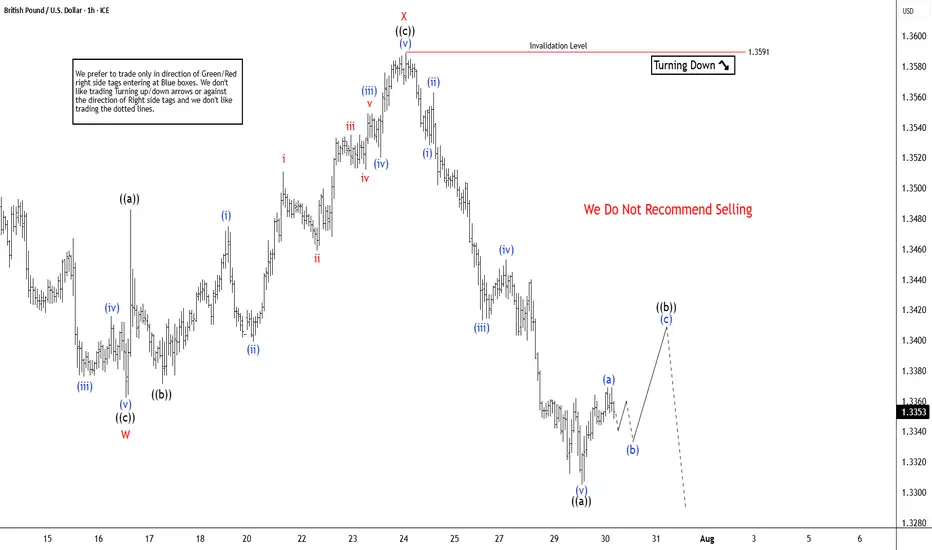
GBPUSD Elliott Wave Insight Bounce Should Fail Into Support ZoneThe GBPUSD is trading in higher high sequence from 9.22.2022 low in weekly. The bounce is corrective Elliott Wave sequence & expect further upside. It favors pullback in proposed 7 swings from 7.01.2025 high & extend into 1.3162 – 1.2898 area, while below 7.23.2025 high. It should find buyers into extreme area for next leg higher in daily or at least 3 swings bounce. In 4-hour, it started correcting lower from 7.01.2025 high. It ended W at 1.3362 low of 7.16.2025 & X at 1.3589 high of 7.23.2025 each in 3 swings. Below X high, it favors downside in Y in 3 swings as it broke below 7.16.2025 low, expecting into extreme area. Within W, it ended ((a)) at 1.3523 low, ((b)) at 1.3620 high & ((c)) at 1.3362 low. Above there, it placed ((a)) at 1.3486 high, ((b)) at 1.3371 low & ((c)) as X connector at 1.3589 high. The double correction unfolds in 3-3-3 structure, which will complete, when current bounce fails below 7.23.2025 high to new low into extreme area. It ended ((a)) of Y into 0.618 – 0.764 Fibonacci extension area of W & expect 3 or 7 swings bounce in ((b)).
Below X high, it placed ((a)) of Y at 1.3305 low & favors bounce in ((b)) in 3 or 7 swings against 7.23.2025 high. Within ((a)), it ended (i) at 1.3528 low, (ii) at 1.3563 high, (iii) at 1.3413 low, (iv) at 1.3543 high & (v) at 1.3305 low. Above there, it favors bounce in (a) of ((b)) and expect small upside before it should pullback in (b). The next pullback in (b) should stay above 1.3305 low choppy price action before continue upside in (c). Ideally, ((b)) can bounce between 1.3413 – 1.3481 area as 0.382 – 0.618 Fibonacci retracement of ((a)) before continuing lower. Wave ((b)) bounce expect to fail below 1.3591 high before extending lower in ((c)) into 1.3162 – 1.2898 to finish double correction. Because of higher high in daily since September-2022 low, it should find buyers in extreme area to resume higher. It expects sideways to higher until FOMC event followed by selloff, while bounce fail below 7.23.2025 high. We like to buy the pullback into extreme area for next leg higher or at least 3 swings reaction.
Dogecoin - It is all totally expected!🐶Dogecoin ( CRYPTO:DOGEUSD ) will break out soon:
🔎Analysis summary:
Just this month, Dogecoin perfectly retested a significant confluence of support and is starting the expected rejection. With bullish momentum picking up, there is a very high chance that Dogecoin will break the all time high in the near future.
📝Levels to watch:
$0.5
🙏🏻#LONGTERMVISION
SwingTraderPhil
