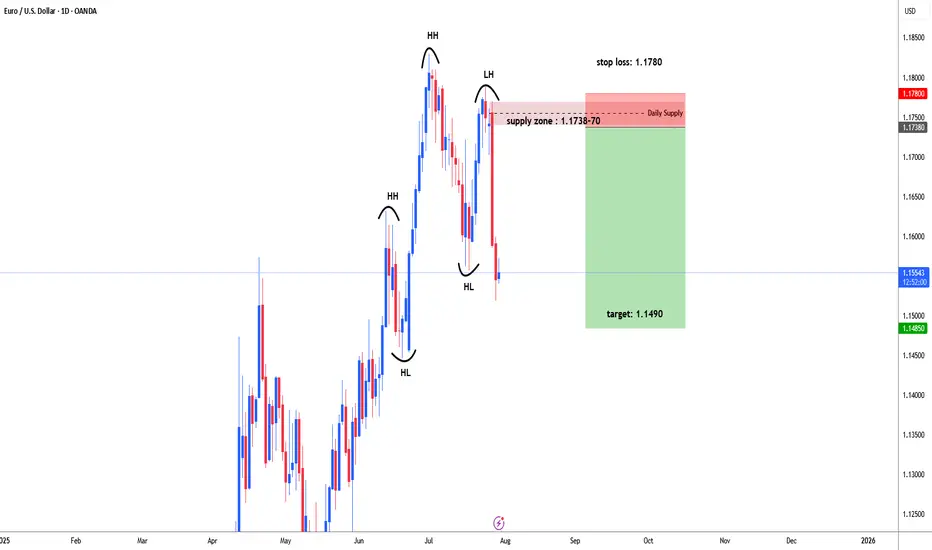
EURUSD possible bearish for 1.1490#EURUSD failed to form higher high and higher low to continue bullish trend. eurusd made a high on 1st July 1.1830, then price started retrace downside. 7th July daily bearish engulfing candle formed , early indication for selling. 23rd July price moved up side to test supply zone. Price did not break high of bearish engulfing candle and fall back. Price started heavily fall and broke recent supply level 1.1557 and form Lower High that is indication for trend reversal.
1.1738-70 ideal level for selling which is daily supply zone. stop loss above 1.1770 i.e. 1780-1.1800. target: 1.1490 and even may expect further down.
Wave Analysis
USD/JPY BEARS ARE GAINING STRENGTH|SHORT
USD/JPY SIGNAL
Trade Direction: short
Entry Level: 147.871
Target Level: 145.815
Stop Loss: 149.230
RISK PROFILE
Risk level: medium
Suggested risk: 1%
Timeframe: 1D
Disclosure: I am part of Trade Nation's Influencer program and receive a monthly fee for using their TradingView charts in my analysis.
✅LIKE AND COMMENT MY IDEAS✅

Will gold continue to fall on July 29:
Comprehensive analysis of the gold market and trading strategy recommendations
News analysis
Short-term support factors
Weakened US dollar: The market is in a wait-and-see mood before the Fed's interest rate meeting, and the US dollar bulls are temporarily suspended, providing support for interest-free assets such as gold.
Safe-haven demand: Policy uncertainty (such as the Fed's interest rate decision) may trigger a short-term return of funds to gold.
Repressive factors
Trade situation easing: The US-EU tariff agreement, US-Japan and US-China trade progress boost risk appetite and weaken the safe-haven appeal of gold.
Bull-bear game: Gold is currently at a balance between "macro game" and "technical adjustment", and needs to wait for the FOMC statement and economic data (GDP, PCE) to guide the direction.
Technical analysis
Long-term trend (monthly/weekly)
Top signal appears: 3 consecutive months of long upper shadows (April-June). If the long upper shadow is closed again in July, it may confirm that the bears are dominant, and the market may drop to the 3000-2950 area in the future.
Key resistance: 3400-3500 area is a historically strong pressure. Even if the Fed cuts interest rates to stimulate the rise, it may form a "lure to buy" and then reverse.
Short-term key position (daily/4 hours)
Bull-short watershed: 3350 is the short-term strong and weak boundary. If it breaks through, it will look up to 3370-3405; if it is under pressure, it will look down to 3330-3290.
Oscillation characteristics: The recent long-short continuity is poor (such as last week's sharp rise and then a sharp drop), so be wary of repeated washes.
Today's operation strategy
Short-order opportunity
Entry area: 3330-3340 (aggressive investors can arrange in batches), stop loss above 3350.
Target position: 3290-3280, look at 3245 after breaking down.
Long-order opportunity
Pullback support: 3290-3280 light position to try long, stop loss below 3270, target 3310-3320 (short-term rebound).
Breakthrough follow-up
Break above 3350: Wait and see if it is a false breakthrough. If it stabilizes, you can buy short-term to 3370-3405 (need to cooperate with the Fed's dovish signal).
Break below 3280: Be cautious when chasing shorts, avoid low-level sweeps, and pay attention to the support of 3245.
Risk warning
Federal Reserve decision: If the interest rate is cut but the "hawkish expectations" are released (such as the subsequent suspension of interest rate cuts), gold may rise and fall.
Data impact: If GDP/PCE is stronger than expected, it may strengthen the US dollar and suppress gold prices.
Summary: At present, gold is in a volatile bearish pattern. It is recommended to sell short at the rebound high as the main trading idea, and strictly stop loss. Conservatives can wait for the trend to become clear after the Fed's decision before making a layout.
XAUUSD idea 29/07/25We are waiting for our asset to reach our action zone, and based on the reaction, we’ll decide on our next moves.ALWAYS WAIT FOR A CONFIRMATION TO SEE IF THE PRICE VALIDATES THE ZONE.and you what is your vision of the EURUSD its interests me! i wait you in the commentary

Gold Under Pressure – Temporary Pullback or Start of a DowntrendHello everyone, great to see you again.
Today, let’s focus on the bearish factors surrounding gold. At the time of writing, gold is trading around 3,331 USD, down 50 pips on the day, continuing its downward correction since the end of last week.
Within just a few days, gold has plunged from its peak of 3,433 USD—losing nearly 100 USD per ounce.
This sharp drop is largely driven by profit-taking and market anticipation ahead of key economic data next week, including U.S. interest rate decisions, inflation, and job reports.
This week is packed with critical updates: growth figures, inflation stats, employment numbers, and monetary policy decisions from major central banks—all of which could significantly impact gold’s next move.
According to a recent survey, 36% of analysts expect gold to fall further, while retail investors remain optimistic about a rebound.
For now, the market is clearly in a correction phase. Caution is advised.
What do you think—will gold bounce back or continue to drop?

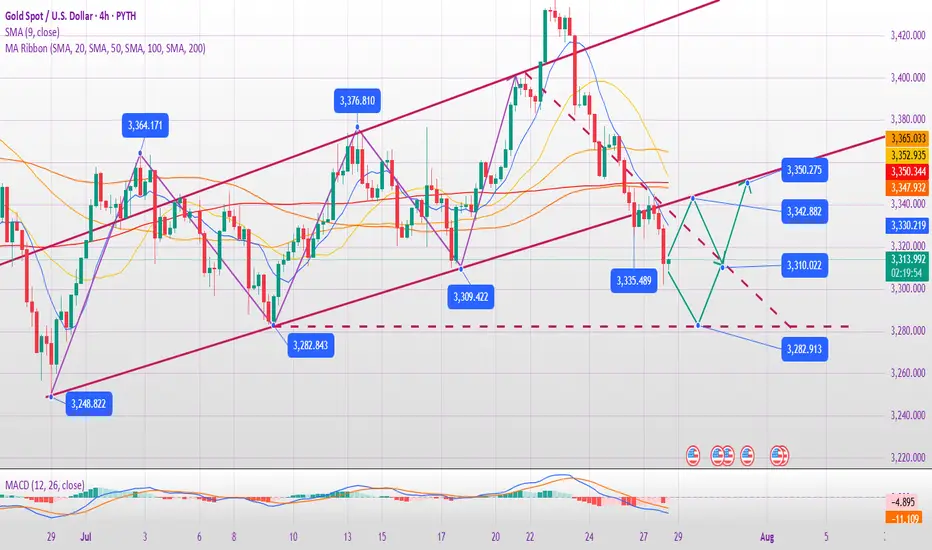
Hellena | GOLD (4H): LONG to resistance area of 3440 (Wave V).As you can see, everything turned out to be more complicated than I had previously thought. We are dealing with a complex correction and a diagonal. I believe that the “ABCDE” waves, which make up the corrective wave “4”, are completing their levels, and I continue to expect the upward movement to continue.
The first area I expect is the resistance area of 3440. This will be the beginning of the large upward wave “V.”
Manage your capital correctly and competently! Only enter trades based on reliable patterns!

Ethereum Long: Using Log Chart to Analyze, Target $6600In this video, I go through the analysis using the log chart for Ethereum and shows the potential of this cryptocurrency where I expect the price to reach new high in the coming days with a longer-term target of $6600.
For shorter-term trading, I recommend placing the stop a distance below recent support on the daily chart, around $3372.
Good luck!

Elliott Wave Update: EURUSD Favors Weakness In To Support ZoneThe EURUSD favors upside in 3 swings from September-2022 low & should extend towards 1.1929 or higher against 1.13.2025 low. In 4-hour, it favors double correction lower from 7.01.2025 high to correct 5.12.2025 low. It favors short term pullback into 1.1512 – 1.1340 area in 7 swing pullbacks before continue rally in cycle from 1.13.2025 low. Above January-2025 low, it ended (1) at 1.0533 high, (2) at 1.0210 low, (3) at 1.1573 high, (4) at 1.1065 low & favors higher in (5). Within 4-hour, it placed 1 at 1.1830 high & correcting in 2 as double three correction before two more highs. It placed ((w)) at 1.1559 low in 3 swings zigzag correction. In ((w)), it ended (a) at 1.1659 low, (b) at 1.1714 high & (c) at 1.1559 low of 7.16.2025. Later, it unfolded expanded flat correction in ((x)) that ended at 1.1788 high of 7.24.2025. Within ((x)), it placed (a) at 1.1721 high, (b) at 1.1554 low & (c) in 5 swings at 1.1788 high.
Currently, it favors downside in ((y)) of 2 & expect sideways to lower in to support zone. It favors zigzag correction lower in ((y)) to finish 2 into extreme area before resume rally. Short term, it favors downside in (a) of ((y)) since 7.24.2025 high. In (a), it placed i at 1.1700 low, ii at 1.1771 high & favors downside in iii of (a) towards 1.1576 – 1.1569 area before bounce in iv. It expects a bounce soon in iv followed by one more push lower in v to finish (a) in 5 swings. Wave (a) of ((w)) should end near 1.1578 before bounce in (b) in 3 or 7 swings connector. The bounce in (b) should fail below 1.1788 high to extend lower in (c) into 1.1512 – 1.1340 area to finish correction. It should find next support into that area to rally higher as the part of daily sequence targeting 1.1929 or higher. We like to buy in to that area for next leg higher or at least 3 swings bounce. If it breaks above 7.01.2025 high, it expects two more highs to finish cycle from January-2025 before next pullback start.

#MYRO/USDT myro road map ( 1 H )#MYRO
The price is moving within an ascending channel on the 1-hour frame, adhering well to it, and is poised to break it strongly upwards and retest it.
We have support from the lower boundary of the ascending channel, at 0.02040.
We have a downtrend on the RSI indicator that is about to break and retest, supporting the upward move.
There is a key support area in green at 0.02020, which represents a strong basis for the upward move.
Don't forget one simple thing: ease and capital.
When you reach the first target, save some money and then change your stop-loss order to an entry order.
For inquiries, please leave a comment.
We have a trend of stability above the Moving Average 100.
Entry price: 0.02040
First target: 0.02140
Second target: 0.02200
Third target: 0.002276
Don't forget one simple thing: ease and capital.
When you reach the first target, save some money and then change your stop-loss order to an entry order.
For inquiries, please leave a comment.
Thank you.

Gold Alert: Key Levels for Potential Sell Setup!Good morning, my friends 🌞
Here’s today’s gold analysis. I'm expecting a decline in gold prices, specifically from the 3,383–3,420 level.
Once a correction starts around that zone, my target will be 3,310. Gold has been riding a strong uptrend, and if we reach those levels, I’ll be expecting a pullback and opening a sell position accordingly.
Please set your stop loss based on your personal margin preferences.
Your likes and support are my biggest motivation for continuing to share these analyses. Thank you to everyone showing appreciation 🙏

XRP: PullbackRipple’s XRP has once again seen a significant pullback since last Monday, raising the possibility that the high of turquoise wave B may already be in. For now, however, we continue to allow room for this corrective move to extend up to resistance at $4.09, before turquoise wave C drives the altcoin lower toward the magenta wave (2) low. With XRP still trading well above the $0.38 support level, the next upward impulse—magenta wave (3)—should then begin to take shape. Alternatively, there is a 33% chance that this bullish move has already started; however, this scenario would only be confirmed by a decisive break above the $4.09 level.
📈 Over 190 precise analyses, clear entry points, and defined Target Zones - that's what we do (for more: look to the right).

Meta - The breakout in question?🪓Meta ( NASDAQ:META ) is retesting major structure:
🔎Analysis summary:
After Meta perfectly retested a major previous support trendline in 2022, the trend shifted bullish. We have been witnessing an incredible rally of about +700% with a current retest of the previous all time highs. Time will tell but a bullish breakout remains quite likely.
📝Levels to watch:
$750
🙏🏻#LONGTERMVISION
Philip - Swing Trader

CARDANO (ADAUSD): Bullish Move Ahead!
ADA is testing a key daily support cluster.
I think the market is going to bounce from that
and continue growing.
Next resistance - 0.97
❤️Please, support my work with like, thank you!❤️

XAUUSD CAN FLY HIGHXauusd market running in side from last few days now market will touch the support zone so if you to buy gold then you have to good oppourtanity to buy from support level
TRADE AT YOUR OWN RISK
REGARD ALBERT

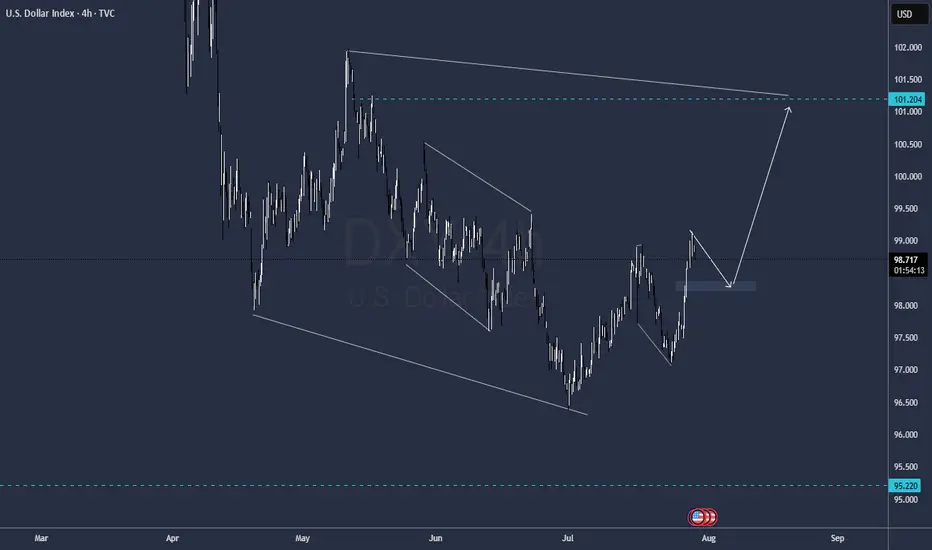
DXY FOMC FORECASTCristal Clear structure to me, dolar down today before FOMC and then up wild
Levels highlighted
Najors Gold and Cryptos will follow the same behavior
GG
XAUUSD: Market Analysis and Strategy for July 29Gold Technical Analysis:
Daily chart resistance: 3345, support: 3285
4-hour chart resistance: 3340, support: 3300
1-hour chart resistance: 3330, support: 3308.
After last week's sharp decline, gold continued its decline yesterday, breaking below its opening low and continuing its downward trend, reaching a low near 3300. In the short term, selling pressure is strong, but the rebound is weak, with a rebound high of 3330.
In terms of intraday trading, yesterday's low of 3301 was followed by a rebound. Focus on the resistance range of 3330-3338. Selling is recommended if the price is trading sideways between 3330-3338, with a defense of 3340. If it falls below 3300, the next target will be 3285.
Sell: 3338
Buy: 3302
Sell: 3300

XRPUSDT Buy Pullback to Weekly LevelBINANCE:XRPUSDT pullback to weekly level.
Note: Manage your risk yourself, its good trade, see how much your can risk yourself on this trade.
Don't be greedy.
Use proper risk management
Looks like good trade.
Lets monitor.
Use proper risk management.
Disclaimer: only idea, not advice

EURGBP Bearish Breakout!
HI,Traders !
#EURGBP broke the rising
Support line and the breakout
Is confirmed so we are
Bearish biased and we
Will be expecting a
Further move down !
Comment and subscribe to help us grow !

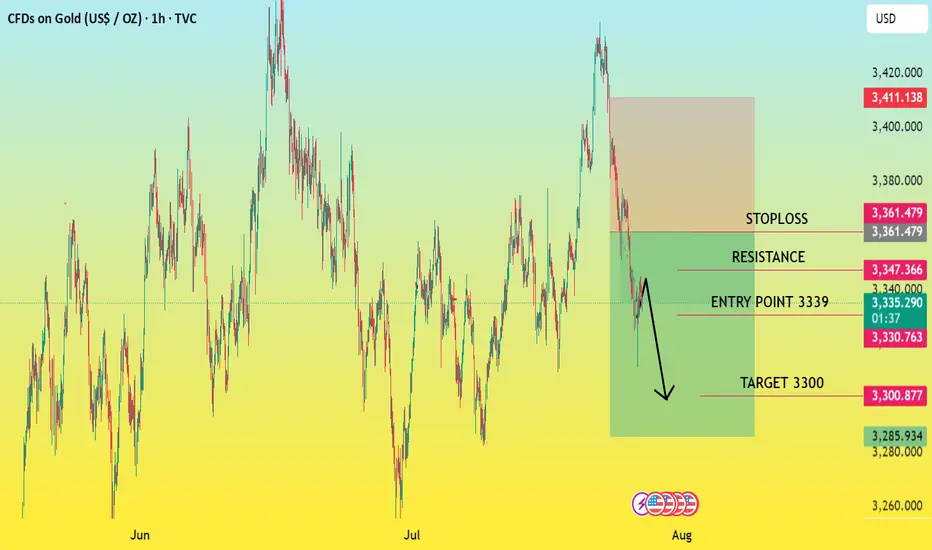
EU-US Tariff Deal Dims Safe-Haven Glow.FUNDAMENTAL ANALYSIS
Attention Traders! The tides are turning in the gold market, and smart money is positioning for a decline. With the recent breakthrough EU-US tariff deal, global trade tensions are easing, systematically eroding gold's appeal as a safe-haven asset. This pivotal shift is creating a compelling selling opportunity.
Risk-On Sentiment: The 15% tariff framework, significantly lower than initial threats, has brought a wave of optimism to the markets. As confidence in global stability grows, investors are rotating out of safe havens like gold and into riskier, higher-yielding assets, putting downward pressure on gold prices.
Diminished Uncertainty: Gold thrives on uncertainty. The clarity provided by the tariff agreement removes a major geopolitical overhang, lessening the need for a hedge against economic instability.
Focus Shifts: With trade concerns subsiding, the market's attention is now firmly on central bank policy and economic data. While a weaker dollar might offer some limited support, the overarching narrative is one of reduced safe-haven demand.
Your Opportunity:
Our analysis suggests a clear downtrend. We are observing strong sell signals from $3339 down to $3300. This is your moment to ride the wave of shifting market dynamics.
Don't miss out on this strategic move. Position yourselves to profit as gold's safe-haven luster fades in the wake of renewed global trade optimism!
ENTRY POINT 3339
TARGET 3300
RESISTANCE 3352-48
STOPLOSS 3361
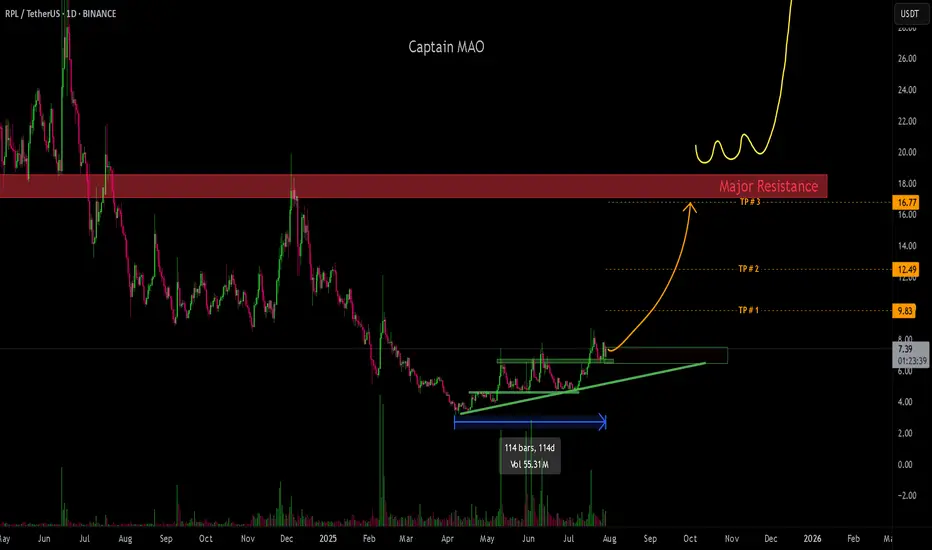
RPL/USDThas spent over 100 days in consolidation, and is now beginning to break through major resistance levels, signaling a structural shift in momentum. Price is currently forming a new base support above the breakout zone, indicating strong buyer interest and commitment to higher prices.
This behavior reflects a classic breakout-retest pattern, where bulls defend newly claimed levels, aiming to build a bullish continuation structure. With market strength aligning, RPL looks poised for a sustained upcoming rally.
Potential 33% gain in ELVELV has a potential for a reversal for potentially 33% gain.
Using the Data Distribution with Extreme Clusters custom indicator, we can see that the stock is overextended on both the 5D chart (longer term) and 1D (shorter term) chart.
The last weekly bar ended up on a very high volume. Looking at the trends, one thing that is often noticeable, is that moves end and begin on large volume. Since it is down 40% off its highs, coupled with large volume, there is a possibility that the stock will reverse.
Zero-Lag USI on 1D chart is showing a buy signal as the background changed to green, while Zero-Lag USI on 5D chart is showing a black background, which means that there is a possibility that momentum of the stock may change.

EURUSD BUYEUR/USD retreats below 1.1550 ahead of US data
EUR/USD finds it difficult to stage a rebound following Monday's sharp decline and trades in negative territory below 1.1550 on Tuesday. The US Dollar (USD) preserves its strength ahead of consumer sentiment and employment-related data releases, weighing on the pair.
From a technical point of view, the EUR/USD pair is poised to extend its slump. It keeps falling below a mildly bearish 20 Simple Moving Average (SMA), which provides dynamic resistance at around 1.1690. The 100 SMA, in the meantime, maintains its bullish slope, albeit partially losing its upward strength at around 1.1340. Finally, technical indicators keep heading south well below their midlines, and at multi-week lows, in line with a bearish extension ahead.
The near-term picture shows EUR/USD is oversold and may bounce or consolidate before the next directional move. In the 4-hour chart, technical indicators turned flat at extreme levels, yet it keeps developing below all its moving averages, which skews the risk to the downside. A firmly bearish 20 SMA is crossing below the 100 SMA and aims to extend its slide below a directionless 200 SMA, usually a sign of prevalent selling interest.
SUPPORT 1.15566
SUPPORT 1.15819
SUPPORT 1.15566
RESISTANCE 1.15114

EUR/USD: Is the Next Big Correction Already Underway?EUR/USD: After 120 Days Up, Are We Entering a Year-Long Correction? What Market Cycles Reveal.
As EUR/USD traders digest the stunning 120-day, five-wave rally from the January 2025 lows to the July 2025 highs, the big question now is—what's next? The clues are right in front of us, and they suggest we may be headed into an extended corrective phase, one that could last until the very start of 2026.
What the Current Structure Shows
Motive Wave Complete: The impulsive surge just wrapped up a textbook five-wave move, with each leg unfolding cleanly and culminating in a July top. Motive waves like this are the engines of market trends—fast-moving, decisive, and packed with momentum.
Corrective Phase Incoming: But all trends eventually pause, and here the evidence points to a shift. Corrective waves—unlike their trending counterparts—are time-consuming, choppy, and have a tendency to frustrate impatient traders. The completed motive wave took just 120 days, but corrections often take much longer to play out. According to this chart, the probable timeline for this correction extends into December 2025, or possibly beyond.
Why the Count Is Labelled This Way
Wave Duration Clue: One of the most reliable Elliott Wave principles is that corrective phases outlast the sharp, high-energy motive moves that precede them. With the motive wave spanning four months, a comparable correction stretching into late 2025 makes perfect structural sense.
Cycle Awareness, Major Turning Points, and MACD Divergence:
Flip to the weekly turning points chart, and a deeper pattern emerges: Major EUR/USD direction changes consistently cluster around the start of a new year, with minor tops and bottoms often forming near mid-year. Over the last eight years, six out of seven major pivots have landed at those cycle pivots.
Notably, if you look at the weekly chart’s MACD, there’s now a clear bearish divergence—while price clocked new highs into July, the MACD failed to confirm, rolling over and diverging lower. This kind of momentum divergence at a major turning point is classic for trend exhaustion and aligns perfectly with the idea that a correction is not only likely, but perhaps overdue.
This powerful confluence—timing, price structure, and momentum—underscores just how much “cycle” and structure awareness can add to your trading playbook.
What to Watch Next (Trade Planning)
Timing the Correction: If the correction follows historical precedent, expect sideways or choppy price action well into Q4 2025, with the next big directional opportunity around the calendar turn into 2026.
Cycle-Based Strategies: Recognising these cycles lets you prepare for reversals, especially if price is diverging from the MACD at those major timing windows.
Structure > Prediction: The motive phase is where you ride the trend; cycles, structure, and momentum help you avoid exhaustion traps and see when patience is required.
