OLA ELECTRIC Some buy pattern show in Ola Electric in weekly pattern.
So can be buy after close above 41.96 (W).
Try to exit, if close continues below 40.4 or 39.6 (W).
Wave Analysis


Basics of Options: Calls and PutsWhat are Options?
An option is a financial contract that gives the buyer the right, but not the obligation, to buy or sell an underlying asset (like a stock or index) at a specific price, on or before a specific date.
Think of it like booking a movie ticket. You reserve the right to watch a movie at a particular time and seat. But if you don’t go, it’s your choice. You lose the ticket price (premium), but you're not forced to go. Options work similarly.
Options are of two basic types:
Call Option
Put Option
Let’s break both down in detail.
1. What is a Call Option?
A Call Option gives the buyer the right (but not the obligation) to buy the underlying asset at a pre-decided price (called the strike price) on or before a certain date (called the expiry date).
When do traders buy a Call Option?
When they believe the price of the underlying stock or index will go up in the future.
Example of Call Option (Simple Case)
Let’s say you are bullish on Reliance Industries stock, which is currently trading at ₹2,500.
You buy a Call Option with:
Strike Price: ₹2,550
Premium Paid: ₹30 per share
Lot Size: 250 shares
Expiry: Monthly expiry (say end of the month)
You believe Reliance will go up beyond ₹2,550 soon. If it goes to ₹2,600 before expiry:
Your profit per share = ₹2,600 (market price) - ₹2,550 (strike price) = ₹50
Net Profit = ₹50 - ₹30 (premium) = ₹20 per share
Total Profit = ₹20 x 250 = ₹5,000
But if Reliance stays below ₹2,550, say at ₹2,500 on expiry, you won’t exercise the option. You lose only the premium (₹30 x 250 = ₹7,500).
Key Terminologies in Call Options
In the Money (ITM): When the stock price is above the strike price.
At the Money (ATM): When the stock price is equal to the strike price.
Out of the Money (OTM): When the stock price is below the strike price.
2. What is a Put Option?
A Put Option gives the buyer the right (but not the obligation) to sell the underlying asset at a pre-decided price (strike price) on or before the expiry.
When do traders buy a Put Option?
When they believe the price of the underlying stock or index will fall in the future.
Example of Put Option (Simple Case)
Assume HDFC Bank is trading at ₹1,600. You are bearish and expect it to fall.
You buy a Put Option with:
Strike Price: ₹1,580
Premium: ₹20 per share
Lot Size: 500 shares
Expiry: Monthly
If HDFC Bank falls to ₹1,520:
You can sell at ₹1,580 even though market price is ₹1,520
Gross profit per share = ₹60
Net profit = ₹60 - ₹20 = ₹40 per share
Total profit = ₹40 x 500 = ₹20,000
If HDFC stays above ₹1,580, your put expires worthless. You lose only the premium (₹10,000).
Key Terminologies in Put Options
In the Money (ITM): Stock price below strike price.
At the Money (ATM): Stock price = strike price.
Out of the Money (OTM): Stock price above strike price.
Who are the Two Parties in an Option Contract?
1. Option Buyer (Holder)
Pays the premium
Has rights, but not obligations
Can exercise the option if profitable
Loss is limited to the premium paid
2. Option Seller (Writer)
Receives the premium
Has obligation to fulfill the contract if the buyer exercises
Risk is unlimited for call writers and limited for put writers (if stock price becomes zero)
Profit is limited to the premium received
Difference between Call and Put Options (Summary Table)
Feature Call Option Put Option
Buyer’s Expectation Bullish (price will go up) Bearish (price will go down)
Right Buy at strike price Sell at strike price
Profit Potential Unlimited Limited (until price reaches zero)
Risk (for buyer) Limited to premium Limited to premium
Seller’s Role Sells call & hopes price won’t rise Sells put & hopes price won’t fall
Premium and What Influences It?
The premium is the price you pay to buy an option. This is influenced by:
Intrinsic Value: Difference between market price and strike price
Time Value: More days to expiry = higher premium
Volatility: Higher the volatility = higher the premium
Interest Rates and Dividends
What is Strike Price and Expiry?
Strike Price: The price at which you can buy (call) or sell (put) the underlying stock
Expiry: The last date till which the option is valid. In India:
Weekly expiry for Nifty, Bank Nifty, and FINNIFTY
Monthly expiry for stocks
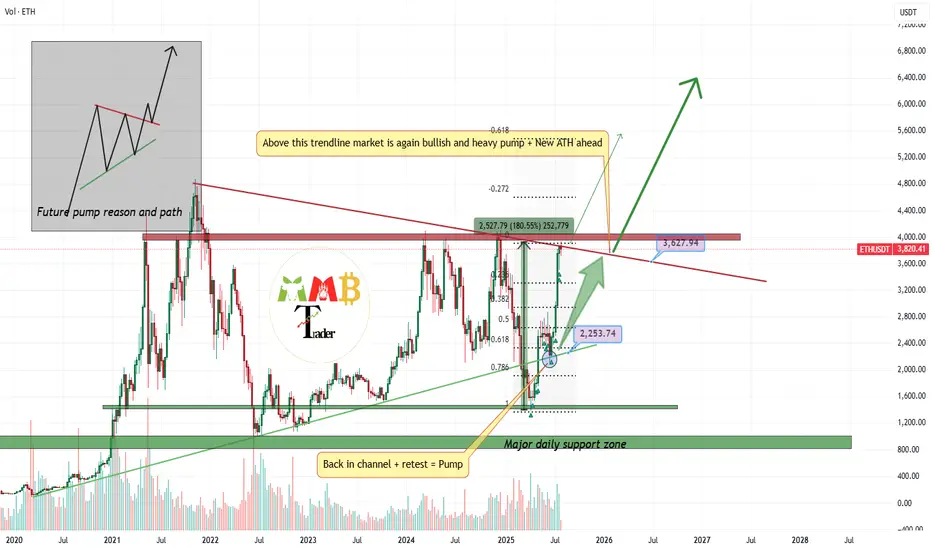
4000$ is last resistance left Ready for breakout and pump?market is still bullish and i am looking for breakout here to the upside for sure But we should consider this factor that major resistance now is touching and we may have first short-term fall.
so for now we may have correction and dump to the targets like 3300$ which is first support of 0.23 Fibonacci level.
and after this healthy correction or without it we can expect more pump and breakout of 4K$ and heavy pump to the targets like 7K$.
DISCLAIMER: ((trade based on your own decision))
<<press like👍 if you enjoy💚
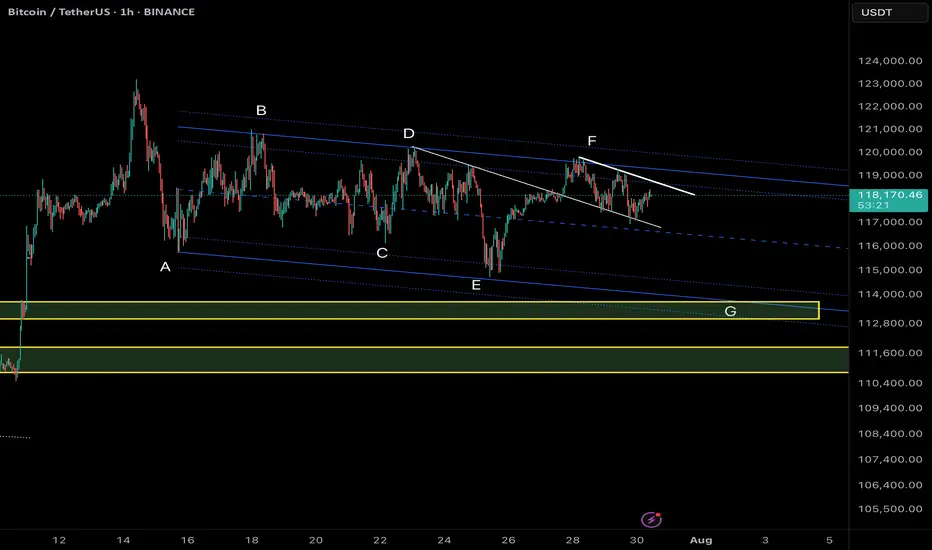
Bitcoin (BTCUSDT) - Possible Completion of a Complex CorrectionTimeframe: 4H + 1H
Methodology: NeoWave (Glen Neely) + Smart Money Concepts (ICT/SMC)
Posted by: @CryptoPilot
⸻
🧠 NeoWave Analysis: Complex Correction Ending?
From a NeoWave perspective, BTC seems to be in the final stages of a Complex Correction that started in March 2025 from ~72k. The upward move appears to form a Contracting Diametric structure (7 legs: A–B–C–D–E–F–G), with the current leg G potentially unfolding now.
• ✅ Wave A: Sharp recovery from March lows
• ✅ Waves B–F: Alternating corrective legs with varied time and complexity
• 🔄 Wave G: Could be starting now, expected to break structure to the downside
This suggests that the entire move from March till now may represent a large Wave B, setting the stage for a deeper Wave C down.
⸻
🔍 Price Action + Smart Money Confluence
The following observations strengthen the NeoWave scenario:
• 🟨 Liquidity Pools above 120k were swept recently, creating a potential Buy-side Liquidity Grab
• 🟥 Imbalance/FVGs below 114.5k remain unfilled
• 🔻 Market Structure Shift (MSS) evident on 1H chart — lower highs forming
• 🧠 Price rejected from a key Supply Zone, aligning with end of Wave F
• 🟩 If price re-tests the internal bearish OB (near 119.5k–120k), it may provide an ideal short trigger
⸻
📌 Key Levels to Watch:
Level
Description
120.2k
Liquidity sweep zone / MSS confirmed
118k
Current structure base (pivot)
114.5k
FVG + potential Wave G target
111–112k
Strong demand zone (accumulation support)
🧭 Scenario Outlook:
Primary:
→ Price is in Wave G of a Diametric (NeoWave)
→ Likely to unfold as a 3-leg Zigzag down or a Complex combination
→ Objective: break below Wave E low and target the unmitigated imbalances
Alternative:
→ Extended Flat or Triangle, if 120.5k is broken impulsively
→ Invalidation = clean break and hold above 121k
⸻
⚠️ Risk Note:
This analysis assumes Wave G is beginning. If bulls manage to reclaim 120.5k with momentum and close above, the bearish structure will be invalidated.
⸻
💬 Final Thought:
We are potentially nearing the end of a complex corrective rally. The confluence of NeoWave structural symmetry, Smart Money traps, and market inefficiencies suggests that BTC may be preparing for a retracement. Stay alert for confirmations before executing.
⸻
📌 Follow @CryptoPilot for advanced wave structure updates, market geometry insights, and ICT-style smart money traps.
💬 Share your views or alternate wave counts in the comments!
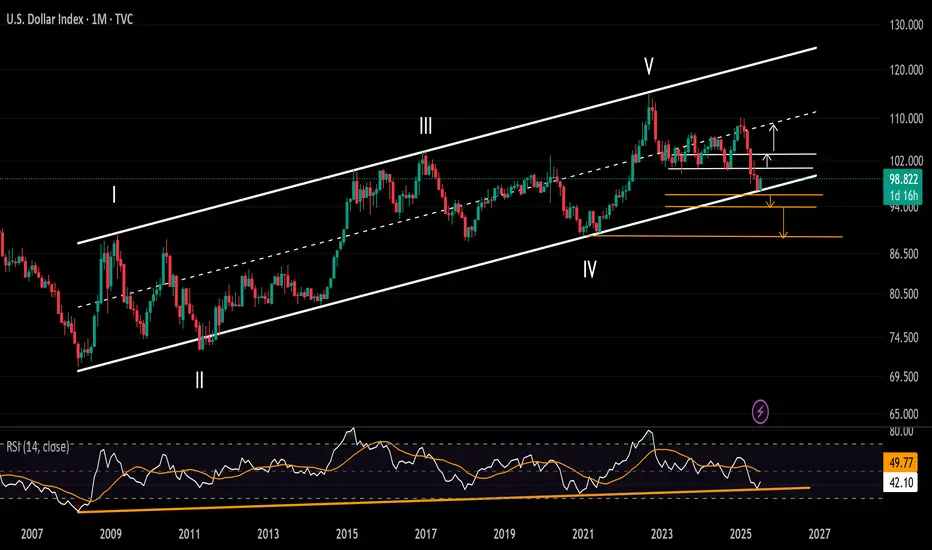
DXY Surge Pressures Currency Market in Volatile Market WeekThe US Dollar Index (DXY) has held its rebound off historical support zones on both the price chart and the RSI indicator throughout July. The monthly RSI is bouncing off a support line extending between the troughs of 2008 and 2020. Meanwhile, price action is rebounding from a support trendline that connects the lows of 2008, 2014, and 2021, within the 96–94 zone.
Bearish Scenario: A solid close below this support zone may confirm a long-term bearish signal, potentially pushing the index toward the 94 and 90 levels.
Bullish Scenario: A confident move above 100 and 103 could signal a reversal in the currency market, potentially leading the DXY back toward the mid-range of the long-standing channel between 105 and 107, originating from the 2008 lows.
Written by Razan Hilal, CMT
BITCOIN Will Move Higher! Long!
Take a look at our analysis for BITCOIN.
Time Frame: 2h
Current Trend: Bullish
Sentiment: Oversold (based on 7-period RSI)
Forecast: Bullish
The price is testing a key support 118,043.14.
Current market trend & oversold RSI makes me think that buyers will push the price. I will anticipate a bullish movement at least to 119,900.74 level.
P.S
The term oversold refers to a condition where an asset has traded lower in price and has the potential for a price bounce.
Overbought refers to market scenarios where the instrument is traded considerably higher than its fair value. Overvaluation is caused by market sentiments when there is positive news.
Disclosure: I am part of Trade Nation's Influencer program and receive a monthly fee for using their TradingView charts in my analysis.
Like and subscribe and comment my ideas if you enjoy them!

USDCAD Is Bearish! Sell!
Please, check our technical outlook for USDCAD.
Time Frame: 7h
Current Trend: Bearish
Sentiment: Overbought (based on 7-period RSI)
Forecast: Bearish
The market is trading around a solid horizontal structure 1.377.
The above observations make me that the market will inevitably achieve 1.369 level.
P.S
We determine oversold/overbought condition with RSI indicator.
When it drops below 30 - the market is considered to be oversold.
When it bounces above 70 - the market is considered to be overbought.
Disclosure: I am part of Trade Nation's Influencer program and receive a monthly fee for using their TradingView charts in my analysis.
Like and subscribe and comment my ideas if you enjoy them!

GBPJPY Is Very Bearish! Sell!
Please, check our technical outlook for GBPJPY.
Time Frame: 7h
Current Trend: Bearish
Sentiment: Overbought (based on 7-period RSI)
Forecast: Bearish
The market is trading around a solid horizontal structure 199.004.
The above observations make me that the market will inevitably achieve 198.074 level.
P.S
Please, note that an oversold/overbought condition can last for a long time, and therefore being oversold/overbought doesn't mean a price rally will come soon, or at all.
Disclosure: I am part of Trade Nation's Influencer program and receive a monthly fee for using their TradingView charts in my analysis.
Like and subscribe and comment my ideas if you enjoy them!

SILVER SENDS CLEAR BEARISH SIGNALS|SHORT
SILVER SIGNAL
Trade Direction: short
Entry Level: 3,820.7
Target Level: 3,794.3
Stop Loss: 3,837.9
RISK PROFILE
Risk level: medium
Suggested risk: 1%
Timeframe: 1h
Disclosure: I am part of Trade Nation's Influencer program and receive a monthly fee for using their TradingView charts in my analysis.
✅LIKE AND COMMENT MY IDEAS✅

EURUSD(20250730) Today's AnalysisMarket News:
According to a Reuters/Ipsos poll, Trump's approval rating has fallen to 40%, the lowest level since his second term.
Technical Analysis:
Today's Buy/Sell Levels:
1.1554
Support and Resistance Levels:
1.1634
1.1604
1.1584
1.1523
1.1504
1.1474
Trading Strategy:
If the price breaks above 1.1584, consider entering a buy position, with the first target price at 1.1604. If the price breaks below 1.1554, consider entering a sell position, with the first target price at 1.1523.

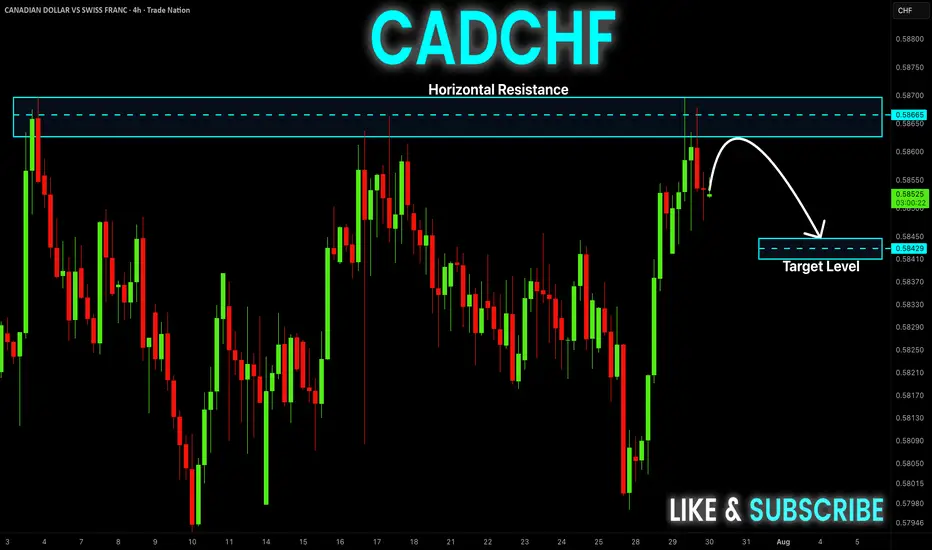
CAD-CHF Local Short! Sell!
Hello,Traders!
CAD-CHF went up and
Made a retest of the
Horizontal resistance
Around 0.5870 and we
Are already seeing a bearish
Pullback so we will be
Expecting a further
Bearish correction
Sell!
Comment and subscribe to help us grow!
Check out other forecasts below too!
Disclosure: I am part of Trade Nation's Influencer program and receive a monthly fee for using their TradingView charts in my analysis.
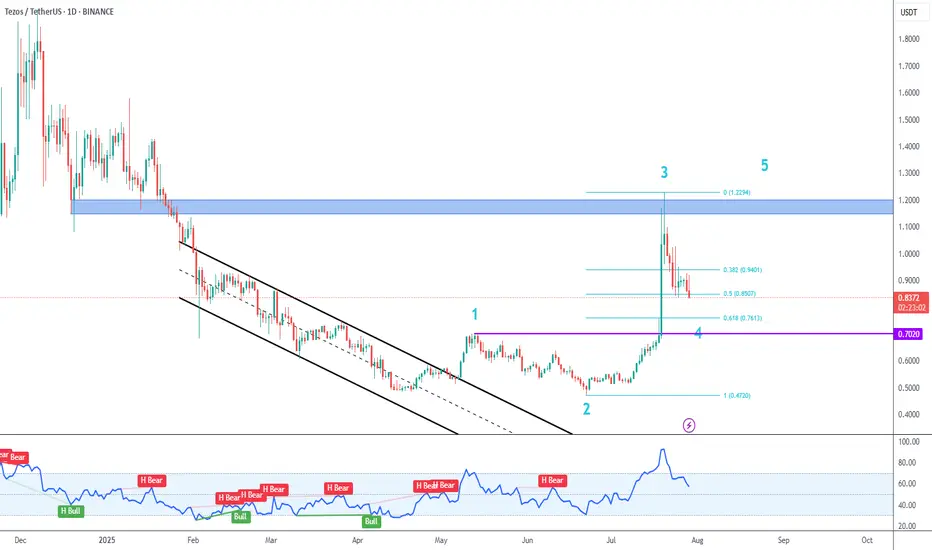
XTZ Motive Wave
After breaking the black descending channel price made waves 1/2 and pumped to the upside for wave 3, where it was held by the blue resistance zone.
We are now in wave 4 correction, and I am waiting for reversals in smaller timeframes for long trades.
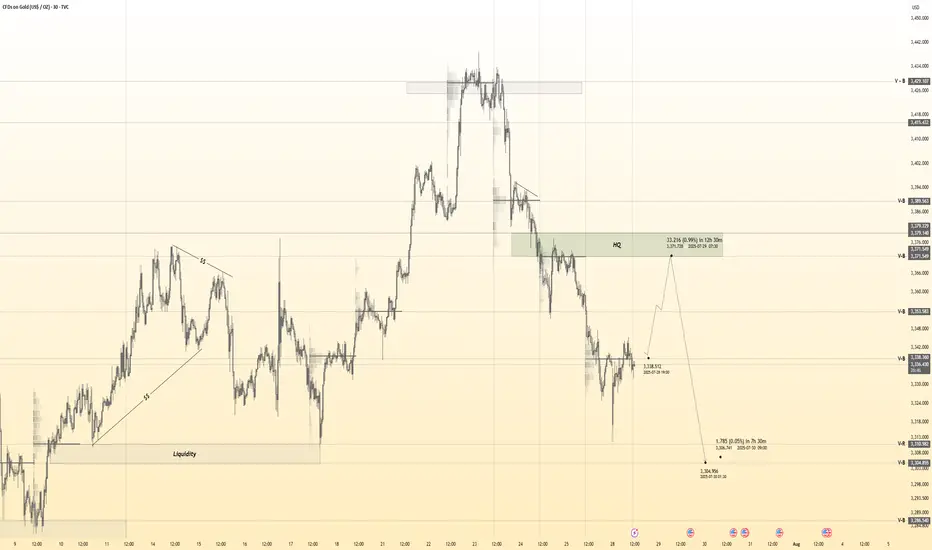
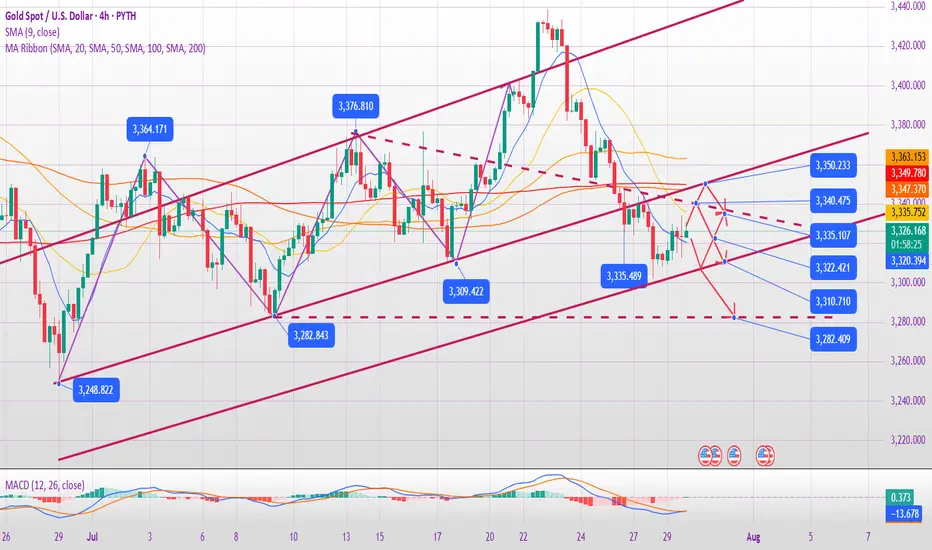
Has gold bottomed out on July 30?
Key Influencing Factors
Negative Factors:
A stronger US dollar: A rebound in the US dollar index is suppressing gold prices.
Recovering risk appetite: Market demand for safe-haven assets is weakening.
Rising real interest rates: Expectations of Fed policy are impacting the cost of holding gold.
US-EU trade agreement: Easing geopolitical tensions will weaken gold's safe-haven appeal.
Potentially bullish variables:
Federal Reserve policy signals: A dovish statement on Wednesday could boost gold prices.
Geopolitical risks: Uncertainties such as the Sino-US trade negotiations and the situation in the Middle East remain.
Technical Analysis
Trend Analysis:
Short-term weakness (four consecutive negative daily candlestick patterns), but the broader bullish trend remains.
Key support level: 3300-3285 (falling below or falling to 3250); resistance level: 3330-3345 (breaking through may end the pullback).
Key Levels:
Downward Support: 3310-3300 (short-term), 3285 (strong support). Upper resistance: 3335-3345 (trend reversal expected after a breakout).
Trading Strategy
Short-term Trading:
Long positions primarily at low levels: Try a light buy position in the 3300-3310 area, with a stop-loss below 3285 and a target of 3330-3345.
Short selling at high levels is auxiliary: If it rebounds to 3335-3345 and is under pressure, you can short sell with a stop loss above 3350 and a target of 3310-3300.
Follow up on the breakout: If it breaks through 3345 strongly, you can chase long positions; if it falls below 3285, be wary of a rebound after a false break.
Medium- to Long-term Strategy:
Watch for potential bottoming opportunities near 3285. If it stabilizes, place long positions in batches, betting on dovish signals from the Federal Reserve or escalating geopolitical risks.
Risk Warning: Data-sensitive period: This week's Federal Reserve decision and economic data may trigger significant volatility, so position management is crucial. US Dollar Trends: The US dollar and gold prices show a significant negative correlation, so the US Dollar Index should be monitored closely.
Risk of false break: There may be a trap below 3300, which needs to be confirmed in combination with the K-line pattern.
Summary: Gold is under short-term pressure, but the medium- to long-term bullish outlook remains unchanged. Focus on the effectiveness of support in the 3300-3285 area and the direction of the Federal Reserve's policy. We recommend a flexible approach, using key breakthroughs as a guide for directional analysis, and cautiously holding positions before data releases.
NXRAUSDT trading ideaNXRAUSDT has confirmed a rising wedge breakdown, initiating a strong bearish impulse while maintaining respect for the descending dynamic trendline. With two prior rejections at this trendline, the probability of a third test remains high, setting up a short-term retracement opportunity toward local resistance or the identified supply zone.
The overall bearish structure suggests continuation towards the final downside target, contingent on price failing to reclaim key resistance levels. A break above the 0.043–0.05 zone would invalidate the bearish bias, shifting momentum towards 0.0887 as the next major resistance before any further upside expansion.

Correction It is expected that the downtrend will continue to form until the specified support levels. Then there is a possibility of a trend change and the start of an uptrend. If the price breaks through the support area, the downtrend will continue to the next support area.

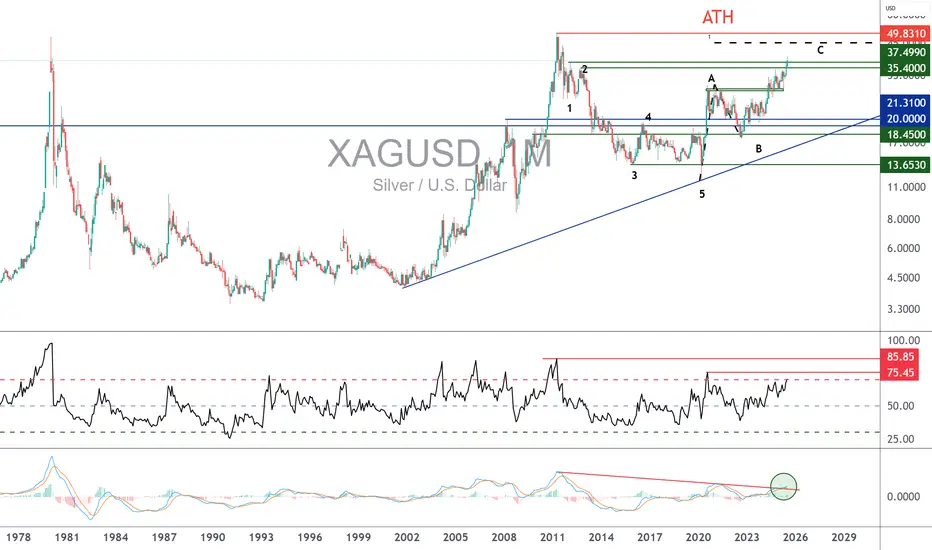
CAN SILVER RETURN TO ITS HISTORIC HIGH OF $50?In the world of precious metals, gold has already broken its all-time high in recent months, supported by solid fundamentals. Another precious metal is now catching up: silver. Unlike platinum and palladium, silver today combines all the necessary ingredients to revisit its historic peak. Its bullish potential stems from a unique blend of market volume, correlation with gold, supportive fundamentals, and favorable technical conditions. Silver isn’t just "gold’s little brother": it is currently the only precious metal with both the technical and structural setup to aim once again for the mythical $50 mark, last reached in 2011.
1) After GOLD, silver is the most liquid precious metal and has the highest positive correlation
The first key factor is liquidity. On the precious metals market, gold remains the clear leader, with hundreds of billions of dollars traded daily. Silver comes second, far ahead of platinum and palladium, with around $5 billion in daily volume. This level of activity is crucial—adequate liquidity allows speculative and institutional flows to fully express themselves. Conversely, the low volumes of platinum and palladium limit their upside, as their markets are too narrow to support the kind of momentum seen in gold or silver.
The second strength of silver lies in its natural correlation with gold. Historically, the two metals move in sync. This behavioral alignment is reflected in a correlation coefficient close to 1. Platinum and palladium, by contrast, respond to industrial demand, particularly from the auto sector and emissions technology. Silver, however, blends industrial uses (jewelry, electronics, solar panels, etc.) with a monetary and financial role similar to gold. This dual nature makes silver a hybrid asset, with both ETF-driven financial demand and jewelry-like industrial demand.
2) Technically, the SILVER/GOLD ratio remains in a short-term uptrend from a long-term support
Technical analysis reinforces this fundamental outlook. While gold appears to be losing steam after hitting $3,500, silver still shows a medium-term bullish setup—even though short-term corrections are always possible. The gold/silver ratio, historically useful to detect when silver outperforms gold, also suggests that silver is poised for further gains. Silver’s long-term trend remains bullish as long as the $34–$35 support zone holds. The $50 mark is the natural technical target of this trend.
The following chart shows the gold/silver ratio and indicates that silver is likely to outperform gold through year-end:
And here is the monthly candlestick chart of spot silver:
DISCLAIMER:
This content is intended for individuals who are familiar with financial markets and instruments and is for information purposes only. The presented idea (including market commentary, market data and observations) is not a work product of any research department of Swissquote or its affiliates. This material is intended to highlight market action and does not constitute investment, legal or tax advice. If you are a retail investor or lack experience in trading complex financial products, it is advisable to seek professional advice from licensed advisor before making any financial decisions.
This content is not intended to manipulate the market or encourage any specific financial behavior.
Swissquote makes no representation or warranty as to the quality, completeness, accuracy, comprehensiveness or non-infringement of such content. The views expressed are those of the consultant and are provided for educational purposes only. Any information provided relating to a product or market should not be construed as recommending an investment strategy or transaction. Past performance is not a guarantee of future results.
Swissquote and its employees and representatives shall in no event be held liable for any damages or losses arising directly or indirectly from decisions made on the basis of this content.
The use of any third-party brands or trademarks is for information only and does not imply endorsement by Swissquote, or that the trademark owner has authorised Swissquote to promote its products or services.
Swissquote is the marketing brand for the activities of Swissquote Bank Ltd (Switzerland) regulated by FINMA, Swissquote Capital Markets Limited regulated by CySEC (Cyprus), Swissquote Bank Europe SA (Luxembourg) regulated by the CSSF, Swissquote Ltd (UK) regulated by the FCA, Swissquote Financial Services (Malta) Ltd regulated by the Malta Financial Services Authority, Swissquote MEA Ltd. (UAE) regulated by the Dubai Financial Services Authority, Swissquote Pte Ltd (Singapore) regulated by the Monetary Authority of Singapore, Swissquote Asia Limited (Hong Kong) licensed by the Hong Kong Securities and Futures Commission (SFC) and Swissquote South Africa (Pty) Ltd supervised by the FSCA.
Products and services of Swissquote are only intended for those permitted to receive them under local law.
All investments carry a degree of risk. The risk of loss in trading or holding financial instruments can be substantial. The value of financial instruments, including but not limited to stocks, bonds, cryptocurrencies, and other assets, can fluctuate both upwards and downwards. There is a significant risk of financial loss when buying, selling, holding, staking, or investing in these instruments. SQBE makes no recommendations regarding any specific investment, transaction, or the use of any particular investment strategy.
CFDs are complex instruments and come with a high risk of losing money rapidly due to leverage. The vast majority of retail client accounts suffer capital losses when trading in CFDs. You should consider whether you understand how CFDs work and whether you can afford to take the high risk of losing your money.
Digital Assets are unregulated in most countries and consumer protection rules may not apply. As highly volatile speculative investments, Digital Assets are not suitable for investors without a high-risk tolerance. Make sure you understand each Digital Asset before you trade.
Cryptocurrencies are not considered legal tender in some jurisdictions and are subject to regulatory uncertainties.
The use of Internet-based systems can involve high risks, including, but not limited to, fraud, cyber-attacks, network and communication failures, as well as identity theft and phishing attacks related to crypto-assets.
DXY Rebound Pulls EURUSD Below 1.16Following the DXY’s significant rebound off a 17-year trendline, the EURUSD has broken below a trendline that connected all consecutive lows of 2025. This opens the door to further bearish risks, with key support levels now in sight.
If the pair closes cleanly below 1.15, 1.1440 and 1.1380, downside extensions could reach 1.12 and 1.11, respectively.
On the upside, a close back above the 2025 trendline and the 1.18 mark could reinstate bullish momentum, potentially lifting the pair toward the 2021 highs between 1.20 and 1.23.
Written by Razan Hilal, CMT

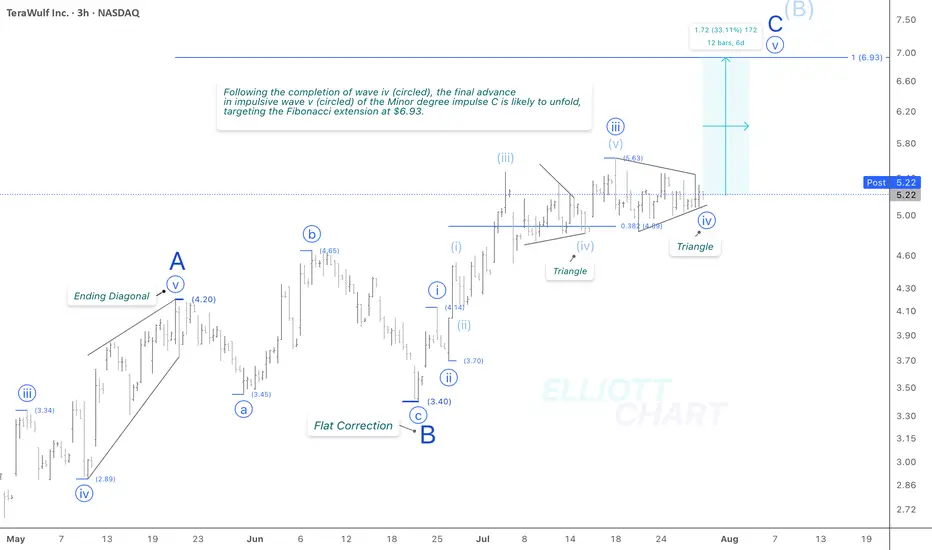
WULF / 3hNASDAQ:WULF continued to consolidate sideways today, in line with expectations, with no material change to the broader outlook. The narrowing price action supports the current wave structure—specifically, a completed triangle in wave iv (circled), likely preceding the anticipated final advance of approximately 33% in wave v (circled) of the ongoing Minor degree wave C.
The Fibonacci extension target at 6.93 remains valid.
Trend Analysis >> Upon completion of Minor degree wave C, the countertrend advance of Intermediate degree wave (B), which has been unfolding since April 9, is likely to give way to a decline in wave (C) of the same degree. This downtrend might begin in the coming days and potentially extend through the end of the year!!
NASDAQ:WULF CRYPTOCAP:BTC BITSTAMP:BTCUSD MARKETSCOM:BITCOIN
#CryptoStocks #WULF #BTCMining #Bitcoin #BTC
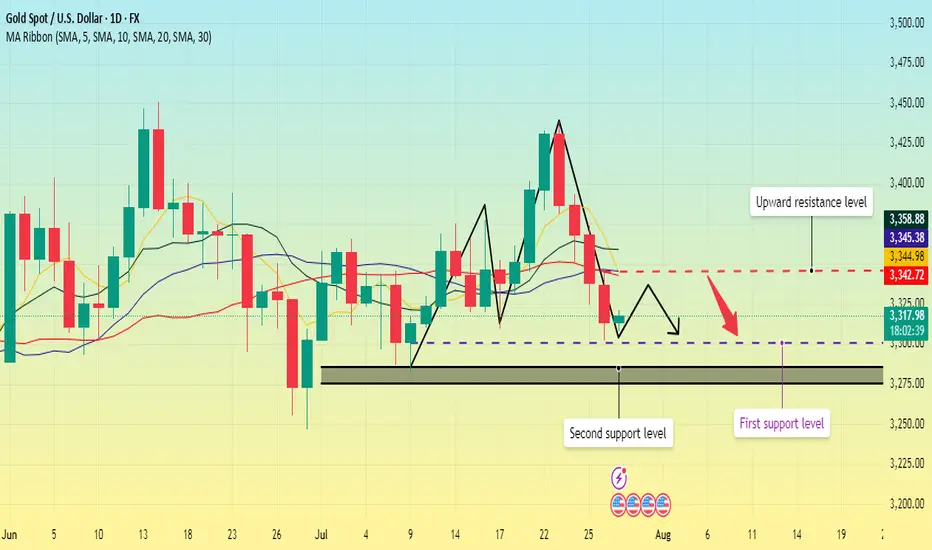
Gold repeatedly tested lows. Will it break through?On Monday, the Asian market opened low and rose in the early trading. In the European trading, it rose to around 3345. The European trading was under pressure and fluctuated. The US trading began to accelerate its decline, and the lowest point reached around 3302. Then it continued to fluctuate in the range of 3300-3320.
On July 27, the United States and the European Union reached a framework trade agreement; the agreement reduced market concerns about the global economic recession, promoted the attractiveness of risky assets, and boosted the stock market and the US dollar. Although Trump has repeatedly pressured for a substantial interest rate cut, the market has strong expectations for a September interest rate cut. The current expectation of maintaining a stable interest rate dominates the market, coupled with the strength of the US dollar, which puts gold prices under downward pressure in the short term.
Gold opened low in the early trading on Monday and then rebounded to recover the losses, but then fell below the low again, and the daily line closed in the negative, and now it has formed a four-day negative decline. MA5 and 10-day moving averages form a dead cross, and there is a downward turn.
The focus on the upper side is around Monday's high of 3345, which is also near the current position of MA5, 20, and 30-day moving averages. Below this position, gold is weak; if it breaks upward, it is necessary to prevent the possibility of a rebound correction.
The lower support first focuses on the 3300 integer mark; secondly, focus on the area around 3285-3275.
Operation strategy:
Short near 3340, stop loss 3350, profit range 3320-3300;
Long near 3300, stop loss 3290, profit range 3320-3340.
Before the release of US data on Tuesday, you can maintain this operation strategy; after the data is released, adjust the strategy based on the impact of the data.
GBPNZD BullishAfter exiting a correction, the first impulse (Wave 1) appears. I expect a retracement of at least 50% of the Fibonacci.

WULF / 3hNASDAQ:WULF traded sideways today, as expected, with no significant change to the broader outlook. The ongoing consolidation continues to support the current wave structure—specifically, a developing triangle in wave iv (circled), which may be forming ahead of the anticipated final advance in wave v (circled).
The Fibonacci extension target >> 6.93 remains valid.
Trend Analysis >> Upon completion of Minor degree wave C, the countertrend advance of Intermediate degree wave (B), which has been unfolding since April 9, is likely to give way to a decline in wave (C) of the same degree. This downtrend might begin in the coming days and potentially extend through the end of the year!!
NASDAQ:WULF CRYPTOCAP:BTC BITSTAMP:BTCUSD MARKETSCOM:BITCOIN
#CryptoStocks #WULF #BTCMining #Bitcoin #BTC

Gold 30Min Engaged ( Bullish After Break Out Entry Detected )———
Time Frame: 30-Minute Warfare
Entry Protocol: Only after volume-verified breakout
🩸Bullish Break - 3339
➗ Hanzo Protocol: Volume-Tiered Entry Authority
➕ Zone Activated: Dynamic market pressure detected.
The level isn’t just price — it’s a memory of where they moved size.
Volume is rising beneath the surface — not noise, but preparation.
🔥 Tactical Note:
We wait for the energy signature — when volume betrays intention.
The trap gets set. The weak follow. We execute.