An increase above the M-Signal indicator on the 1M chart means..Hello traders!
If you "Follow" us, you can always get new information quickly.
Please also click “Boost”.
Have a good day.
-------------------------------------
If there is a coin (token) that appears to be rising above the M-Signal (MS-Signal) indicator on the 1M chart, you need to pay attention and keep a close eye on its movements.
To explain this, let's take the WAVESUSDT chart as an example.
------------------------------------------------
(WAVESUSDT 1M chart)
It is rising above 3.426 and showing signs of rising above the MS-Signal indicator.
Accordingly, the key is whether it can receive support and rise around 2.676-3.426.
(1W chart)
If you look at the chart as a whole, the movements are difficult to discern.
The key is whether the price can be maintained by rising above the M-Signal indicator on the 1M chart.
However, since the M-Signal (MS-Signal) of the 1W chart < M-Signal of the 1M chart, in order to continue a large upward trend, the M-Signal (MS-Signal) of the 1W chart must be > M-Signal of the 1M chart. This is expected to be possible if the price is maintained above the M-Signal on the 1W chart.
You can think of this concept as the price moving average line when studying charts.
The price moving average line is very useful in chart analysis, but from a trading perspective, it has significant disadvantages, so it is recommended to draw support and resistance points on the 1M, 1W, and 1D charts.
(1D chart)
Accordingly, the price will be maintained above 3.767, the HA-High indicator point, and volatility will occur or movement will appear to slow down until the M-Signal of the 1W chart > M-Signal of the 1M chart.
The occurrence of volatility means that there is a force trying to form a trend more quickly, so caution is needed when trading coins (tokens) that are showing this type of behavior.
A slowdown in movement can be interpreted as buying in progress.
However, it can be interpreted that there are forces that are trying to ensure stable purchases by preventing individual traders from taking interest in coins (tokens) that show this behavior.
No matter what it looks like, maintaining the price above the M-Signal indicator on the 1M chart will ultimately lead to a continued upward trend.
Have a good time.
thank you
--------------------------------------------------
- The big picture
The full-fledged upward trend is expected to begin when the price rises above 29K.
This is the section expected to be touched in the next bull market, 81K-95K.
#BTCUSD 12M
1st: 44234.54
2nd: 61383.23
3rd: 89126.41
101875.70-106275.10 (when overshooting)
4th: 13401.28
151166.97-157451.83 (when overshooting)
5th: 178910.15
These are points that are likely to encounter resistance in the future.
We need to see if we can break through these points upward.
Since it is thought that a new trend can be created in the overshooting area, you should check the movement when this area is touched.
#BTCUSD 1M
If the general upward trend continues until 2025, it is expected to rise to around 57014.33 and then create a pull back pattern.
1st: 43833.05
2nd: 32992.55
-----------------
Waves

WAVES after the rejection from the resistance zone can go down WAVES after the rejection from the resistance zone can go down
🔵Entry Zone 4.0069 - 3.8172
🔴SL 4.214
🟢TP1 3.512
🟢TP2 3.222
🟢TP3 2.855
Risk Warning
Trading Forex, CFDs, Crypto, Futures, and Stocks involve a risk of loss. Please consider carefully if such trading is appropriate for you. Past performance is not indicative of future results.
If you liked our ideas, please support us with your likes 👍 and comments.

WAVES looks bearishConsidering the bearish CH and the liquidity pools at the bottom of the chart, it seems that WAVES intends to move towards the specified demand.
WAVES is now in supply range
By maintaining the supply range, it can drop the demand side.
Closing a daily candle above the invalidation level will violate this analysis
Note that the financial market is risky, so:
Do not enter any position without confirmation and trigger.
Do not enter a position without setting a stop.
Do not enter a position without capital management.
When we reach the first TP, save some profit and try to move the stop continuously in the direction of your profit.
If you have any comments please post them, comments will help us improve our performance
Thanks

📍Part 3. Motive Waves - Leading & Ending Diagonals.👩🏻💻Welcome to the 3nd lecture on Elliott Waves!
➡️In this lecture, I will talk about the Leading and Ending diagonals as the primary and most common variations of impulsive waves. We will also touch on the Expanding diagonal, which occurs significantly less frequently. Earlier, we covered the general concept of impulse and its structure. Now, I will specifically discuss the variations of impulses and, namely, for waves "1", "5", as well as corrective waves "A" and "C".
➡️Let's start with variations for the first wave in the impulse and correction. This is the Leading diagonal. This structure may remind you of an ascending triangle, and essentially, that's what it is. The first wave itself implies that before this, we were moving in the opposite direction. So, if wave 1 is ascending, it means there was a certain descending movement before it. And it's obvious that in this descending movement, sales prevailed. Thus, reversing the price in the opposite direction may not be so easy. In such cases, when it's not easy, we get not a sharp 5-wave impulse but a Leading diagonal, where conditional buyers, as it were, chew their way upwards.
➡️Next, of course, there is correction and further growth. The Leading diagonal can also be encountered in wave a of correction "ABC". And here, the logic remains the same since the correction goes in the opposite direction of the trend; we have significant support for demand. In our example, this is an ascending trend. Therefore, we don't get a sharp impulse, but gradually, and squeezing, which forms the structure of the Leading diagonal.
➡️As you already understand, waves "2" or "4" also have a correctional structure "ABC", where "A" can also be a Leading diagonal. And then, you can encounter the Leading diagonal in wave "1" and in wave "A", and since they reverse the direction of movement, the structure is not formed like a sharp impulse but more like an ascending triangle in the case of wave "1" and a descending triangle in the case of corrective wave "A".
➡️Moving on to the Ending diagonals. You can get them in wave "5" and wave c in the corrective structure "ABC". Here the principle is similar, as you might have guessed, to the case of wave "5". We see how the ascending movement fades, as if the buyers no longer have the strength to move the price, impulsively upwards, I remind you, we are considering an example of an ascending trend movement.
➡️You can encounter the Ending diagonal in wave "5" and wave "C". It turns out everything is quite logical and simple. Wave "1" starts the impulse, and wave "A" starts the correction. Wave "1" starts the impulse, and wave "A" starts the correction. In turn, wave "5" completes the impulse, and wave "C" completes the correction.
➡️Well, now we need to understand the rules for the Leading and Ending diagonals to determine them correctly.
➡️Now let's look at the rules separately for Contracting diagonals!
📍 Rules 📍
📍In the contracting variety, wave "3" is always shorter than wave "1", wave "4" is always shorter than wave "2", and wave "5" is always shorter than wave "3" (1 > 3 > 5 and 2 > 4).
📍Going forward in time, a line connecting the ends of waves 2 and 4 converges towards with the line connecting the ends of waves "1" and "3".
📍 Guidelines 📍
📍In the contracting variety, wave "5" ends beyond the end of wave "3" (only for the Leading diagonals).
📍In the contracting variety, wave "5" ends beyond the end of wave "3" or does not reach the end of wave "3": truncation (only for the Ending diagonals).
📍In the contracting variety, wave "5" usually ends at or slightly beyond a line that connects the ends of waves "1" and "3" (Ending beyond that line is called a throw-over).
📣This concludes the lecture on impulse waves. Save the images and practice.
Next week I'll talking about the Corrective Waves - Simple - Sharp Corrections.
🔔 Links to other lessons in related ideas. 🔔

Hellena | Oil (4H): Long to 100% Fibo 85.00.Dear Colleagues, price has reached the minimum acceptable target of 61.8% Fibonacci extension at 82.94 and now I assume that wave C will be equal to wave A. This is quite a risky forecast, so I recommend to take risks and enter with a risk of no more than 1-5% of your deposit.
My target is in the area of 100% Fibonacci extension at 85.00.
Manage your capital correctly and competently! Only enter trades based on reliable patterns!

Bitcoin ready to big move !Currently, Bitcoin is finishing wave 5 of corrective movement. He predicts that bottom will be around $60,500.
Then, we should start a rapid upward movement towards $75,000 - $80,000
Market is very dynamic, ETFs buy a thousand BTC every day and cyclicality itself has already been disturbed.
good luck.

WDS Long Investment Conservative Trend TradeConservative Trend Trade 8F
+ long impulse
+ support level
+ significant bar level
- below 1/2 correction
+ volumed 2Sp+
+ weak test
+ first bullish bar closing entry
Calculated affordable virtual stop loss
Take profit:
20% at 1 to 2 R/R on Daily
20% at Daily resistance level T1
20% at 1/2 of Monthly
20% at Monthly resistance level CREEK
20% at Monthly thick level resistance T2
Monthly Context
+ long balance
+ support level
+ 1/2 correction
+ biggest volume Spring
- volumed test in progress"

WAVES/USDT bullish momentum from key demand? 👀🚀waves analysis💎 Paradisers, brace yourselves for an exciting turn with #WAVESUSDT as it encounters resistance at the supply zone, paving the way for a potential bullish surge from the demand level.
💎 Through market cycles, we've observed how previous supply zones have transitioned into areas of demand, driving prices higher. Presently, with #WAVES challenging a key supply area at $3.671 there's a promising outlook for a bullish shift from this point.
💎 Conversely, if PSX:WAVES falls beneath the $3.067 level, it might signal a move towards bearish waters, prompting a strategy reassessment. A bullish push from a secondary demand point at $2.649 could be anticipated, yet breaching this could lead to further declines

Last waveNo one knows exactly where the market will turn except me. I conducted an in-depth analysis and came to the conclusion that after the correction, which starts from current price values, there will be a final wave of growth. Not all alcoins will update their ATH. Should update its historical maximum: tron, bnb, eth, solana. The size of the correction on Bitcoin will be 20-30%
KDP Swing Hourly / Daily Long Aggressive Trend TradAggressive Trend Trade 8F
- short balance
- unvolumed ICE
+ bigest volume Sp
- weak volume test closed below ICE
+ first bullish bar close similar level entry
Calculated affordable virtual stop loss
1 to 2 R/R take profit before volume resistance zone / before CREEK
Daily Context
- short impulse
+ biggest untested volume T1
+ biggest untested volume manipulation
+ support level
Monthly Context
- short impulse
+ 1/2 correction
+ biggest volume 2Sp+
- strong test below 1/2 correction

Wave of the day: Visa
5 good reasons for NYSE:V stock
1. Bounce from the value zone
2. Rising MACD histogram
3. Buying Volume coming in
4. Pocket Pivot on the last day
5. Analysts have set a mean price target forecast of 160.17. This target is 20.33% above the current price.
What's your take on Visa?Comment below
Legal Disclaimer: The information presented in this analysis is solely for informational and educational purposes only and does not serve as financial advice.

WAVES has successfully moved above its weekly MA100 BINANCE:WAVESUSDT have had been in a very long accumulation phase and now it has woken up and risen above its weekly 100 moving average which is a strong bullish signal. The coin itself has a significant potential and it is one of the coins that have had been around for quite some time and have survived multiple bear markets. And like a phoenix it has always recorded a new all time high in each bull market. This time shouldn't be an exception either and we possibly can see price targets as high as even $70. Yes, you heard me right! Don't forget to DYOR! But if you ask me what I would do, I would buy after a small pull back and hold until it reaches my desired price. The more you play with a coin the less you would obtain at the end. It's like a soap! Everybody knows that in this market if they have been around for a while. So buy it and HODL! Good luck. :)


WAVESUSDT 3D LONG📈Hi all. Timeframe 3D. WAVES has formed a triangle and is at trend support. Pressing down the price. I am considering going long during a breakdown/retest of the triangle resistance. Marked goals and levels on the chart.

WAVES is super bullishWAVES really has good waves!
On the chart, we have a large-scale diametric, which seems to have just finished wave D.
WAVES looks set to enter its large diametric E wave.
By maintaining the green range, it can move towards the targets.
Closing a weekly candle below the invalidation level will violate the analysis.
For risk management, please don't forget stop loss and capital management
When we reach the first target, save some profit and then change the stop to entry
Comment if you have any questions
Thank You

BTC_ETH_WAVES - bull setup all the information he said in the video.
if you like the idea, please "Like" it. This is the best "Thanks!" for the author 😊 P.S. Always do your own analysis before a trade. Put a stop loss. Fix profits in installments. Withdraw profits in fiat and please yourself and your friends.

🚧GTAIUSDT is Bullish now🚧 & many Traders don't see it 👀!!!Hi.
KUCOIN:GTAIUSDT
Today, I want to analyze GTAI for you in a 12H time frame so that we can have a SHORT-term view of GTAI regarding the technical analysis. (Please ✌️respectfully✌️share if you have a different opinion from me or other analysts).
We have a Bullish Structure here
GTAI formed a Falling Wedge on 12h timeframe🤔
Up we go if we do breakout.
✅ Due to the Ascending structure of the chart...
- High potential areas are clear in the chart.
- Falling Wedge
- waves
Stay awesome my friends.
_ _ _ _ _ _ _ _ _ _ _ _ _ _ _ _ _ _ _ _ _ _ _ _ _ _ _ _ _ _ _ _ _
✅Thank you, and for more ideas, hit ❤️Like❤️ and 🌟Follow🌟!
⚠️Things can change...
The markets are always changing and even with all these signals, the market changes tend to be strong and fast!!

WAVESUSD 1WWAVES ~ 1W 📈
#WAVES This Resistance Line will be broken in the near future. Make purchases gradually from here, with a target of at least 20%++

CMCSA Long Swing Aggressive Trend Trade 4RAggressive Trend Trade 4R
- short impulse
+ volumed T1 level
+ support level
+ volumed Sp
+ weak test
+ first bullish bar closed entry
Calculated affordable stop loss
1 to 2 R/R before 1/2 of daily short impulse take profit
Daily Context
+ long impulse
+ support level
+ 1/2 correction
+ monthly support level
+ biggest volume T2
+ manipulation of T2
Monthly Context
+ SOS bar level / T2?
+ 2Sp- + test

PFE Long Investment Aggressive CounterTrend TradeAggressive CounterTrend Trade 10F
- short impulse
+ biggest volume T1
+ support level
+ biggest volume 2Sp
Calculated affordable stop loss
1 to 2 R/R take profit before 1/2 of daily range
Monthly Context
- short impulse
+ 1/2 correction of 15 years long trend
+ historical volume
+ biggest volume of short trend

BTC : 5Day MACD Fib WavesBitcoin Bitstamp 5Day moving average convergence/divergence
and fibonacci-based primary and secondary sine wave structures
established from historical MACD positive and negative momentum.
The MACD is displayed using the standard fast and slow lengths of 12 and 26, respectively.
Signal smoothing length is the standard value of 9.
For visual clarity, the signal line is not displayed...
but I have left in the colored fill between the MACD line and signal line,
so you can still see where the signal line would be.
Also included is the colored fill between the MACD and zero line.
The wave structure template used in this idea is roughly relative to a standard fibonacci channel,
using the following levels : 0, 0.214, 0.236, 0.50, 0.764, 0.786, and 1.00.
The primary fib wave template is displayed using solid lines.
The positions of the upper and lower bounds of the wave structure
are established using the March/April 2021 high, and the June/July 2022 low.
The horizontal positioning of the wave structure is established
using the March/April MACD high for the lowest wave value.
The highest value of the 1.00 wave (amplitude), as well as its' wavelength,
is established using the 0.50 midline level interactions...but more on that soon.
Note,
while the build and placement of the fib wave structures mimic a standard fib channel, it is not exact.
Looking closely, you'll notice that the midline isn't exactly in the middle of the 0 and 1.00 wavelines.
The structure compresses towards the bottom, thus it is not vertically symmetrical.
Either way, these fib wave levels surely line up with the MACD rather impressively.
Also of note,
by applying a horizontal fibonacci channel using the lowest values of the 0 and 1.00 wave levels,
and adding 0.35, 0.382, 0.618, and 0.65 to the existing levels,
one can see interesting interactions between the MACD and these horizontal levels.
Returning to the primary wave structure...
we can see some very interesting interactions between the MACD and the waves.
Here we look at the pink/blue wave levels :
And here, we look at the 0.50 green midline :
These midline interactions were used in creating the amplitude and wavelength of the entire wave structure.
By looking at all the interactions, I believe that it is fair to assume
that interactions similar to these could occur in the future
when the MACD reaches the various levels of this fibonacci wave structure.
Ok.
So what if, in the future, the MACD reaches beyond the upper and lower bounds of the fibonacci wave structure?
My first thought was to just extend the current wave structure
by adding more levels above and below the existing structure :
This could indeed be useful.
But, when I looked at the current structure, and then looked at historical MACD values before 2017,
I concluded that this structure doesn't necessarily apply to that data.
If I were to predict future MACD action beyond this structure,
especially a massive logarithmic rise/drop similar to what happened at the end of 2020/beginning of 2021,
I would need to think about this completely different, and find a another method...
one outside of simply adding more levels above and below the existing structure.
What did I find?
Let's return to the midline interactions that we looked at earlier.
We see the MACD hits the green midline and reverses 3 times before breaking through the it,
and then the MACD rises to the white 1.00 fib wave level.
I realize the following might be reaching a bit far,
but, what if this particular MACD behavior pattern occurs again in the future?
If the possibility of this occurring again exists,
is there any existing MACD data that I can use to form an entirely new fib wave structure?
A new structure that when placed properly, allows this behavior pattern to occur once again?
Here is what I found.
I can place a brand new wave on the chart, one with a larger wavelength, and a much larger amplitude.
I can modify its' wavelength, amplitude, and position,
so that it mimics the midline of the existing wave structure, but on a larger scale.
Take a look... here it is, displayed with a dashed line :
Now I ask, is it possible to estimate the other levels of this new structure using this waveline
and any existing MACD data?
Here is what I found :
Is this stretching a bit too far? Maybe.
But, I think that this way of thinking is what is necessary to imagine
what the MACD may look like in the future if there is a massive logarithmic swing in either direction.
And of course, because this new fib wave structure is built using less data than the previous structure,
and involves more estimation, it is likely to be less accurate as well.
So, if all of this possibly plays out, what would the MACD look like if it did reach these types of levels?
Well, using an unpublished pinescript indicator that I wrote,
I can give you an idea of what it would look like...
If you take all of the existing MACD data, offset it horizontally to the right by 500,
and then multiply the values by 4.20, you get this :
Awesome, right?!?!
Interestingly, this projection also fits the initial fib wave extensions
that I used in one of the previous images above. Take a look :
So, in conclusion, this is how I created the main chart of this idea.
I tried to include my logic and reasoning behind it.
Is this useful? I think so.
Naturally it depends on several factors such as whether you agree with the logic and conclusions of this idea,
whether you use the MACD to help you trade, the timeframes of your trades, as well as your trading style.
If anything, I think this chart is definitely worth looking at every now and then,
especially when the MACD gets close to the various levels.
Regarding sine waves, I have found some other waves that can be applied to the MACD that could prove useful.
I refer to them as sub-waves. These are not placed within a unifying fib structure...
they are individual waves, each with different amplitudes and wavelengths.
All sub-waves :
I think that these sub-waves can be useful at levels in between the fib wave levels of the two main structures,
and overall help add to the validity of the notion of using sine waves in conjunction with an MACD while trading.
Finally, here is a bonus 5Day MACD fib grid image...
Thank you for checking out my idea.
I hope it makes you look at sine waves, fibs, and the MACD differently.
Please give it a boost if you liked it, and feel free to comment.
//Durbtrade

WAVES / WAVESUSDTGood Luck >>
• Warning •
Any deal I share does not mean that I am forcing you to enter into it, you enter in with your full risk, because I'll not gain any profits with you in the end.
The risk management of the position must comply with the stop loss.
(I am not sharing financial or investment advice, you should do your own research for your money.)

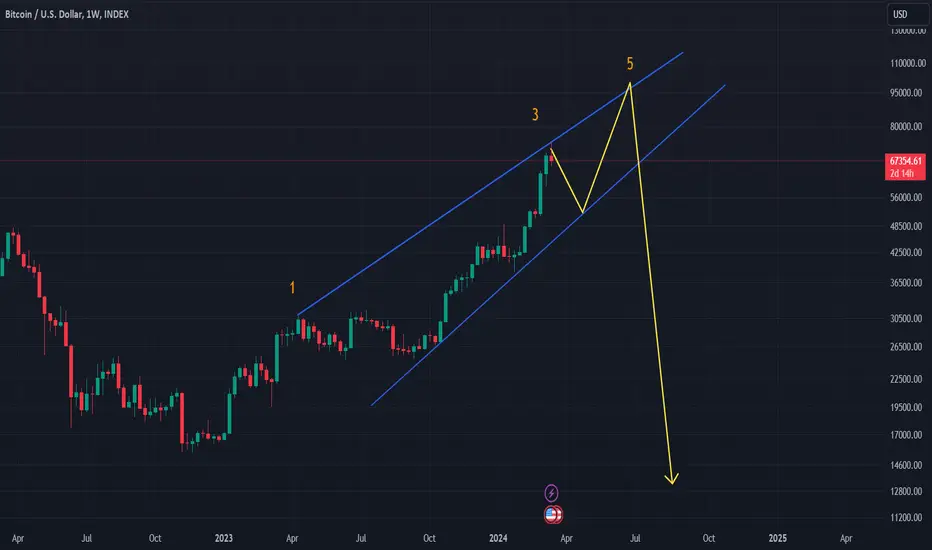
Alikze »» WAVES | Short-term rising wave 3 scenarioIn time D1 and W1, it is moving in a long-term ascending channel. After exiting the density and an upward correction, the zigzag is currently moving towards the targets specified in the chart in the microwaves of the 3rd ascending wave. In the weekly time, the first supply range must be broken to continue the path to open the path for the next targets. Therefore, the most important resistance in front of it will be the first supply range.
⚠️The failure of the first supply area will be corrected.3
🔰 At the beginning of micro wave 3 or C rising is located. Therefore, there is a possibility of rapid movement.
🔰 If this wave is extended, there will be the ability to break and break the first supply area to the second area.
🔰 The bottom of the current wave can be considered as invalidity of the analysis.
»»»«««»»»«««»»»«««
Please support this idea with a LIKE and COMMENT if you find it useful and Click "Follow" on our profile if you'd like these trade ideas delivered straight to your email in the future.
Thanks for your continued support.
Sincerely.❤️
