Waves

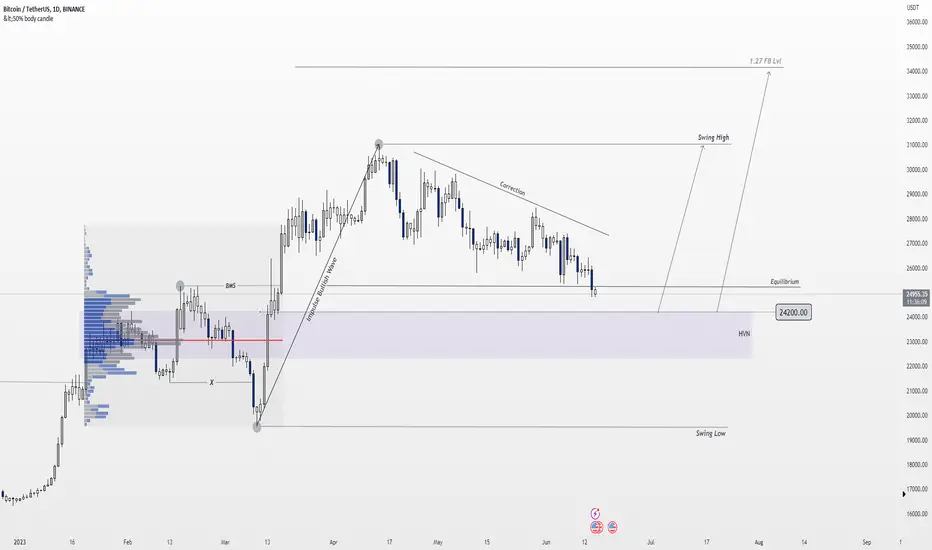
BTC +28% Hello traders
We have a strong impulse for buyers and sellers entering a correction so we expect another impulse for buyers
And we have a strong HVN area, from which I expect the price to rise
The targets are the top of the correction and 1.27 Fibonacci
US30 Wave and Price action AnalysisHello, traders
We have a bullish impulse wave and a regular flat correction pattern, and another bullish impulse wave started, breaking the last top of the sellers, and we have a small correction that ended, and the buyers began to push the price with increasing momentum. This indicates that US30 is heading to break 34273 first, then 34896


NZD/CHF Wave and Price action Analysis bullish Impulse wave + Regular flat correction pattern = another bullish impulse wave

XUAUSD sellXAUUSD has formed triangle 📐 pattern and now it has completed its ABCD formation now to complete its E wave now we will short after proper price action the confluance is 38% fibbo level so try shorting this pair

Hellena | EURUSD: The last wave is moving towards lower levels.At the level of 1.07500, impressive contracts on the euro futures were formed. This may indicate that the price will move towards this target, then make a new low, we will see a strong pattern, and then enter a long position with targets from the main idea.
Manage your capital correctly and competently! Only enter trades based on reliable patterns!


When do we sell a symbol? Expiry went fine the 2nd June, it has various bullish remarks at the end, the volume spikes spoke for themselves. Now there is new danger ahead, economy is hanging onto verges of a single man, and typically now the popular opinion is that he shall be left with no other option than greening the signal light and another rally is expected. Many weeks have gone by when Hawkish behaviour hysterically chose the opposite stand than what was popularly spread or wrongly articulated by the media houses. Fund managers are having a gala time because on one switch the retailer accumulate huge lots and their low cost investment earns a fortune and at another switch they sell what is a cheap calculated risk investment for future. TSLA is going to sink yet again and AAPL shall make history.

AXSUSDTThe price correction of the Elliott Pattern is being completed. It is attractive for long-term investment.

NDX nasdaq 100It has reached a very important price range. If the price crosses the specified range, the price may continue to rise. If the price trend is weak, the supply pressure will increase.

WAVESUSD Channel IdeaAn idea considering a channel upwards on waves and subsequent price reversal at bottom of channel
Inverted H&S in circles

JPY INDEX ELLIOT BREAKDOWN Currently, we are at the last wave of the overall wave which is the wave 5. Expect rejections around 775.0 price level. baased on the previous candles that left a gap without filling, expect price to fill it in the future and that will be the target after breakout of the red trendline.

BTC wave B is starting again after wave A has completed.BINANCE:BTCUSDT Finally, wave B is starting again after wave A has completed. Let's watch together to see if wave B will be destroyed so that wave 5 can expand or not.

Hellena | GOLD: Completion of the 5th wave and go Long.Dear colleagues!
According to wave theory, we are expecting the completion of the 5th wave. However, an Ending Diagonal wave pattern is also possible.
I will determine the entry range after the completion of the 5th wave movement.
Stay tuned for updates on the idea, so as not to miss information on which levels to enter the trade!
Manage your capital correctly and competently! Only enter trades based on reliable patterns!

USD / CHF BUY (Long - term ) Market structure
price action
price channel
support level
break out
waves
imbalance

Retest Potential and RSI EquilibriumWAVES, after breaching below its previous levels, appears to be eyeing a potential retest of the resistance zone within the price range of $1.825 to $1.861. Notably, the current Relative Strength Index (RSI) level is at 49, reflecting a state of equilibrium between buying and selling forces. This suggests a moment of market indecision, where caution is advised. Traders can consider short-selling opportunities in this zone, while exercising prudence and waiting for additional confirmation signals before making any decisive moves.

Gold is still Bullish.... !!! Target 2100Gold is still bullish on the higher time frame. You will start to see a bullish run to 2100. As you can see on the chart, gold a still making a higher highs in the 4hr time frame.
Please learn about chart patterns to see how to identify them and how they can help you in trading.
Good Luck.

WAVES : NEW UPTREND T: $3.28 WAVES seems to enter a new uptrend.
We will follow this coin for more confirmations on the below target to see if it's able to gain.
Important target:$3.28


How to know where you areThe markets are fractal.
Fractal : each part of which has the same statistical characteristics as the whole.
This means that there are patterns within patterns on all degrees which can look identical from the macro to the micro. Just like the veins on your hands, to the rivers on earth.
Although in terms of trading with take profits and stop losses, you need to know exactly which degree/fractal you are trading on because it can get confusing if you don't know where you are.
The best way to learn how to approach this situation is to start from the macro and work your way down to the micro. My favorite way is,
Daily
4hr
1hr
15min ( I personally stop here )
5min
1min
This is the easiest way to start and then once you find your time frame for setups, you will get flexible with these principles and use them in alignment with your time horizon for trading.

GOLD will fall morepreviously gold made a huge down trend to 2036 are to 2005 area.because of the strength of the dollar had been increasing.So in that case we could expect a more dollar rejection to the upside .Dollar is going up means gold will fall.Not as vice versa but direction are completely opposite .
on the other hand gold will rise fro a long term but we have to see the reaction of the gold in the range of daily channel if it breaks bellow gold should sell if it does not happen then gold will move higher again
currently gold will test the lower trend line in daily time frame.we are only looking for selling opportunities because trend is our friend.
Good luck

HUDCO 240 MINS CHART LONG SETUP ✅✅✅✅The Structure looks good to us, waiting for this instrument to correct and then give us these opportunities as shown on this instrument (Price Chart).
Note: Its my view only and its for educational purpose only. Only who has got knowledge about this strategy, will understand what to be done on this setup. its purely based on my technical analysis only (strategies). we don't focus on the short term moves, we look for only for Bullish or Bearish Impulsive moves on the setups after a good price action is formed as per the strategy. we never get into corrective moves. because it will test our patience and also it will be a bullish or a bearish trap. and try trade the big moves.
we do not get into bullish or bearish traps. We anticipate and get into only big bullish or bearish moves (Impulsive Moves). Just ride the Bullish or Bearish Impulsive Move. Learn & Know the Complete Market Cycle.
Buy Low and Sell High Concept. Buy at Cheaper Price and Sell at Expensive Price.
Keep it simple, keep it Unique.
please keep your comments useful & respectful.
Thanks for your support....
Tradelikemee Academy
