Bitcoin moving down in 5th wave on Monthly chart Hi friends,
Check this - Bitcoin moving down in monthly chart in wave 5th of Wave A.
This should be last move down before it goes up in Wave B.
If this is true then we are in first wave of Wave 5th down of Wave A.
If this goes down from here in 5 waves then the 5th wave of wave A will end,
Orange - Monthly
Green - Weekly
Blue - Daily
Waves

EURAUD - Probable Wyckoff Spring - The ForecastLearn to read the chart.
The Story:
We are balancing on a significant Fib 61.8
Last SI before the fake break of Fib quite High at 17.6, probable buyers
Fake Break = Wyckoff Spring formation start. PVR quite high
Plutus comes with a Long signal PRL
Abnormal SI of 21.0 = buyers on the way down
The reaction : large up volume wave with the corresponding pip move
The Forecast and possible entry is shown on chart. If we break that Entry Level line the Spring is confirmed.

We will live to witness the greatest downward cycle DJI is in 5t wave soon to finish and soon ABC cycle will start.
The downward cycle will lead the prices to previous wave 4 towards 18000 levels
and Weekly chart:
and Daily chart:
Little bit of steam left that can take prices high, and therefore there is chance of up move in the short term

BTC 1D Head and Shoulders formedI tried to explain this the other day, but I made a mess, being tired and sleep deprived.
First, I noticed the H&S forming on the 1W timeframe, shown by VWAP.
Although it's an intraday indicator, I also leave it on bigger timeframes for this purpose. It showed a pattern IN the candles.
I tried at that point to draw it on 1D, but the pattern wasn't so obvious, so I did it on 2D, where it was more pronounced.
When I published the idea, I left the 1D chart on and started talking about 2h instead of 2D.
But, If you look at that idea now, You will see that the pattern is fully formed and clearly visible on 1D.
The idea from the other day is linked below.
Targets remain the same.
If the 27k resistance doesn't hold, we have a hole on VPVR down to 25k, and the full potential of the pattern corresponds with the bottom of the 23k-25k range.
On my trend waves indicator at the bottom, the ribbon turned bearish (purple), the selling aggression is intense (grey wave), and Binance has problems with withdrawals...
If we don't get rejected at 27k, which is possible, judging by the smaller timeframes, we could have quite a pullback.

APPL Wave AnalysisI included the text analysis in the chart.
Short term LONG potential for APPL.
We are still in a correction. Depending on how it evolves, we can take future actions.
LONG beyond the marked price level or SHORT if the price doesn't go past the marked level.
If you agree with this idea, please consider sharing it with others. Thank you.
Disclaimer: Technical analysis is for informational purposes only and should not be construed as financial advice. Trading decisions based on technical analysis are the sole responsibility of the individual trader.


BONK will do the same what DOGELON didThe first rocket wave will start soon. Take profits between 0,000015 and 0,000025.

3 waves completed INJUSDTThis is my count for INJ/USDT, currently correcting for wave 4.
usually after a strong bullish move wave 4 is a shallow correction especially if consider the rules of alternation because wave 2 made a deep correction, I am expecting wave 4 to correct between .236 of fib or .382.
there's still a wave 5 I am expecting.
(i don't trade wave 4's personally, one of my trading rules)

BTC 1W hidden Head and Shoulders pattern shown on 2h Looking at the weekly chart, I noticed a clear H&S pattern on VWAP. VWAP is an intraday indicator, but it can show a pattern in larger frames, like now.
I was trying to find a way to draw and measure it clearly on commonly used timeframes, but it is most apparent on a 2h chart.
As you can see on VPVR on the right, the neckline is below the 27100 resistance, and if it breaks it, there is a gap down to 25100. But the full potential of the pattern targets 23100.
On my trend wave indicator, the weekly trend reached a local top on the 17th and turned bearish at the +60 line. Right now, it is right above the +50 line.
That area often acts as support and resistance. And here on 2h, the trend is reversing right above the zero line, which is also strong support.
Still, since this timeframe is not usual, this could also mean that trend is being rejected from it.
The chart is bearish. Volume is low.
But the price is what it is. Trade with the trend. But it doesn't hurt to be prepared. Right?

MY ANALYSIS FOR USDCHF 2ND OF MAY 2023Here the triangle formed and there was a breakout above but unable to move up and reverse and break another one below so is likely that the market will move down big so going for short is needed

AUDUSD Trade OpportunityHey Traders,
The AUDUSD is making some bearish build-up as it move closer to the demand zone.
Watch out, for a break above the trendline
or
Below the demand area.

waves going to die 0waves going to die 0. 13 mounts losing x20 btc pair and still down.. it will be delist on binance..

NIFTY ANALYSIS - 27/04/2023BUY ABOVE - 17800
SL - 17740
TARGETS - 17900,18000,18120
SELL BELOW - 17750
SL - 17800
TARGETS - 17660,17580,17480
Trade Safe & Happy Trading Guys
This is only for educational purpose so TAKE YOUR OWN RISK REWARD

WavesUSDT“Half of me is filled with bursting words and half of me is painfully shy. I crave solitude yet also crave people. I want to pour life and love into everything yet also nurture my self-care and go gently. I want to live within the rush of primal, intuitive decision, yet also wish to sit and contemplate. This is the messiness of life - that we all carry multitudes, so must sit with the shifts. We are complicated creatures, and ultimately, the balance comes from this understanding. Be water. Flowing, flexible and soft. Subtly powerful and open. Wild and serene. Able to accept all changes, yet still led by the pull of steady tides. It is enough.”

🔥 Bitcoin's Worst Case Bullish Scenario 🚨Back in January I made an analysis on Bitcoin where I argued that the bottom was likely in. I used the support drawn on the chart as one of my main arguments. Seeing that this support has dictated BTC's price action for nearly 6 years, it's definitely one you should keep an eye on!
Seeing that there's a lot of bearish views on the market lately, I want to take a look at the worst case bullish scenario.
In my eyes, this would be a move towards the dotted purple support. A break below this point would break a 6-year market structure, which would be very alarming 🚨.
As long as we will not get a full-on stock market crash, I don't see BTC falling below this support, thus staying long-term bullish.
I don't see BTC revisiting the bottom support at this point in time. I'm first looking at the 25,000 area as explained in my Elliot Waves analysis below. Nevertheless, it's important to consider different scenario's and outcomes.

🔥 Bitcoin Rising Wedge: Oversold Bounce IncomingIn my most recent BTC analysis I talked about the rising wedge pattern that was formed and my bearish short-term view on the market. Both targets have been hit, with 27,200 marking the bottom area. Congratulations if you took the trade!
Bitcoin is currently oversold at the longer time frames like the 4H and 8H. Consequently, I'm expecting some kind of bounce in the coming 1-2 days. Ideally we will move towards the blue area where some heavy resistances lie. This would be an ideal area for the bears to short.
With the stock earnings season being much weaker than anticipated, the risk is currently to the downside. So, I'm not expecting that this is the bottom yet.
26,500 is my next target. Keep in mind that we're currently still trading in a long-term uptrend, so it might be a perfect moment for bulls to pile in, which is currently what we're seeing on quite some alts.
As explained in my Elliot Waves analysis, I see it more likely that we will go down more, simply because the supports around 25,000 are much stronger.

🔥 Bitcoin Following Elliot Waves Pattern: Fourth Wave Started?Over the course of the last few weeks I've made several analyses on BTC and the Elliot Waves pattern it's potentially trading in, see below for the most recent one.
In my previous analysis I argued that there was reason to believe that the third wave topped because we were trading inside a very important area of resistance and the RSI was touching the overbought area.
And here we are. We gave away all of last weeks gains and things are looking bleak in the near-term.
It's difficult to predict where the 4th wave will bring us, but the 25,200 support is the strongest support area in sight, so I'm holding on that area for now.
Immediate future looks bearish, but there's still a decent probability for a next wave up.
Share your thoughts🙏
Note on the lengths of the waves: take them with a grain of salt and not as an exact science. I'm merely attaching them to important areas of resistance.

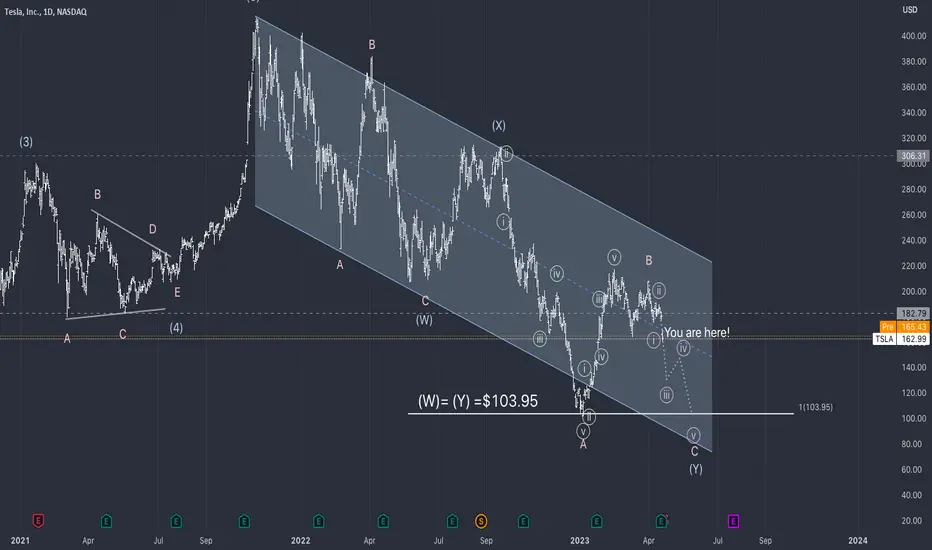
TSLA going to January Lows
TSLA - Elliott Wave Analysis
There maybe more dramatic Waves out there for Tesla. But for me I had this count since April last year so I am gonna stick with it.
I see a WXY correction. And we are now in minute wave iii of minor wave C of intermediate wave (Y).
Foron this WXY pattern the most common Fibonacci ratio is equality between W= Y. In our case equality is around 103.95
We also have natural graph support around 103 from the previous low in January our wave A of (Y).
What are your thoughts on TSLA ?
Legal Disclaimer: The information presented in this analysis is solely for informational and educational purpose and does not serve as financial advice.
Possible DAX Exhaustion LevelSome basic price action, a 5 wave pattern and technical analysis shows the DAX entering a possible exhaustion area. Couple this with COT Data versus Retail Sentiment and we could be hitting our heads back down before the 16000 level. Personally I've been trailing a long position which now has a healthy SL at a very positive level. Will keep an eye out for short signals and price action after the Easter Holiday.

AMARAJABAT Long TradeAMARAJABAT had broken its trendline into a new Impulse a year back.
The stock has managed to come to complete a Triangle wave 4 and is ready for a new leg of Wave 5
CMP 580, Target a minimum of Wave 1 which comes out to be ~700
A small SL of 34 points i.e. ~546 which is the support of A-C Trendline

NZDCHF - Catch This Breakout!NZDCHF is currently in a major ABC correction. We're in wave B and looking to catch Wave C.
Trade Idea:
- Watch for lower timeframe reversal through trendline break, BOS etc
- Enter with stops below the breakout lows
- Targets: 0.584 (300pips), 0.604 (500pips))
Goodluck and as always, trade safe!

Attack to 3 topIn the weekly period, gold is reaching a very important resistance point, if it cannot cross it and there is a correction, we will face a 3 top3 pattern.
However, in terms of waves, we are in the fourth wave, and if we break the previous ceiling, we will enter an upward trend

EURX SELL PROJECTION (LAST DROP)The market is currently in a complex correction which carries or bears three wave structure (WXY waves). As we see, wave X is about to be completed on only if the red line gets broken below. The last wave which is the wave Y is set to carry three sub waves with the 5-3-5 formation of its sub waves.
COMPLEX CORRECTION - WXY
WAVE W - 5 WAVES
WAVE X - 3 WAVES OR TRAINGLE
WAVE Y - 3 WAVES
