Hellena | SPX500 (4H): LONG to resistance area of 6140.Dear Colleagues, price has gone lower than I thought it would and now we need to redraw the waves. Apparently, the price has updated the minimum of wave “2”. Therefore, I believe that the price will soon continue the upward movement in wave “3” anyway.
The “ABC” correction seems to be completed and the 5915 area served as support for the second time.
I expect the price to touch this area once again and then continue to the resistance area of 6140.
Or it will immediately start moving towards this area.
Manage your capital correctly and competently! Only enter trades based on reliable patterns!
Waves

Ford 1D Investment Aggressive CounterTrend TradAggressive CounterTrend Trade
- short impulse
+ exhaustion volume
+ 1/2 correction
Calculated affordable stop limit
Take profit:
1/3 to 1/2 Month Trend
1/3 to Month T2
1/3 to Year 1/2
Sell F Limit at $14.95 (Good 'til Canceled)
Sell F Limit at $11.57 (Good 'til Canceled)
Sell F Limit at $10.21 (Good 'til Canceled)
Monthly CounterTrend
"- short impulse
+ 1/2 correction
- unvolumed T1
+ support level
+ reverse volume approach
+ volumed manipulation"
Yearly Trend
"+ long impulse
+ volumed T2 level
+ volumed 2Sp+
+ weak test"

Hellena | GOLD (4H): LONG - resistance area 3000.Dear colleagues, I believe that the price will still continue the upward movement and there are a couple of reasons for that.
First, the price has not completed the five-wave movement.
Secondly, 3000 is a psychological level, which is not far away and I believe that it will be reached.
Therefore, I assume a small correction, but then I expect an upward movement to the resistance area of 3000.

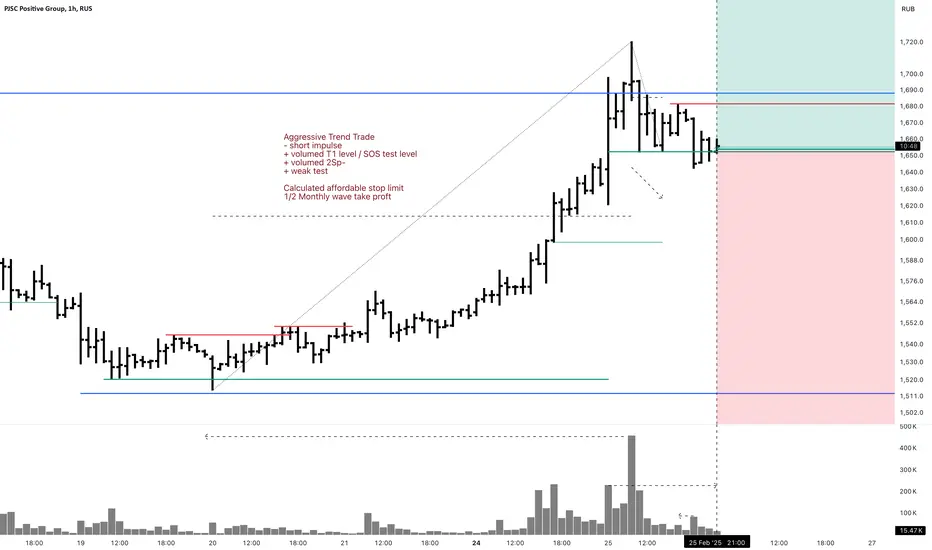
POSI 1H Investment Aggressive Trend TradeAggressive Trend Trade
- short impulse
+ volumed T1 level / SOS test level
+ volumed 2Sp-
+ weak test
Calculated affordable stop limit
1/2 Monthly wave take profit
Daily Trend
"+ long impulse?
- resistance level
- short volume distribution"
Monthly Trend
"+ long impulse
+ 1/2 correction
+ volumed expanding T1
+ support level
+ biggest volume manipulation"
Yearly Trend
+ long impulse
Weird set up. Market is strong and Monthly look a lot like exhaustion!
Long Entry on WAVESUSDT with PSAR Stop LossBased on the daily chart for WAVESUSDT on Bybit, we've identified a bullish setup for a long entry:
Indicators Used:
MLR (Moving Regression Line) in blue
SMA (Simple Moving Average) in pink
BB Center Line (Bollinger Bands Center Line) in orange
PSAR (Parabolic SAR) in black dots
200-period SMA in red
Entry Conditions Met:
The MLR is above the SMA, indicating a short-term bullish trend.
The MLR is above the BB Center Line, further confirming bullish momentum.
The PSAR dots are under the price, signaling a bullish trend.
The price is above the 200-period SMA, supporting a long-term bullish trend.
Entry Strategy: Enter a long position on WAVESUSDT given these bullish signals.
Stop Loss (SL): Set the stop loss at the current level of the PSAR dots. This ensures that if the price reverses and hits the PSAR level, your position will be closed to minimize losses.
Risk Management: Adjust your position size according to your risk tolerance.
Monitor My Idea: Keep monitoring my idea for any changes in trend or for potential profit-taking opportunities.
Thank you !

O 1D Investment Aggressive Trend TradeAggressive Trend Trade
- short impulse
+ biggest volume TE / T1
+ support level
+ biggest volume 2Sp-
+ weak test
+ first bullish bar close entry
Calculated affordable stop limit
1 to 2 R/R take profit
Monthly Trend
"+ long impulse
+ 1/2 correction
+ SoS level
+ support level
+ weak approach"
1Y Trend
"+ long balance
+ volumed manipulation
- neutral zone"

FLOT 1D Long Investment Trend TradeTrend Trade
+ long impulse
+ T2 level
+ support level
+ 1/2 correction
+ biggest volume 2Sp+?
Calculated affordable stop limit
1 to 2 R/R take profit
Monthly countertrend
"- short impulse
+ volumed T1
+ 2Sp+
+ bigger volume on test"
Yearly context
"+ long impulse
- correction"

O 1H Long CounterTrend TradeCounterTrend Trade
- short impulse
+ volumed T1
+ volumed Sp
+ weak test
+ below first bullish bar close entry
Calculated affordable stop limit
1 to 2 R/R take profit expandable to Investment
Daily Trend:
"+ long impulse
+ exhaustion volume
+ T2 level
+ support level"
Monthly Trend:
"+ long impulse
+ 1/2 correction
- SOS broken"
Yearly Trend:
" + long balance
+ volumed manipulation
- neutral zone"

Bitcoin Dominance: Elliott Wave and Harmonics Combo (Part 2)MARKETSCOM:BITCOIN Dominance ( #BTC.D / CRYPTOCAP:BTC.D ) indeed started the rise I predicted back in late '22. CRYPTOCAP:BTC rose to the limits, exceeding the 100K Mark.
In #ElliottWave, this is Cycle Wave C (turquoise).
Primary Wave ① (white) completed, with the Corrective Primary Wave ②now in play.
The Correction will pave the way for Alt Season to commence, so the focus will shift to Alt Coins.
#Harmonics are showing #Cypher Patterns, a combo actually, on different degrees.
Bitcoin Dominance ( BTC.D ) Technical Analysis:
* Elliott Wave Impulse: Cycle C (turquoise)
* Harmonic Patterns: Bullish Cyphers
* 88.6% Fibonacci Retracement
* Break-Out with Divergence
* Leading Diagonal in Primary Wave ① (white)
Conclusion:
After a last rise, expecting MARKETSCOM:BITCOIN to top-out and start a Larger Correction.
Alt Season to start and deliver, based on #BTC losing ground.
After this, CRYPTOCAP:BTC to continue ruling, as the one and only #Cryptocurrency.


NVS 1H Swing Long Conservative Trend TradeConservative Trend Trade
+ long impulse
+ 1/2 correction
+ T2 level
+ support level
- biggest volume 2Sp-
Calculated affordable stop limit
1 to 2 R/R within 1H range take profit
Daily Trend
"+ long impulse
+ 1/2 correction
+ JOC level
+ support level
- above 1/2 of entire 1D wave at the support level of 1M"
Monthly Trend
"+ long impulse
+ 1/2 correction
+ support level
+ JOC level
- unvolumed manipulation"
Yearly Trend
"+ long impulse
- resistance level
+ less than a month left and it looks to break
+ long volume distribution"
NVS @NYSE
Bought NVS Market, Day
Filled
8:27 AM
104.89325
Profit Taker
Sell NVS Limit 105.87, GTC
Submitted
8:27 AM

XRP last chances to sell at $3.33 before going to $2.50?As per note in chart. Expecting deep wave 4 correction might last till March 25

XRP - one more push leftI think bulls have only one minor push higher left to test 3.60. This is where the large impulsive rally may top and a new (a) down, (b) up (c) down consolidation in a wave (B) down should start. During that consolidation price should stay withing the range 3.63 to 2.03

Hellena | EUR/USD (4H): Short to the 1.00784 support area.Colleagues, I think the downward movement is over. Wave “3” is just developing and it may be shorter or longer than we think, but we can be sure of one thing - the end of the five-wave movement will be lower than the minimum of 1.01753.
I believe that a correction to the 1.03442 area is possible, then I expect a continuation of the decline to the 1.00784 support area.
Manage your capital correctly and competently! Only enter trades based on reliable patterns!

Hellena | Oil (4H): LONG to area of 82.000 (Wave "5"). Colleagues, all trading instruments are behaving extremely unpredictably right now due to the situation with Trump's inauguration among other things.
I see this as an opportunity to redraw the waves.
Apparently now the price is developing wave “4” and will finish it soon. I expect the price to reach the area of 82.000, renewing the high of wave “3”.
Manage your capital correctly and competently! Only enter trades based on reliable patterns!

TOTAL3 - ALT SEASON - Bull Swing CRYPTOCAP:TOTAL3 is ready for the Alt Season.
#Altcoins will be rockin' the boat in '25.
CRYPTOCAP:BTC.D is running out of steam, thus opening the door for #AltSeason to start.
The correction on MARKETSCOM:BITCOIN Dominance is the key to #Alts to shine.
1.13T MC has been touched, previous #ATH.
Now CRYPTOCAP:TOTAL3 is in a Wave 4 (#ElliottWave Triangle), with Wave 5 of the Larger Degree C Wave about to shoot.
Targets between the #Fibonacci Extensions 200-261.8%.
That's the 1.5T to 1.8T range.

SMLT 1D Aggressive Investment CounterTrend TradeAggressive CounterTrend Trade
- short impulse
+ biggest volume T1
+ support level
+ biggest volume 2Sp+
+ weak test
+ first bullish bar closed entry
Calculated affordable stop limit
1 to 2 R/R take profit
CounterTrend 1M
"+ short impulse
+ biggest volume TE / T1 level
+ support level
+ biggest manipulation?"
Trend 12M
"+ SOS test level
- far below 1/2 correction
+ support level
+ biggest volume manipulation?"
They say company is going to bankruptcy, but why would it concern technical analysis?!

XLV Swing Long 1H Conservative CounterTrend TradeConservative CounterTrend Trade
+ long impulse
+ 1/2 correction
+ T2 level
+ biggest volume Sp
- resistance level
Calculated affordable stop limit
1 to2 R/R take profit before 1/2 of the Day
Daily Context
"- short impulse
- unvolumed T1
+ support level
+ volumed Sp"
Monthly Context
"+ long impulse
- SOS level broken
- far below 1/2 correction"
Yearly Context
"+ long impulse
- resistance level"

Hellena | GOLD (4H): SHORT to the support area (2540).Colleagues, the previous forecast has gone stale and I decided to take a fresh look.
Waves are redrawn, but the target remains the same - the support area 2540.100. This is the minimum of wave “W” of the senior order.
In addition, before starting the upward movement the bulls need to gain strength. This means that the combined correction is still in progress.
Manage your capital correctly and competently! Only enter trades based on reliable patterns!

GBPUSD BULLISH SHARKThe Harmonic Pattern SHOULD NOT be used in isolation.
Combine it with 2 or 3 other confirmations to have an extra edge.
(Moving average cross, Bollinger bands, RSI, stoch ... Basically any other indicator/system you're very familiar with).
- Use Proper Risk Management on each trade.
- DO NOT expose more than 3% of your capital on each trade.

NLMK 1H Long Swing Trend TradeTrend Trade
+ short impulse
+ support level
+ biggest volume T1?
- 1 bar reversal?
+ volumed 2Sp
+ weak test to 1/2
+ first bullish bar closed entry
Calculated affordable virtual stop
1 to 2 R/R expandable to 1D if closed Sp take profit
Daily Trend
" + long impulse
+ 1/2 correction
+ JOC level
+ support level
+ volumed manipulation"
Monthly Trend
"+ long impulse
+ T2 level
+ support level
+ volumed manipulation"

Potential rise for goldHello Trader
The Impulse force for gold is rising and we have an expanding correction pattern that is expected for gold to resume its rise and we will see a break of the current high.

HUBB 1H Long Swing Aggressive Trend TradeAggressive Trend Trade
- short impulse
+ biggest volume TE / T1 level
+ support level
+ boggest volume Sp
Calculated affordable stop limit
1 to 2 R/R take profit
Daily Trend
"+ long impulse
+ T2 level
+ 1/2 correction
+ support level"
Monthly Trend
"+ long impulse
+ T2 level
+ 1/2 correction
+ support level"
Yearly Trend
"+ long impulse
+ neutral zone"
