Waves

XAUUSD LONG TRADE wave analysis
impulse wave
correction
running flat
support and resistance
liquidity
break out
pullback

Possible UPside of the AUD/USDhello traders
we have a break in the structure and an increase in the buyers’ momentum, and the price is declining in a corrective manner. It is possible that we will get another Bullish wave to grab liquidity Before the drop.


Wave Analysis Summaryhello traders
Some traders don't understand my analysis so I prepared this as a summary of what I learned in wave analysis

XAUUSD SETUP hello traders
In today's session, I am selling gold to target demand levels
Analysis
The price has reached the supply levels and there is a response that is now forming a correction to the downside. After its completion, we will get a bearish impulse wave.

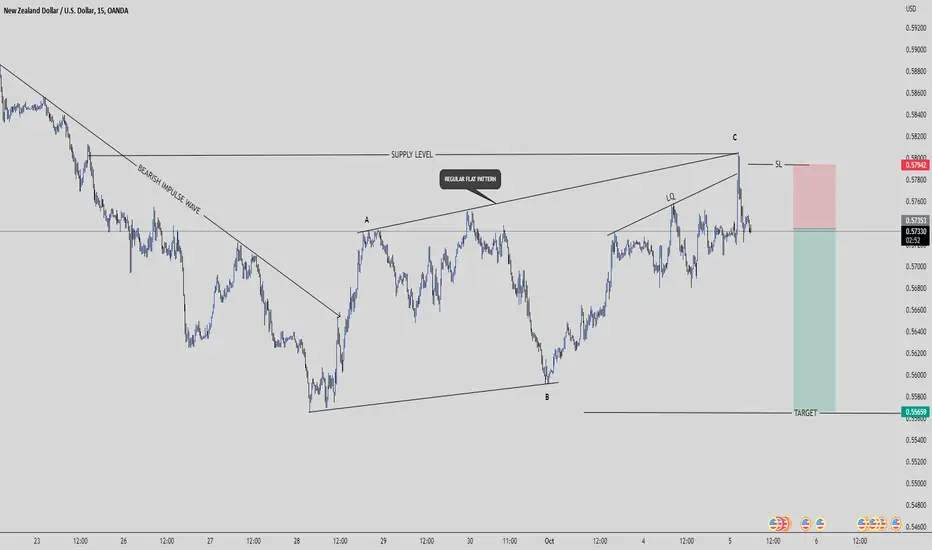
Potential Downside to NZDUSDHello Traders
In today's session I sell nzd / usd
Analysis
We have a bearish Impulse wave and we have a correction in the form of a Regular flat pattern and the price has reached the supply levels. There is a violent reaction from the sellers. We are now expected to get a bearish impulse wave that will break the bottom
EUR NZD LONG TRADE Hello traders
in today's session I'm waiting for EUR NZD for a buying opportunity to target the top
Analysis
We have an increase in the buyers’ momentum and the price is still inside the wall and an expanding correction pattern is present and there is a strong reaction from the buyers when the sellers tried to break the support level. The price is expected to retest the block of orders and rise to form a higher top

XLF daily bullish hammerOrder BUY XLF ARCA Stop 30.88 LMT 30.88 will be automatically canceled at 20230101 00:00:00 EST
XLF daily bullish hammer wave 4 of downtrend into 50% fibonacci retracement gotta be quick countertrend.

WFC daily bullish hammer at double bottom retestWFC daily bullish hammer at double bottom retest has to be quick till earnings and countertrend. Stop loss below hammer, take profit to size of last retracement.

KO daily bearish hammer wave 5 of downtrendOrder SELL KO NYSE Stop 56.37 LMT 56.37 will be automatically canceled at 20230401 01:00:00 EST
KO daily bearish hammer wave 5 of downtrend. Stop loss above the hammer, take profit at 12R.

JPM daily RSI divergence with bullish hammer wave 4 of downtrendJPM daily RSI divergence with bullish hammer wave 4 of downtrend. Gotta be quick countertrend.

DAL daily bullish hammer with RSI divergenceOrder BUY DAL NYSE Stop 28.50 LMT 28.50 will be automatically canceled at 20230401 01:00:00 EST
DAL daily bullish hammer with RSI divergence in the end of wave 5 of wave 3 downtrend. Take profit at 50% Fibonacci retracement.

CSCO daily indecision building wave 4 of wave 3 downtrendCSCO daily indecision building wave 4 of wave 3 downtrend neat capitulation panic.
Sell Stop 39.99 LMT 39.99 GTC
Buy Limit 37.44 GTC
Buy Stop 41.69 GTC

The potential downside of the EUR/USDhello traders
Long-Term Selling Opportunity for EUR/USD
we have swing point and an increase in the sellers’ momentum and an expanding corrective model. Wait for confirmation of the sellers’ entry to execute a trade


EUR CHF SHORT TRADE Hello Traders
The price has reached the supply levels and bounced off it with a downward impulse wave and retests it with a corrective upward wave and we have a reversal signal on the 5-minute frame according to the theory of closing the waves we will get another downward wave

CAD JPY SHORT TRADE Wave analysis
market structure
price action
order blocks
liquidity
impulse wave
correction
expanded flat

[10/04] Beast Trading _ Today's Bitcoin Analysis Beast Trading _ Today's Bitcoin Analysis
Bitcoin has been continuing its crossroads recently.
The fluctuation range is relatively small, and you don't see it hitting in one direction.
I will analyze it from (22.8k) when Cpi presentation.
During the Cpi announcement, the trend line from 69k was accurately hit and fell, and from 22.8k to 18.1k, it seems to have fallen to five waves.
This whole thing has a high probability of being an A.
Since then, it seems that long lateral/convergence adjustments (period adjustments) that mainly come from B waves are currently coming out.
We're almost at the end of the convergence, and I'm thinking that it's going to hit the 69k trend line at the end of the convergence and fall again.
If it falls strongly by deviating downward from convergence, it can fall by renewing the 18.1k low point line as well as the 17.6k low point line.
At the end of convergence, you always have to prepare for volatility, and now the up and down movement is likely to end and the one-way will come out.
You have to be careful when you enter the position

NVDA daily RSI divergence at the end of wave 5 downtrendNVDA daily RSI divergence at the end of wave 5 downtrend. Expect ABC correction or change of trend )))

QQQ daily indecision building in wave 4 of wave 3 downtrendQQQ daily indecision building in wave 4 of wave 3 downtrend.
Sell Stop 271.21 LMT 271.21 GTC
Buy Limit 259.65 GTC
Buy Stop 281.51 GTC

XAUUSDThe price correction of wave C from B is being completed. Soon we will see the price continue to fall.

BTCUSDTThe price is fluctuating within the specified range. The downward trend in price will continue soon.
