NIFTY 50- CORRECTION WAVES!!!i was waiting when the market will open and my waves will get confirmed, today by a gap down opening, and not breaking out the trend line, i was final with my 5 wave correction. nifty will correct till 16550 level. this week will go in a correction.
HAVE A GREAT LOOK ON THE RSI TOO.
Waves

Possible move of TSLAPossible move of TSLA using Elliot wave. Q3 deliveries missed, AI day is over, nothing impressive, it’s time to go down as the market goes deeper seeking for a bottom.
Disclaimer: I’m not a financial adviser.

S&P 500 RECESSION ANALYSIS!1. LOWER HIGHS-LOWER LOWS: price action says the actions or pattern formed by the price itself. and the people who trade in the stocks makes up the demand and supply. therefore, this affects the inflation, and there could be a major correction, if recession is announced.
2. 3200 level is getting support by FIBONNACI RETRACEMENT(0.618 AREA)
3. RSI ANALYSIS: first i thought its a rsi divergence, but it looks like rsi is yet not completed its action fully, if the markets falls further, then RSI will correct itself, and will go in the around 22 level. to make my point prove, i have drawn one more resistance line, showing RSI's resistance towards it.
the arrows what i have drawn in RSI, is to say whether it is a pullback of RSI or not, but to say so, it does not looks a like.
4. DEMAND ZONE: after a recession, the next phase is depression or expansion. it does not looks like, US markets will face a depression, so i will go with the 2nd option itself(expansion), which is also know as demand zone. so the indices will enter the demand zone, which says that markets would have reached its bnottom, and can have a fresh entries.
5. FIBONNACI RETRACEMENT & WAVE THEORY: supporting the wave theory with the fibonnaci, it looks greatly the index is supporting the fibonnaci levels, and thus forming a good corrective waves. the 5th looks way clearer, and no need to comment on it furthermore.
FINAL STATEMENT:
hence concluding my analysis, if theres a recession being announed, S&P will reach 3200 LEVEL. AND MY STATEMENT WILL THEN BE CONFORMED IF THE INDEX WILL ENTER THE LAST AREA OF FIBONACCI, AND GOES BELOW 3500(GOING TO TOUCH THE BOTTOM OF DEMAND ZONE)


WAVES triangle fractal#WAVES/USDT
$WAVES is inside a triangle that is below a long-term triangle.
🐻 if price follow the previous triangle it will breaks down the lower line to touch the descending trend lines around $3.5 and $3.2, and break down from $3 will drop price toward last long-term support around $2.
🐮 holding the lower line of 4h triangle will increase price to break out from long-term descending resistance to reach resistance zone around $4.2 and will increase more toward upper trend lines.

Elliott wave 1 Elliott wave 1 Flat graph by Nantich The traingle
Turtle and rabbit
One day a rabbit was boasting about how fast he could run. He was laughing at the turtle for being so slow. Much to the rabbit’s surprise, the turtle challenged him to a race. The rabbit thought this was a good joke and accepted the challenge. The fox was to be the umpire of the race. As the race began, the rabbit raced way ahead of the turtle, just like everyone thought.
The rabbit got to the halfway point and could not see the turtle anywhere. He was hot and tired and decided to stop and take a short nap. Even if the turtle passed him, he would be able to race to the finish line ahead of him. All this time the turtle kept walking step by step by step. He never quit no matter how hot or tired he got. He just kept going.
However, the rabbit slept longer than he had thought and woke up. He could not see the turtle anywhere! He went at full speed to the finish line but found the turtle there waiting for him.

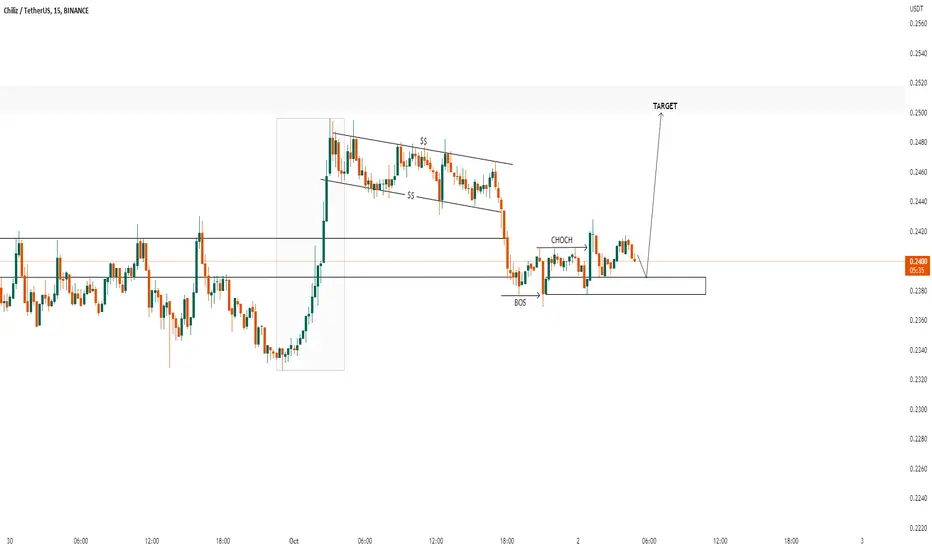
Possible Upside of the CHZ cryptocurrencyhello traders
Preparation is now underway in the cryptocurrency CHZ
Impulsive price movement
If we analyze the momentum and liquidity, we find that the preference for buyers and the chance of the price rushing up is the closest
PINS monthly put Order SELL PINS JAN 17 '25 12.5 Put Stop 6.50 LMT 6.50 will be automatically canceled at 20230401 01:00:00 EST
Wave 5 of downtrend is around the corner and then at least ABC or 1-5 uptrend.
Be ready to move ask price to something more marketable towards the capitulation event.

Nifty 50 Next Wave PredictionI used Elliott Wave and Fib to predict the future move for Nifty 50. After bounce back from 16747.70 the next wave should be 1.272 (17240) or 1.414 (17370 ) or 1.618 (17540) as I explained in the Image.

USDCAD LONGI M LOOKING FOR BUY IN USDCAD?
Price now in impulse I will wait correction then, i gonna buy it

ABNB daily bullish hammer at local pivot highABNB daily bullish hammer at local pivot high gotta be quick possibly wave 4 of downtrend. Moved my stop loss to $105.02 after this day bullish candle.

DIA bullish hammer end of wave 5 wave 3 downtrendDIA bullish hammer end of wave 5 wave 3 downtrend. Wave 4 of downtrend gotta be quick into Fibonacci 50% retracement.
Order BUY DIA ARCA Stop 295.19 LMT 295.19 will be automatically canceled at 20230101 00:00:00 EST

QQQ daily bullish hammer at resistanceQQQ daily bullish hammer at resistance don't like retest gap day before to be closed and this gotta be quick since countertrend. Stop loss below local low, take profit at new resistance.
Also, selling put QQQ Jan17'25 260 Put
Sell 1 Limit 33.00 GTC $33

QQQ daily bullish at exact bottom Order BUY QQQ NASDAQ.NMS Stop 277.04 LMT 277.04 will be automatically canceled at 20230101 00:00:00 EST
QQQ daily bullish at exact bottom expect ABC movement for wave 4 of the downtrend. Countertrend to Fibonacci retracement 50%

SPY daily indecision pressure building in wave 4 of wave 3 downSPY daily indecision pressure building in wave 4 of wave 3 downtrend nearing panic capitulation.
Sell Stop 360.23 LMT 360.23 GTC
Buy Limit 342.72 GTC
Buy Stop 371.52 GTC

SPY daily bullish hammer ABC correction for wave 4 of downtrendOrder BUY SPY ARCA Stop 368.32 LMT 368.32 will be automatically canceled at 20230101 00:00:00 EST
SPY daily bullish hammer ABC correction for wave 4 of downtrend. Expect fibonacci retracement 50% before we go lower. Countertrend.

MANAPPURAM levels, and waves!!"when a stock falls in such a fast movement, it rises based on supporting its fall".
the stock is in the range of 0.618 of FIBONNACI
good time to enter to take the advantage of 3rd wave.
stock will rise from Monday onwards.
targets are mentioned.
purple line shows the actual value the stock should be trading at. so the stock is available at a lot discount. one can go on putting more money on every time, when it falls during its rising.

BTC SHORT TRADE hello traders
We have a false breakout of the resistance area, expected to get a bearish wave to seize the liquidity and retest the block of orders before rising again


F daily hammers pressure buildingF daily hammers pressure building wave 4 of downtrend gotta be quick.
Buy Stop 12.32 LMT 12.32 GTC
Sell Limit 13.50 GTC
Sell Stop 11.47 GTC

HSBA daily bullish hammerHSBA daily bullish hammer beginning B correction or wave 2 downtrend.
Order BUY HSBA LSE Stop 486.30 LMT 486.30 will be automatically canceled at 20221231 18:00:00 EST

XLF weekly set up for ABCXLF weekly set up for ABC expect some form of retracement can zoom in on daily but expect ot to be volatile.
