MISHRA DHATU NIGAM WEEKLY TIME FRAMEThe Structure looks good to us, waiting for this instrument to correct and then give us these opportunities as shown on this instrument (Price Chart).
Note: its my view only and its for educational purpose only. only who has got knowledge about this strategy, will understand what to be done on this setup. its purely based on my technical analysis only (strategies). we don't focus on the short term moves, we look for only for Bullish or Bearish Impulsive moves on the setups after a good price action is formed as per the strategy. we never get into corrective moves. because it will test our patience and also it will be a bullish or a bearish trap. and try trade the big moves.
we do not get into bullish or bearish traps. we anticipate and get into only big bullish or bearish moves (Impulsive Moves).
Just ride the Bullish or Bearish Impulsive Move. Learn & Know the Complete Market Cycle.
buy low and sell high concept. buy at cheaper price and sell at expensive price.
Keep it simple, keep it Unique.
please keep your comments useful & respectful.
Thanks for your support....
Tradelikemee Academy
Wavetheory


EW bear market cycleThe above chart will clearly explains that the NIKKEI {and other world indices follow through} will correct for its final phase of correction(5 wave bear market) untill 2030.
japan is a well developed country with highest debt/gdp ratio

INDUSIND BANK ELLIOTT WAVE ANALYSISThis bank stock analysis is on weekly timeframe for long term value investment , the stock is showing great movement after the 2020 crash has recovered well.As shown in the chart the stock is in wave 3 of cycle degree on weekly timeframe and the wave 3 target is around 3500 in coming years.

And Grandfather rose from the ashes.And he said, may the updated Concords come to life and fly around the world in a few hours.

SPY monthly bearish hammerWon't hold long, probably going lover to wave 5 for September. Be ready to exit quick. Love how long day bullish candle lower volume than bearish. Looks like sellers were resting in August.

TATA STEEL ELLIOTT WAVE ANALYSISThe best Metal stock in Nifty 50 to invest your valuable money is Tata Steel.I t will give you the best returns in coming time more than 100 % as you can see the projected target for next third wave is 288 rupees.

USDJPY ELLIOTT WAVE ANALYSISThe pair price is traing in wave 4 of impulse shown in the chart that wave 4 pattern is double three which will end at the drawn support and pair will start wave 5 move as shown in the chart.

CRUDE OIL ELLIOTT WAVE ANALSIS SHORT TERMThe Oil is moving in small correction which will complete around 87.22 and it will start trend up.

XAUUSD GOLD Elliott Wave AnlysisThe Gold Commodity has been moving in the Impulse pattern in the weekly timeframe.Now he gold is in the Wave 4 Double three pattern W-X-Y which will complete around 1670 and 1575 usd levels.After the end of his wave 4 correction the gold will move into a big wave 5 impulse target above 2200 usd as shown in the chart levels.

US DOLLAR Index Elliott Wave AnalysisThe USD Index on monthly chart is trading in the Impulse pattern in which the wave 5 will get completed at 113 usd level and the years long rally of usd in impulsive fashion will end and the index will enter into the big correction pattern as shown in the chart.

WTI CRUDE OIL ELLIOTT WAVE ANALYSISThe crude oil commodity has been trading in big A-B-C Flat correction for last couple of months which is going to complete very soon.Around the level of 80 usd the oil will start big Impulsive Rally.Previously oil has completed the big impulse as shown in the chart .

USDCAD sniper entries with Derlsony from TANZANIA. Follow me for more trade setups with 85% to 95% accuracy for training and mentorship

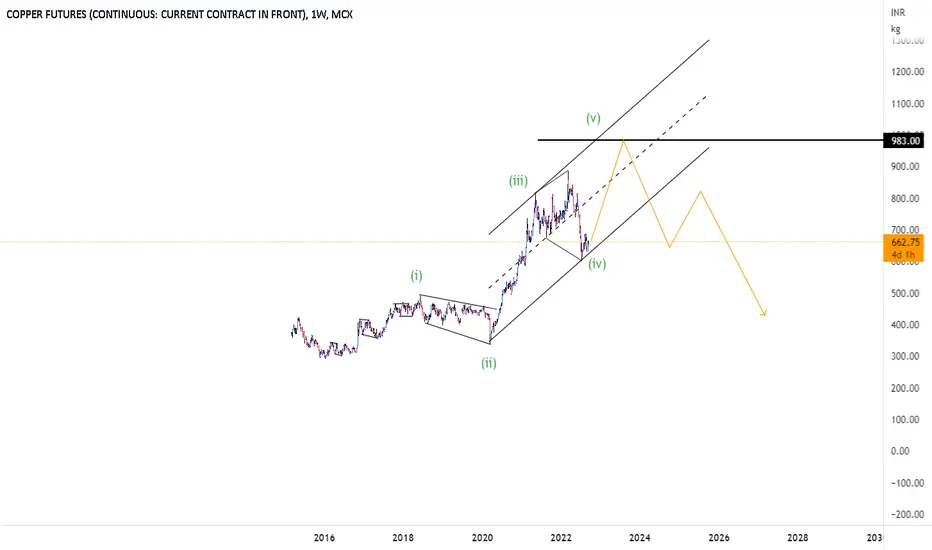
MCX COPPER Elliott Wave AnalsisThe Copper is trading in wave 5 on monthly timeframe, which has just begun its wave 5 and the target for wave 5 is 983 futures.
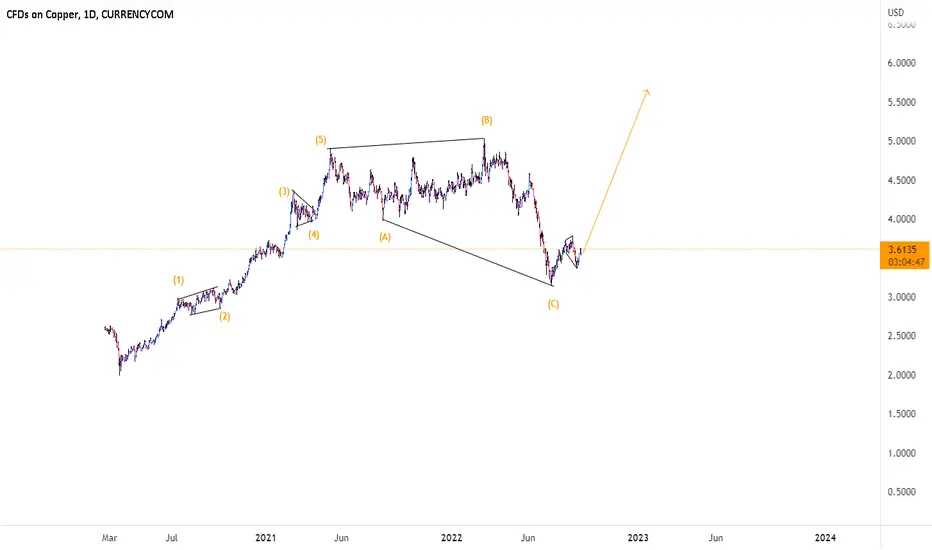
COPPER Elliott Wave AnalysisThe commodity Copper has recently ended its correction as the Expanding Flat and nowit has started the big impulsive move.
EURGBP- 120 MINS TIMEFRAMEThe Structure looks good to us, waiting for this instrument to correct and then give us these opportunities as shown on this instrument (Price Chart).
Note: its my view only and its for educational purpose only. only who has got knowledge about this strategy, will understand what to be done on this setup. its purely based on my technical analysis only (strategies). we don't focus on the short term moves, we look for only for Bullish or Bearish Impulsive moves on the setups after a good price action is formed as per the strategy. we never get into corrective moves. because it will test our patience and also it will be a bullish or a bearish trap. and try trade the big moves.
we do not get into bullish or bearish traps. we anticipate and get into only big bullish or bearish moves (Impulsive Moves).
Just ride the Bullish or Bearish Impulsive Move. Learn & Know the Complete Market Cycle.
buy low and sell high concept. buy at cheaper price and sell at expensive price.
Keep it simple, keep it Unique.
please keep your comments useful & respectful.
Thanks for your support....
Tradelikemee Academy

Zomato analysisthis is a 5 wave correction, so it should touch the support line, i have drawn a channel too which is supporting from past waves too.

DXY - 240 MINS CHART TIMEFRAMEThe Structures looking bearish, waiting for the this to correct and then give us these opportunities.
Note: its my view only and its for educational purpose only. only who has got knowledge in this strategy will understand what to be done on this setup. its purely based on my technical analysis only (strategies). we don't focus on the short term moves, we look for only for Bullish or Bearish Impulsive moves on the setups after a good price action is formed as per the strategy. we never get into corrective moves. because it will test our patience and also it will be a bullish or a bearish trap.
we do not get into bullish or bearish traps. we anticipate get into only big bullish or bearish moves.
Just ride the bullish or bearish impulsive move.
buy low and sell high concept. buy at cheaper price and sell at expensive price.
Keep it simple, keep it Unique.
please keep your comments respectful.
Thanks for your support....

Technical Analysis - The Truth - Part 2Imagine you are a detective. You arrive on the crime scene and find a body surrounded by blood at the bottom of some stairs.
The suspect says the victim accidently stabbed himself whilst he fell down the stairs. The story seems credible.
However, the Technical Analysis (the data) tells a different story. It shows that the victim was first poisoned. Then stabbed in the back. Then the body was dragged to the bottom of the stairs.
The Technical Analysis showed the fundamentals up for what they were. A story.
The same is true when trading.
Trading is a science. It is not a mystery. And it has nothing to do with fundamentals.
The Technical Analysis (data) shows that sine waves are responsible for the up and down price movement. The price follows the pattern of the sine wave. Not fundamentals.
The price does not move up because Elon Musk likes that particular crypto, or that they have started to burn more crypto than normal, or because Forbes says the Government are now backing that crypto. e.t.c
Just think about it. Light waves, sound waves, gamma waves, brain waves, electricity all travel through sine waves. They all follow the same pattern.
Price movement is no different. It follows the path, pattern and contours of the sine wave. It is the law of physics.
When the sine waves rises, so does the price. When the sine wave falls so does the price.
If you are not trading sine waves you are trading blind.
I hope this helps.
Regards
Jason

Sanofi bull run about to comewhen the waves get completed one could make profits within a short duration.
Sanofi is a great company with a good fundamentals, due to FII selling heavily and earnings not reaching the estimate, it has corrected a lot. its gaining volume, and RSI indicator also showing a bull trend coming nearer.

Bitcoin following the script as expectedOn 11th of May 2022 when $BTC was $30000 I published the idea that it will drop to $14000-$12000.
Back than we were in wave B of the correction.
Check the link below.
We are now fully underway in wave C. starting minor wave 5 of C.
So the good news that the ending of the correction is near. When wave 5 of C is done, the whole correction started in November 2021 is done.
The bad news (for $BTC holders) is that is still going down to that $12000-$14000 level. I have multiples Fib ratios pointing to that level.
This is my analysis and does not constitute financial advice.

GBPCAD Short Set-up - FX Trading Signal$GBPCAD #Forex #Trading #Signal
Entry @ 1.571
SL @ 1.540
TP @ 1.65
Technicals:
- Bullish Divergence
- Elliott Wave Bearish Impulse complete
- Bullish Harmonic
- Fibonacci Projections
Many pips ahead!

EURCHF 4 Hr. Short Opportunity! + Trading PlanWelcome back! Let me know your thoughts in the comments!
**EURCHF - Listen to video!
We recommend that you keep this pair on your watchlist and enter when the entry criteria of your strategy is met.
Please support this idea with a LIKE and COMMENT if you find it useful and Click "Follow" on our profile if you'd like these trade ideas delivered straight to your email in the future.
Thanks for your continued support!
Brian & Kenya Horton, BK Forex Academy
