Large Correction For More UpsideUSDZAR is currently forming a larger correction that I initially anticipated. This means that the correction that I had looked at before as being a 3 wave correction, was actually only wave 1 of the larger correction. Looking at the current setup, I expect price to break the low of wave one, market with the red line, before there is a reversal to the upside. I will be looking to enter the long when a reversal confirms but may look for smaller trades to the downside in the interim as well.
Happy trading!
Linton White
JP Markets
South Africa
Wavetheory

BIG PULLBACK OR BREAKOUT?I am looking at this bullish corrective structure on the daily time frame. Price is now at the top of wave 4 and needs to confirm either a breakout to the upside or a reversal for wave 5 first. I expect price to move around this level for a while before making a definitive move so will be trading both long and short positions on lower time frames.
Happy trading!
Linton White
JP Markets
South Africa

Correction For More UpsideGold has been moving according to my analysis and I am expecting more upside to come. There is currently a correction forming which could see an interim move down to complete wave 3 but from that point I will be looking for another long entry to the 1485 mark.
Happy trading!
Linton White
JP Markets
South Africa

$LINK expecting a wave 5 completion on the Impulse of wave 5 Expecting this to go over $1BN market cap very shortly. Indicators are extremely bullish - no signs of reversal thus far. Lots of thin movement showing that it's going to be volatile on the way up there.

More Upside To ComeLooking at the daily time frame on EURUSD, we can see that price hasn't reached the 23.6% retracement level as yet. I expect to see a small pullback to support where price will continue upwards and break the 23.6% retracement level. My initial target to the upside is the 38.2% retracement level.
Happy trading!
Linton White
Pro Trader, Analyst, Mentor & Money Manager
JP Markets
Pretoria
South Africa

THIS IS A REALLY NICE SETUP!Iv'e been waiting for this setup to confirm for a while now and have just entered the long position. Looking at the structure indicated in blue, we can see the initial impulse wave on the left of the chart, indicated by the first blue arrow. Then we can see a corrective structure which is in wave 3 to the downside at the moment. I have entered the long based on the break of the low of wave 1 as this is a good indication that we could see a reversal soon. I am looking to trade wave 4 to the top of the structure and will then wait for confirmation of a break to the upside or alternatively a reversal for wave 5 down first.
Happy trading!
Linton White
JP Markets Pretoria
South Africa

IT DOESN'T GET MORE ACCURATE THAN THIS!My forecast for NZDUSD to form a reversal and end wave 3 was on point. Price reversed and is now headed to the top of the structure where I will await a breakout or a pullback for wave 5.

Cad/Chf WeeklyCad/chf is setup to reach that price area long term. Coming off the weekly 200 again right now. It is a very choppy pair. But it has been testing this pitchfork median for quite a while.....

NZDUSD short term sell setupHello traders, as you can see NZDUSD is currently in downtrend and it's making nice flag for sell under the trendline. I won't take that trade because RR for me is not good and i really don't want to miss bigger move. The bigger move is upside. When NZDUSD breaks the low we will see divergence in play. Divergence could be a reversal sign. The green box is BUY zone for me.
So keep an eye on it and trade with care!
Make the bank rolls! :) $$$
My daily view and now you can see reason why I'm interesting only in long term buy!
If you like what i do click that like & follow button. Likes and followers motivate me to spend my free time posting content for you!
Thank you for your support!
All the best,
Antonio

NZDUSD 4H running flat complete NZDUSD completed a large running flat. Look for sells down to retest the lows.

EUR/USD Constantly Countin There is major potential on euro downside thats why i have been selling and going break even when possible to do so is a great idea could see some sudden moves on 30 april with the high impact news events , dont follow this its my trade this isnt a signal just to showcase my views if you wish to trade it thats your own choice .

CADJPY buy setup!Hello traders, after the 4h corrective structure we got 1h flag. Wait for the breakout of that flag and then take the trade. That breakout will confirm uptrend, next impulse! Also the bigger picture looks downside, so buying this pair is a really good idea. RR is also great for me. So keep an eye on it & be patient & trade with care!
Make the bank rolls!
My daily view!
If you like what i do click that like & follow button. Likes and followers motivate me to spend my free time posting content for you!
Thank you for your support!
All the best,
Antonio

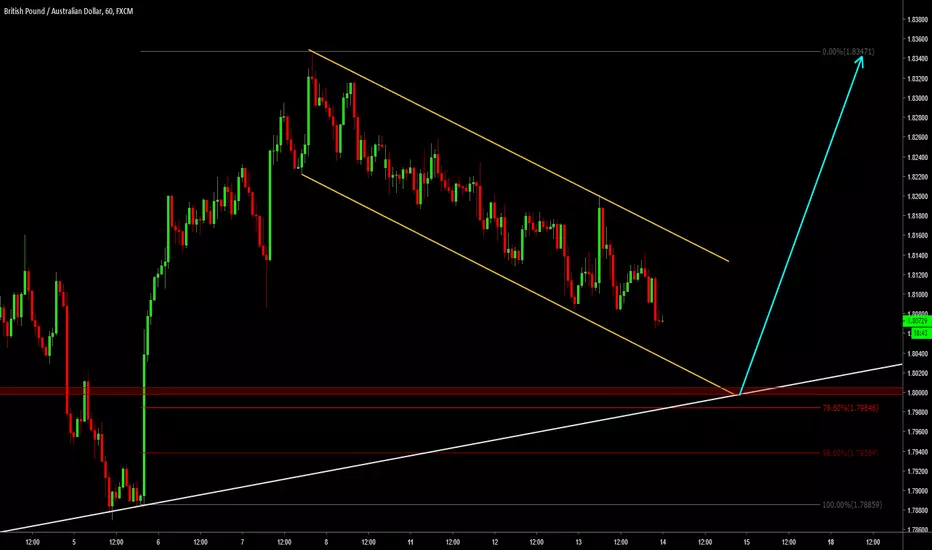
GBPAUD sell setup!Hello traders, as you can see GBPAUD is making correction under the trendline. So wait for confirmation and take that breakout! Weekly, daily, 4h also looks downside. We have a lot of divergence what is a good sign for reversal. So selling that pair is a good idea. Don't miss this one! ;)
My weekly view
Make the bank rolls! ;) $$$
If you like what i do click that like & follow button. Likes and followers motivate me to spend my free time posting content for you!
Thank you for your support!
All the best,
Antonio


GBPCAD sell setup!Hello traders,
As you can see I'm only looking for the sell at this stage. GBPCAD broke the trendline with the strong down impulse and now it's making correction (sell setup) about the trendline what is a good sign. The bigger picture also looks downside and this is the one of the reason why I'm interesting only in the sell. Wait for more sideways candle and take that sell!
BONUS: If you think it will drop fast you can put entry order at the low of the smaller correction like I did on the picture. So be aware of that type of entery because it's VERY RISKY! The safest way to entry is to wait for sideways candles!
Make the bank rolls! :P $$$$$$$$$$
If you like what i do click that like & follow button. Likes and followers motivate me to spend my free time posting content for you!
Thank you for your support!
All the best,
Antonio

USDCAD buysetup!Hello traders, USDCAD made a very strong up impulse and broke the trendline. As you can see USDCAD is making correction above the trendline. There is high probability chance for breaking the top again and this is the reason why i'm looking for buy on this pair. I'm expecting completion of the bigger daily running flat. Wait for complete correction and then take the breakout.
BONUS: When it breaks the structure and if it goes slowly put your trade at BE!
Make the bank rolls! :D $$$$ ;)
If you like what i do click that like & follow button. Likes and followers motivate me to spend my free time posting content for you!
Thank you for your support!
All the best,
Antonio
Daily view

GBPAUD Gearing Up For Next Wave LongAfter a strong impulsive wave up GBPAUD has been moving very correctively down.
If price does make it down to .8000 handle will be looking to go long.
Until then will consider getting in if we start to see bulls enter market and break north.
NATGAS Poised to Head Higher From HereNatural Gas is now sitting at a major demand zone. We could see price take off aggressively from here.

VolksWagen AGVolkswagen down side.
On the Technical Analysis approach, I'v given two scenarios on how it might develop in the near future, but remember the chart is a long term forecast.
We'll see how it goes..

EURUSD 15M Bullish OutlookAfter the strong impulse up (at a key level of support) the bulls are showing signs of strength.
Price is currently in a corrective phase, so will only be looking for short-term longs at this time.
Trade with care! :)

GU - 400 pips potential profit? FX:GBPUSD
Well, I target price is going to make another drop & test the bottom TL. Then only continue UP.
For confirmation, wait until price break TL
.
TAYOR

UCHF - LONG & AIM FOR THE SKY FX:USDCHF
Buy if price retrace to right shoulder & we can observe a bullish divergence at the right shoulder.
Tight SL will do.
Target @ 1.0000
Trade At Your Own Risk
