AMD 1W: If Not Now — Then When?The weekly chart of AMD looks like it’s holding its breath: a well-defined falling wedge, double bottom support, and price pressing right against long-term trendline resistance. Everything’s in place — now it just needs to break and run, preferably without tripping over nearby Fibonacci levels.
The stock is trading around $114 and attempting to hold above the 50-week MA. Just ahead is the 200-week MA (~131) — not only a technical hurdle but also a psychological pivot. A move above it could reignite talk of $150+ targets.
The wedge has been narrowing since late 2024. After repeated bounces off support, price has returned to the top of the pattern. A confirmed weekly close above the wedge could trigger a real breakout. Without that — it risks yet another scripted pullback.
Key Fibonacci levels:
0.618 — $133.60
0.5 — $151.42
0.382 — $169.25
0.236 — $191.30
0.0 — $226.95 (all-time high)
The roadmap looks clean — but only if volume follows through. There are signs of quiet accumulation at the bottom, but no explosive buying just yet.
Fundamentals:
AMD delivered solid Q1 results: revenue is growing, EPS beat expectations, and margins are holding. More importantly, the company launched a new $6 billion stock buyback program — showing clear internal confidence in its long-term trajectory.
There’s also a strategic AI partnership underway with a Middle Eastern tech group. This move positions AMD to challenge not just for GPU market share, but for future AI infrastructure dominance — long game stuff.
Analyst sentiment has turned bullish again, with new price targets in the $130–150 range. All of this makes the current chart structure more than just technical noise — it’s backed by strong tailwinds.
Wedgebreakout

Why I Went Long on AMD Near the 2025 Lows🔍 Reason for the Trade
This wasn’t just a “buy the dip” setup — this was a calculated trade based on strong confluence:
✅ Multi-Year Demand Zone
Price returned to a massive support level that’s held since 2020. This zone had previously triggered multiple large bullish reversals.
✅ Falling Wedge Breakout
A textbook falling wedge pattern formed during the pullback. Once price broke out, the momentum confirmed a structural reversal.
✅ Risk/Reward Optimization
I positioned my stop just under key support, with targets set at prior structure highs. The setup offered a clean 2.5:1+ R/R ratio, perfect for swing conviction.
✅ Institutional Accumulation Area
The volume and wick rejections in this zone screamed smart money stepping in. It was a classic sign of fear-based selling into patient buyers.
🧠 Lessons Reinforced
- Wait for the Zone, Then Act: Patience paid off — the best trades come from the best levels.
- Structure Over Emotion: I trusted the technical, not the bearish headlines.
- R/R Always Wins: You don’t need to be right every time, but when you’re right — let it run.
#AMD #SwingTrade #TechnicalAnalysis #SupportAndResistance #WedgeBreakout #RiskReward #PriceAction #StockMarket #TradingView #TradeRecap

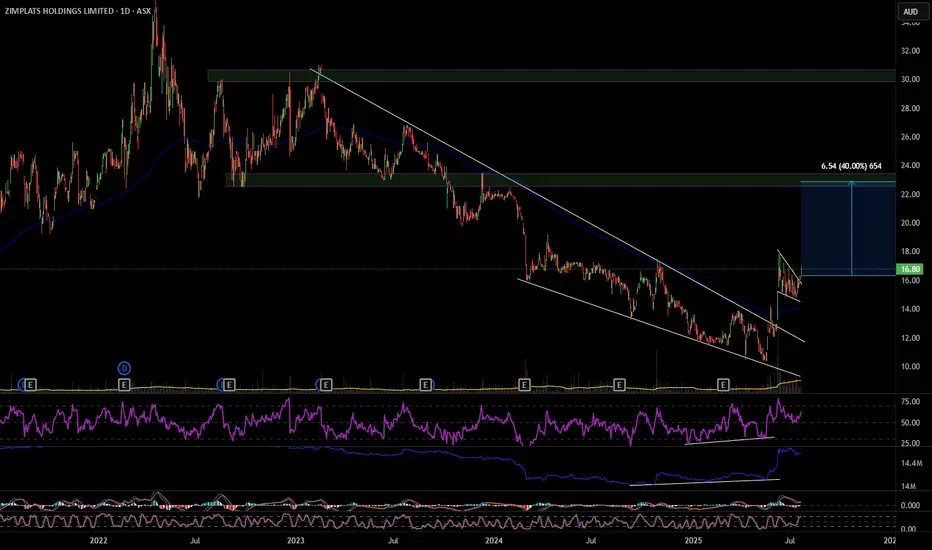
ZIM 40% move up
ZIM has broken out of a descending wedge with bullish RSI and OBV divergence, also multiple divergences on smaller time frames. On the hourly it's had a pull back and formed a bull flag that it has also broken out of. ZIM looks to have formed a change of structure forming higher highs and higher lows, my first target will be $22.90 a move of 40%. Definitely one to consider. Good luck and happy trading 🍀
NATURAL GAS - REBOUND FROM THE MAJOR TRENDLINE AND ANOTHER LONG CAPITALCOM:NATURALGAS
Last week on Wednesday and Thursday we observed the false breakout of the major trendline. Eventually, Thursday ended up bullish, gaining 4.8% day-to-day. On Friday the asset has been trading majorly sideways, retesting the major trendline (pic 1). Technically, looks like the divergence on RSI, MACD and Momentum works out as well as the bullish wedge (pic 2). Fundamentally, we still have warm temperature weather forecasts in the U.S. and bullish Thursday's EIA report. Additionally, today the market opened with a bullish gap and continues to grow, which is a good signal for the buyers.
Considering major levels here, I decided to open long positions:
🔼 a market buy order at 3.4556 with
❌a stop loss at 3.2995 and
🤑a take profit at 3.7927
At 3.6000 would be reasonable to reduce long position on a half. Thank you for the attention!

NC HAMMER CRYPTOOn my videos posted on another platform that starts with a Y. You can see once it breaks the wedge it typically has a bullish outcome. Good luck and have fun with it.

$LDO PUMP TO $1.20📊 1. Trend Analysis
HTF (Higher Time Frame) Bullish: Long-term trendline shows sustained upside momentum with 3 clean touches, indicating trend strength.
LTF (Lower Time Frame) Bearish: Short-term structure broke down from the trendline but is now showing signs of reversal with a falling wedge breakout.
📈 2. Chart Pattern
Falling Wedge: Classic bullish reversal setup. Price has broken out with strong momentum.
OBV (On-Balance Volume) shows bullish divergence—volume is rising while price was falling, signaling accumulation during the downtrend.
🔄 Market Structure
Swing Highs and Lows are respected—showing healthy structure.
Recent swing low held near the demand zone.
Break and retest of key levels and trendlines indicate potential continuation to the upside.
🟪 Supply & Demand
Demand Zone (~$0.65): Provided strong support, origin of latest move.
Supply Zone (~$1.15): Likely to offer resistance; aligns with upper FVG and volume gap.
🔵 Fair Value Gaps (FVGs)
Filled/Partial Below: $0.65–$0.68 – already mitigated.
Unfilled Above: Around $0.98–$1.05 – may act as a magnet for price.
🧠 Psychological Levels
$0.90 and $1.00: Price magnets due to trader behavior. Expect increased reaction or consolidation at these levels.
🔴 Volume Profile
High Volume Node (HVN) around $0.85–$0.95: Indicates acceptance zone where price may consolidate.
Low Volume Gap above $1.10: If price clears this, a fast move to $1.20+ is likely.
✅ Bullish Confluences
Falling wedge breakout confirms reversal potential.
OBV divergence supports accumulation narrative.
Price bounced from demand zone and reclaimed broken structure.
Room to move into FVG and low-resistance areas above.
❌ Bearish Risks
Rejection at $1.00–$1.05 psychological/FVG level.
Breakdown below $0.86–$0.88 invalidates bullish setup.
Heavy supply at $1.20 could cap upside.
📌 Summary
Bias: Bullish. Expect move toward $1.00–$1.15.
Confirmation: Clean break and hold above $1.00.
Invalidation: Break back below $0.86 swing low.

EUR/USD Triangle Pattern – 1H Timeframe
📊 EUR/USD Triangle Pattern – 1H Timeframe
🕐 Date: 17 June 2025
📌 Chart by: GreenfireForex
🔷 Pattern: Contracting Triangle (ABCDE)
🔍 Context: Forming inside Wave (4) – possible breakout before Wave (5)
📈 Upside Potential: Break above triangle → target near 1.16500+
📉 Downside Risk: If fails to break up → revisit demand zone around 1.15000
---
🔮 Possible Scenarios:
✅ Bullish Breakout:
Breaks above wave (e)
Clean rally toward target zone
Ideal for a long setup with tight SL
❌ Bearish Fakeout:
Rejection from triangle resistance
Falls back into demand zone
Look for reversal or retest opportunities
---
🎯 Strategy Tips:
Wait for a breakout candle
Use SL outside triangle zone
Entry based on confirmation – avoid early trades
💬 Let’s discuss live market reaction as price nears triangle edge. Stay ready .

Wedge Pattern – Simple Explanation
📚 Wedge Pattern – Simple Explanation
A wedge pattern is a shape on the chart that looks like a triangle or cone. It tells us that the price is getting ready to break out — either up or down.
---
🔻 Falling Wedge (Bullish)
Looks like price is going down, but slowly.
Lines move closer together.
Usually means the price will go up soon.
It's a bullish signal (good for buying).
---
🔺 Rising Wedge (Bearish)
Price goes up, but losing strength.
Lines get closer together.
Usually means the price will go down soon.
It's a bearish signal (good for selling).
---
💡 Easy Tips:
Wait for breakout (big move out of the wedge).
Use a stop-loss below/above the pattern.
Target = height of the wedge.
---
📌 In Short:
Wedge = Squeeze pattern.
Falling wedge = Buy chance.
Rising wedge = Sell chance.
---
Let me know if you have sny doubt in comments

The What vs. The Where - A 2nd Breakout Pattern After A Nice WinA few days ago we looked at a bullish breakout opportunity on Silver and it played out perfectly. After a lovely move to the upside, price has started to consolidate again providing us with a very similar setup.
HOWEVER, just as in the case of the first, we need to be aware that once again the WHAT doesn't necessarily align with the WHERE stopping this from being a Grade A trading opportunity.
Please leave any questions or comments below and remember to hit that LIKE button before you go!
Akil

Small Clues In A Big Breakout PatternSilver has been consolidating as of late and if there's one thing we no about contraction is that it eventually leads to expansion aka a breakout.
The issue with this particular setup is that based on location of the pattern, there's no predetermined directional bias for the breakout.
Therefor, what we're doing today is looking for small clues that the market has provided to give us any type of edge in predicting a breakout one way or another and guess what. WE FOUND SOME!
If you have any questions or comments, please leave them below!
Akil

INFY 1H Chart Analysis (Bullish Bat + Falling Wedge)NSE:INFY
INFY 1H Chart Analysis (Bullish Bat + Falling Wedge)
In this 1-hour chart of Infosys Ltd (NSE: INFY), a Bullish Bat Harmonic Pattern has completed at point D, suggesting a potential reversal zone. Additionally, a falling wedge formation adds to the bullish confluence.
1. Pattern Structure:
The chart displays a complete Bullish Bat Pattern (X-A-B-C-D).
Point D aligns with the PRZ (Potential Reversal Zone), with a CD leg extending \~1.618 of BC, supporting a bullish reversal.
2. Falling Wedge Pattern;
A falling wedge, generally a bullish pattern, has formed from point C to D.
A breakout above the wedge trendline may confirm a bullish move.
3. Price Action:
The price is testing the upper boundary of the wedge.
Buying interest is visible at the P,R,Z near ₹1,540–₹1,545.
Trade Plan:
Buy Entry: Above ₹1,555 (confirmation breakout above wedge)
Stop Loss: Below ₹1,538 (beneath point D and wedge support)
Target 1: ₹1,568 (previous resistance)
Target 2: ₹1,611 (mid-term resistance)
Target 3: ₹1,631 (major swing high)
A strong bullish confluence exists with the harmonic pattern and falling wedge. Wait for confirmation above ₹1,555 before entering. Maintain proper risk-reward with a stop below ₹1,538.
NSE:INFY NSE:NIFTY NSE:CNXIT

INOX WIND BREAKOUT Target Levels
- Short-Term Target: 204–211.
- Medium-Term Target: 261–343
Stop-Loss Levels
- Short-Term Stop Loss: 184.2 near immediate support
- Medium-Term Stop Loss: 157.1–153.8 strong support zone
- Long-Term Stop Loss: 170.6 major trend support

DOTUSDT , 1HrPattern is looking Good , If BTC is Sustaining Above 1,06,834 this level then , This DOT pattern will Give a Good Breakout ,
Enter only When Upper Trendline is Breakout
Take Your Own Risk According to your Capital .
Follow for More Ideas Like This

ADAUSDT , 1HrPattern is looking Good , If BTC is Sustaining Above 1,06,834 this level then , This ADA pattern will Give a Good Breakout ,
Enter only When Upper Trendline is Breakout
Take Your Own Risk According to your Capital .
Follow for More Ideas Like This

EUR/JPY 1H: Bullish Falling Wedge Breakout + Target 🧠 Overview of the Setup
The EUR/JPY currency pair has recently completed a Falling Wedge pattern, a classic and powerful bullish reversal formation. This chart structure typically signals the end of a downtrend and the potential beginning of a strong upward impulse.
In this setup, multiple confluences point toward a bullish move, including pattern breakout, structure shift, retest of a dynamic support level, and alignment with major supply/resistance zones.
🔍 Pattern Analysis: Falling Wedge
Definition: A falling wedge is a technical pattern formed by two downward-sloping trendlines — one representing resistance and the other support — that converge. It signals a slowdown in bearish momentum, often preceding a bullish reversal.
Chart Observation: The wedge is well-defined, spanning several trading sessions. As price action tightened toward the apex, bearish momentum began to weaken.
Breakout Trigger: Price broke convincingly above the upper wedge boundary, suggesting the start of a bullish reversal.
✅ Implication: The breakout confirms that buyers have taken control, especially as this move is supported by a structural Change of Character (CHOCH).
📈 Price Action Structure & Key Zones
1. Minor Resistance (Broken)
After the breakout, price encountered a minor resistance zone just above the wedge. This area is now likely to flip into support (a classic breakout retest).
2. Major CHOCH (Change of Character)
A CHOCH indicates a break in market structure — from lower highs and lower lows to higher highs and higher lows.
The break above this level confirms a shift from bearish to bullish sentiment.
3. Curved Support (Black Min Curve)
A rising curved trendline has formed below current price, acting as a parabolic support structure.
This suggests not just a trend reversal, but increasing bullish momentum, as buyers step in at higher levels with each correction.
4. Major Resistance Zone (Target Area)
Price Target: ~164.50 – 165.50
This zone has historically acted as strong supply and is marked for potential take-profit or observation for reversal signals.
The target is derived from both horizontal resistance and the projected height of the wedge pattern.
🎯 Trading Strategy
Component Details
Entry Zone 162.50 – 162.60 (retest of minor resistance + curve support)
Stop Loss Below 162.00 (beneath wedge and curve)
Take Profit 164.50 – 165.50 (major resistance)
Risk/Reward Approx. 1:2.5 to 1:3
🔸 Conservative Entry: Wait for bullish confirmation (bullish engulfing candle or pin bar) on the support retest.
🔸 Aggressive Entry: Market buy after confirmation of curve bounce or on lower timeframe bullish signals.
📊 Volume & Momentum Consideration
Although volume isn’t shown on this chart, volume confirmation on the breakout would significantly strengthen the bullish bias. Look for:
Increasing buy volume on breakout
Lower sell volume on pullbacks
Bullish divergence (if using RSI or MACD)
⚠️ Risk Management & Event Awareness
Be cautious of unexpected JPY-related economic releases (e.g., BOJ announcements, inflation data) that may cause volatility.
If the curved support is broken decisively, this could invalidate the setup, suggesting further consolidation or downside risk.
🧠 Psychological Perspective
The Falling Wedge reflects a market where sellers are gradually losing control — pushing price lower, but with less conviction. As the wedge tightens, bulls prepare to step in. The breakout confirms that sentiment has shifted, and many traders use such setups as entry points for swing or momentum trades.
The curved support line suggests a transition from accumulation to markup phase, which typically leads to faster price expansion as confidence in the uptrend grows.
✅ Summary
✅ Pattern: Falling Wedge (Bullish)
✅ Breakout: Confirmed with CHOCH
✅ Support: Curve trendline acting as dynamic support
✅ Target: 164.50 – 165.50 major resistance
✅ Bias: Bullish (until curve support is broken)
📣 Final Thoughts
This is a high-probability bullish continuation setup backed by price structure, pattern breakout, and support alignment. The risk is well-defined, and reward potential is strong — making this a favorable setup for swing traders or short-term position traders.
💬 Let me know what you think in the comments — are you going long EUR/JPY?
👍 Like and Follow for more setups and breakdowns.

$MRNA – Long-Term Setup Brewing | Major Move Incoming?Moderna ( NASDAQ:MRNA ) may be gearing up for a multi-month reversal after a prolonged downtrend. Price action is compressing in a tight base, suggesting a potential 6+ month breakout could be in the cards.
📊 Key Technical Notes:
Trading near long-term support with signs of accumulation
Bullish divergence forming on RSI and MACD
Volume contraction hints at a volatility expansion ahead
Overhead resistance sits between $60–$80, aligning with previous breakdown levels from 2023
⚠️ Breakout Trigger: Watch for a decisive move above $29.50–$30 on volume. A sustained breakout could initiate a powerful move toward the $60–$80 resistance zone.
📍 Levels to Watch:
Breakout zone: $29.50–$30
Resistance targets: $60, then $80
Key support: $25–$26
🧠 This is a longer-term swing trade idea — ideal for patient traders looking to front-run institutional rotation into beaten-down biotech names.
#MRNA #Moderna #SwingTrade #BiotechStocks #LongTermSetup #TechnicalAnalysis #StockMarket #BreakoutSetup #OptionsTrading #TradingView

"Nifty 50 Near Resistance: Wedge Signals Reversal or Breakout"1. Trend Channel: The index is moving within a well-defined **upward sloping channel**, marked by two parallel purple trendlines.
* Price is currently hovering near the **upper boundary** of the broader ascending channel — a potential area for either breakout or rejection.
2. Short-Term Rising Wedge: A narrow rising wedge is visible (formed with tighter converging trendlines in the last few candles).
* Rising wedges are generally considered bearish reversal patterns, especially near resistance zones, suggesting potential for a pullback.
3. Resistance Levels: 25,031.30 : Immediate resistance (recent high & wedge upper boundary). A breakout above this could lead to a strong bullish continuation.
Upper channel trendline: Around 25,050–25,100 zone — further confluence resistance.
4. Support Levels: 24,982.55 Near-term support (bottom of the wedge structure). A breakdown below this level confirms wedge breakdown.
24,767.50 : Strong horizontal support from prior consolidation zone.
24,561.90, 24,407.75, and 24,272.20 : Sequential key support levels for downside targets if a breakdown accelerates.
**Volume Analysis:**
1. Volume Spike seen during the recent bullish candles, indicating strong buying interest. However, during the formation of the wedge, volume has declined, signaling weakening momentum— a typical precursor to a breakout or breakdown.
Possible Scenarios:
Bullish Scenario:
Break above 25,031.30 with volume could initiate a **fresh leg of uptrend**, possibly targeting the upper end of the channel (\~25,100+).
Bearish Scenario:
Breakdown below 24,982.55 from the wedge pattern could trigger a **short-term correction**, with immediate targets at 24,767.50 and 24,561.90.
The bearish divergence between price action and declining volume further supports this view.

SWIGGY MAY DELIVER ON TIME Swiggy's stock has been facing challenges recently, with its share price hitting an all-time low after the IPO lock-in period ended. The company has been struggling with profitability, and its losses widened to ₹1,081 crore in Q4FY25, compared to ₹555 crore in the same period last year. Despite this, analysts remain cautiously optimistic, with 13 out of 20 maintaining a "buy" rating on the stock.
Swiggy's food delivery business has shown strong growth, but its quick commerce segment, Instamart, has been underperforming compared to competitors like Blinkit. The company has been aggressively expanding its store count, but rising expenses have impacted its bottom line. Some analysts believe Swiggy is following a similar path to Paytm, struggling to convert losses into sustainable profits.
- Revenue Growth: Swiggy's revenue has been increasing steadily, with a 45% year-on-year growth.
- Profitability Concerns: The company reported a net loss of ₹1,081 crore in Q4FY25, nearly double the previous year.
- Market Sentiment: Analysts remain cautiously optimistic, with some maintaining a buy rating despite recent stock declines.
- Stock Price Target: The average long-term price target for Swiggy is ₹600, representing an 87.32% upside from its current price.
- Competitive Position: Swiggy continues to dominate the food delivery market, but its quick commerce segment (Instamart) faces stiff competition.
- Market Sentiment: Despite recent losses, Swiggy remains a midcap stock with strong investor interest.
Overall, Swiggy's stock is facing selling pressure, and traders may want to watch for breakout signals before making a move
BUT PERSONALLY I WILL ADD SOME QTY AT CURRENT LEVELS.

$GRAB Long Term Trade IdeaTaxi and delivery service stocks all look bullish at the moment. Lyft and Grab are both a couple of my favorite longer term swing trade/investment plays just based off risk/reward and how beaten down both the stocks are.
If shown patience this trade could work wonders. I like it a lot because it gets me a little exposure to assets outside the U.S. and from a chart perspective its hard not to love a setup like this.
1. The buy side volume shown here is the highest its ever been for the stock by a long shot.
2. Price has been in a descending wedge type formation for several months now and is attempting to make a breakout, though this month's candle still has a lot of time left.
3. That hammer candle, especially considering it being printed on the 1M timeframe, is incredibly bullish in my eyes.
This chart reminds me a lot of NYSE:BABA but a bit earlier in its breakout stages. To me it is clear that accumulation has been taking place for over 2 years now and a big markup is upon us.
I have 3 take profit areas marked based off a few different Fibonacci levels I like that also have confluence with supply/demand dynamics present on the chart.
multiple daily/weekly candles below $4 could be a a good stop loss area as that would invalidate a lot of the bullish structure. Based off the current price this provides you with a minimum 2.75x RR trade and a maximum of 7x RR.
My average price is $4.25. Any pullbacks below $4.50 I will be looking at as great buying opportunities.
Will do my best to update this idea periodically over the next year or so.

Alibaba - This Chart Speaks In Money!Alibaba ( NYSE:BABA ) prepares for a significant pump:
Click chart above to see the detailed analysis👆🏻
Basically since Alibaba was listed on the NYSE, it always perfectly respected market structure. With the recent rejection away from the key neckline, Alibaba is now creating a bullish break and retest. After bullish confirmation, this forms a bottom and we might see new all time highs.
Levels to watch: $110, $140
Keep your long term vision,
Philip (BasicTrading)

Watch This Wedge! AUDNZD Primed for Upside PushThe AUDNZD pair forms a falling wedge pattern, a bullish reversal formation that typically occurs after a downtrend. The price action is being squeezed between a descending resistance line and a descending support line, creating a narrowing range. The market is now attempting to break out of the wedge, with the current price testing the resistance line. A breakout and close above this trendline would signal bullish strength and could lead to a reversal of the recent downtrend.
Targets:
TP1: 1.07605
TP2: 1.07922
Stop Loss: Below the recent low at 1.06542

GBPUSDRising wedge with bearish divergence, break of 1.3360 , which is the neckline of double top, break of this neckline starts the immediate sell pressure.

Bullish on Monthly TF.
Bullish on Monthly TF.
17.71 is the Monthly Resistance.
Immediate Support is around 16.80 - 17
Breaking 15 will bring more pressure towards
is around 13.50
Upside Targets once 17.71 - 17.80 is Crossed,
can be around 22 - 23
