WEAT - Trend line breakout signal2 months of volume dry up during this multi-month wedge basing pattern. Seasonal strength in play.
You don't need to know what's going to happen next to make money ~Mark Douglas
Lose like a pro and keep trading, or lose like a novice and quit ~Mark Ritchie
Wedgebreakout

US Stock In Play: $LULU$LULU - Consumer Cyclical | Apparel Retail
breakout of year long bullish wedge pattern, retaking its 200MA, AVWAP from ATH and YTDH with higher lows since late may'22.
latest ER on 1/9 reports continual YoY growth for both EPs (+33%) and Sales (+29%)

#Ethereum #ETH - looks like bearish confirmationETH might confirm the rising wedge breakout and start another leg down
But we have an invalidation point at $1,672.5
Fingers crossed for all ETH HOLDERS, dear Crypto Nation
Comments & FOLLOW appreciated 🤗
*not financial advice
do your own research before investing

ETH Ascending wedge breakout.1H charthello friends,hope you all having a good day!
ETH touched our first target,then,broke out from this acsending wedge.manage your risk properly and set your orders!
good luck!

ETH Merge breakout or wedge pattern continuation ❓❓❓ETH Merge breakout or wedge pattern continuation ❓❓❓
Ethereum in a clear rising wedge entered from the upside >> that is 🐻ish >> target at FIB golden pocket
But fundamental good news might surprise everyone dear Crypto Nation
Let me know your thoughts in the comments
*not financial advice
do your own research before investing

GBJPY wedge breakGBPJPY broke out of its wedge and is beginning its retest. Expecting further pushes down.

ETH Falling Wedge Breaking OutLooks like ETH is going for it.
TP 1 and 2 in the chart.
DYOR
Follow me. I will be sharing a ton of ideas during this last quarter of 2022. 😃

ETH Falling Wedge Breakout Completed! 2H chartthis is actually an update on previous idea.looks like the wedge broke out successfully and we'll probably see 1700 soon. second target which is 1800 depends heavily on today's NFP report.
so,set your buy orders and enjoy!

ETH/BTC inside an expansion wedgeWhen breaking the wedge there is a high chance that the price will reverse upwards.

2X $SPY TP1 HIT! (SELLS FROM TRENDLINE)ON AUG.17th, I sent out the signal for spy to reject the trendline and fall more than 5%! The move was more than 5% and still running. On the 1HR there is a falling wedge, and it has broken out with a fake breakout, we will look to see if there is a retest then we could see a pullback to the $405 area. However, due to the volatility and speculation I am still heavily bearish!

Descending Wedge Breakout on ETH - 1H charton the previous idea ,we had a successful short on ETH.
but now ,ETH is trying to breakout from this descending wedge with 2 targets around 1700 and 1800.
this is most probable since we have a merge coming on ETH and a double bottom on BTC.
just wait for confirmation ,and find a good entry!
good luck all!

WHAT TO EXPECT ETHEREUM MERGE SEPTEMBER 10 (CHART)Wedge pattern and merge in mid September, actively strong against btc.
ETH?BTC review at 4q of video

XCUUSD - 240 MINS CHARTThe Structure looks good to us, waiting for this instrument to correct and then give us these opportunities as shown on this instrument (Price Chart).
Note: its my view only and its for educational purpose only. only who has got knowledge in this strategy will understand what to be done on this setup. its purely based on my technical analysis only (strategies). we don't focus on the short term moves, we look for only for Bullish or Bearish Impulsive moves on the setups after a good price action is formed as per the strategy. we never get into corrective moves. because it will test our patience and also it will be a bullish or a bearish trap. and try trade the big moves.
we do not get into bullish or bearish traps. we anticipate and get into only big bullish or bearish moves (Impulsive moves).
Just ride the bullish or bearish impulsive move. Learn & Know the Complete Market Cycle.
buy low and sell high concept. buy at cheaper price and sell at expensive price.
Keep it simple, keep it Unique.
please keep your comments useful & respectful.
Thanks for your support....

Bitcoin wedge formation?Looks like a wedge formation on the bitcoin 5 minute chart. Will it break up or break down ? the trend is down so it is more likley to bream down although there has been some really large whales playing the trend lets see what will happen and if it meets either target?

Rising Wedge Breakout We saw a strong wick on the daily get rejected by the resistance at 143, and we looking to enter on the 4H pullback after the rising wedge breakout
CHFJPYcurrently hovering at the Daily Resistance Level and has broken out of a bearish Rising Wedge Pattern the key level is broken and Retested so, i predict a bearish move to go and retest the previous support around 138.00
TRADE RECOMMENDATION
SELL CHFJPY
ENTRY PRICE : 141.500
STOP LOSS : 144:00
TAKE PROFIT :138.00
EXP 1 OCTOBER 2022

$SMMT Next Target PT 2 and higherSummit Therapeutics Inc., a biopharmaceutical company, discovers, develops, and commercializes medicines to treat infectious diseases in the United States and Latin America. It conducts clinical programs focusing on Clostridioides difficile infection (CDI). The company's lead product candidate is ridinilazole, an orally administered small molecule antibiotic that is in Phase III clinical trials for the treatment of CDI. It also offers SMT-738, for combating multidrug resistant infections primarily carbapenem-resistant Enterobacteriaceae infections; and DDS-04 series for the potential treatment of infections caused by the Enterobacteriaceae. The company was founded in 2003 and is based in Cambridge, Massachusetts.

$ANPC Next Target PT .55 and higherAnPac Bio-Medical Science Co., Ltd., a biotechnology company, researches, develops, markets, and sells multi-cancer screening and detection tests using cancer differentiation analysis technology and device to corporations and life insurance companies in the People's Republic of China. It also offers physical checkup package services. The company was incorporated in 2010 and is headquartered in Lishui, the People's Republic of China.

MATICUSDTHello my dear friends
Previously, we had a shopping analysis together and according to the analysis, we also ate Target (;
As soon as we reach the target range, we updated an analysis on the previous analysis, which we expect to form a corrective trend.
Our correction process is not yet complete.
If the range of $0.8891 is completely consumed, we expect a reaction in the range of $1.0032. It seems that we can make a good profit by observing the specified loss limit.
We would be happy to hear your comments.

SPX500 DAX40 NASDAQ - more downward pressureSPX500 DAX40 NASDAQ - more downward pressure
Next support levels:
DAX at 13,000 (FIB golden pocket)
NASDAQ at 12,612 (FIB 50%) and 12,275 (FIB golden pocket)
SPX at 4,028 (FIB 50%) and 3,938 (FIB golden pocket)
Likely we meet these targets IMO dear Crypto Nation
*not financial advice
do your own research before investing
Wedge Forming, I Want To Catch The Retest!The way I see it, the market can break either way from this position.
The current market structure could yield two possible long entries and one quality short entry.
I'm not going long in this market, because it's currently trending down, but I'd be more than happy to catch the retest at the base of this wedge.
Look out for the trade update, if the short scenario plays out!

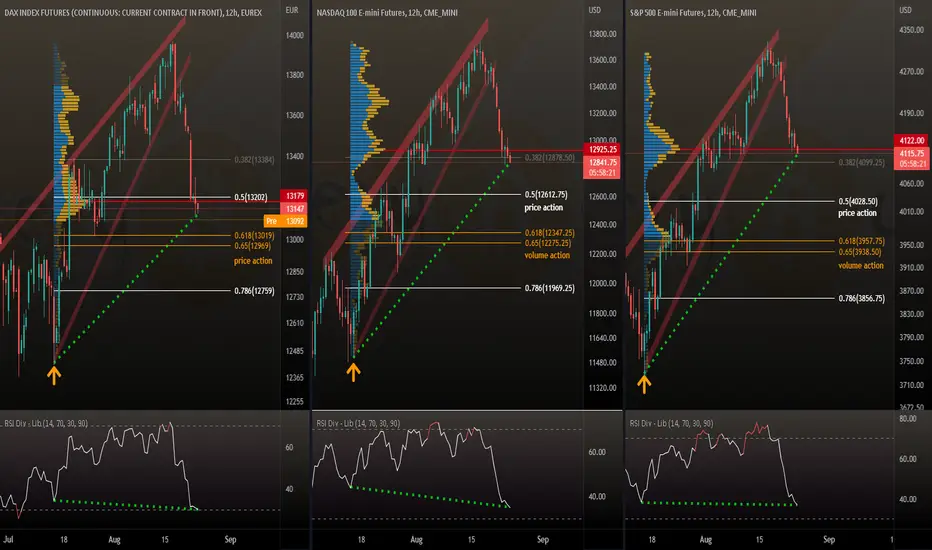
SPX500 DAX40 NASDAQ - volume support after breakdown ??!!SPX500 DAX40 NASDAQ - volume support after breakdown ??!!
All three traditional indices had a breakout of their rising wedges to the downside
Might be time for some recovery since prices meet volume profile support
Also hidden bullish divergence still in play
What do you think dear Crypto Nation
*not financial advice
do your own research before investing

EUR-CADin eur-cad pair the falling wedge is occur and arrow and price should be narrow and this is daily strong support and time to buy

short-term analyze for btc (bitcoin)hello guys
as you see on chart, btc form in a ascending channel and at the end of the rising price, the quality of the trend has decreased until break down bottom line of wedge or bullish trendlin!
now price is at the bottom of the channel and it is so possible it has a very short upward movement until...
let me explain two scenarios:
scenario 1:
after breaking down bottom of wedge price formed a long bar candle and every long bar candle has a hidden gap on it. on this case hidden gap formed on $22395 and this price is so much suit for short position until reach and touch that liquidity pool. i mean $20070
scenario 2:
this chart had decision point before breaking down and this area it is so valuable for short positin, i mean $24174 by sl= $25000
always do your own research.
If you have any questions, you can write it in comments below, and I will answer them.
And please don't forget to support this idea with your like and comment.
BE PROFITABLE
