Wedgebreakout

bearish HEAD & SHOULDER forming on ETH 1H chartas you can see,there is a head and shoulder reversal pattern forming on ETH.H&S breakout will be simultaneous with the ascending wedge breakout which will promise much lower prices.but for now 1720 would be a good target.good luck and remember always WAIT FOR CONFIRMATION.

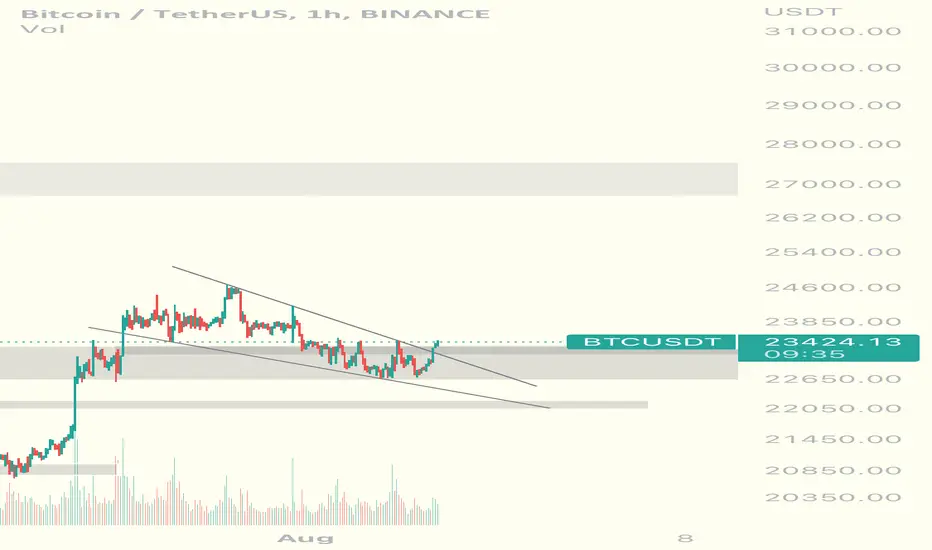
BTCUSDT - showing bearish signs..BTCUSDT
price is contracting between two trendlines, if price price makes a bearish break of the structure then after a pullback if price shows rejection, I expect the price to move lower..
Trade Wisely
*The content on this analysis is subject to change at any time without notice, and is provided for the sole purpose of assisting traders to make independent investment decisions.

Bitcoin Bearish Rising Wedge PetternIf Bitcoin Breakout In Lower Side To Next Support 21700 If Break Upper Side To Next Resistense 26000,27000

ETHUSDTFormed patterns define a kind of perspective for us.
Keep in mind that as long as the price range of $1592.81 is maintained, we will not have the mindset to form a corrective trend, so the upward trend can continue up to the white range ($2191.67).
But if the current trend is lower than the price range ($1592.81), there is a possibility of forming a corrective trend similar to the drawn scenario.
We would be happy to hear your comments.

COMP is trying to breakout Rising wedge pattern Hello guys ,Today i saw an interesting wedge pattern on Compound and i thought it will be a good setup.
open your position after breakout.(wait,don't open your position fast !)
first target is between 43.00 and 47.00.(it's safe to close your position)
but if it's going to break the first Support Area , you can close your order between 26.00 and 29.00.
it's just an idea , always do your research and analysis.
don't forget to follow and boost this idea :) thank you.

NEAR ….perfect?I’ve been using this combo of indicators and it has worked very well for me. It’s not perfect but the combined MA works well with the wedge.

USDCAD Long: Excellent Buying Opportunity To Take Now!USDCAD is giving us an awesome entry to go long. The trigger for this trade is an ending diagonal pattern (the wedge shape between the dotted lines).
Why do we like this setup do much? A diagonal pattern is a sign of exhaustion. The choppy, shallow-sloped, overlapping price action is an excellent sign that price is weakening, and is due for a change in trend. Clear momentum divergences on the MACD and RSI support this idea as well.
On top of this, the pattern comes at the very end of another pattern we love to see: an expanded flat (as outlined by the (A)(B)(C) labels). This gives even more confluence to our idea, as a flat pattern is one of the core corrective patterns we trade here at Parallax.
Exactly how you enter is up to you. You can enter now, or wait for the highs around 1.2950 to be breached first. Regardless, the invalidation level for this trade is 1.2766; price must not move past that level for this wave count to remain valid.
This trade setup was created using the rules and guidelines of the Elliott Wave principle. We love the Wave Principle: it's our #1 choice when it comes to forecasting and technical analysis. We strongly believe that no other trading system gives you the same level of confidence when trading. The wave principle provides a rules-based approach for trade entry and exit, as well as active position management.
At Parallax, we focus on wave analysis and 1-on-1 education to build a foundation of skills that give our clients the edge.
We trade Crypto, Forex (FX), and equities. We keep our analysis simple, clear, and easy to execute. Comment below if you would like to see more trade ideas, Elliott wave analysis, and market updates.

$GRAB - Buy with upside of +50% to +90% Technical Analysis
Oversold with weekly William %R and RSI starting to show reversal signs.
Daily RSI crossing above 50 and looking ready to curl upwards.
Price consolidating between $2.60 - $3
Broke out of the wedge.
Price Target
Buy between $2.60 -$3.00 or above $3 for confirmed breakout.
Analyst Price target: $4.6 (
Fib Level Price Target of $5.70 (upside of +90%)

BTC BULLISH FLAG.1H chartBtc bullish flag-wedge breakout in 1H chart.could notice a double bottom in 15m chart too.acceptance above 23300 could lead to a massive bullish impulse to 25000 and 26600!
Buy Low Sell HighAfter the failure and exit from the increasing wedge, we see the price entering the consolidation range, where you can set your trades at the bottom and top of the trading range with confirmation in lower time frames.

CARDANO ADA Possible BREAKOUTWhile the Market pumps, ADA stays in its Wedge.
Possible Breakout on the horizon though, its testing its Resistance line of the Wedge. Wait For confirmation in the Small Parallel channel or Daily closing above the Wedge.

Tesla showing signs of a possible bullish breakout
TSLA has been consolidating in a very slightly ascending wedge (possibly triangle) after a decent run up & is now currently looking at breaking out & heading for another rally towards a new high, possibly towards that 1k mark before losing steam
Watch for a successful close above the descending resistance for confirmation of successful breakout!
I've added 2 major areas of resistance to be aware of to consider profit taking
Will update as more data is available
*Symbol tags below*
Will be checking the crypto pairs for Tesla soon too ( BTC / USD / USDT / DOGE ) for further breakout signs
NASDAQ:TSLA
CAPITALCOM:TSLA
FTX:TSLAUSD
BITTREX:TSLAUSD
BITTREX:TSLABTC
FTX:TSLABTC
BITTREX:TSLAUSDT
FTX:TSLADOGE
COINBASE:BTCUSD BINANCE:BTCUSD INDEX:BTCUSD
BINANCE:DOGEUSDT

Eurcad long setup....Am waiting for the bullish breakout of the wedge pattern on the 4H to long this pair for at least 2.89R.....
Like and Subscribe.

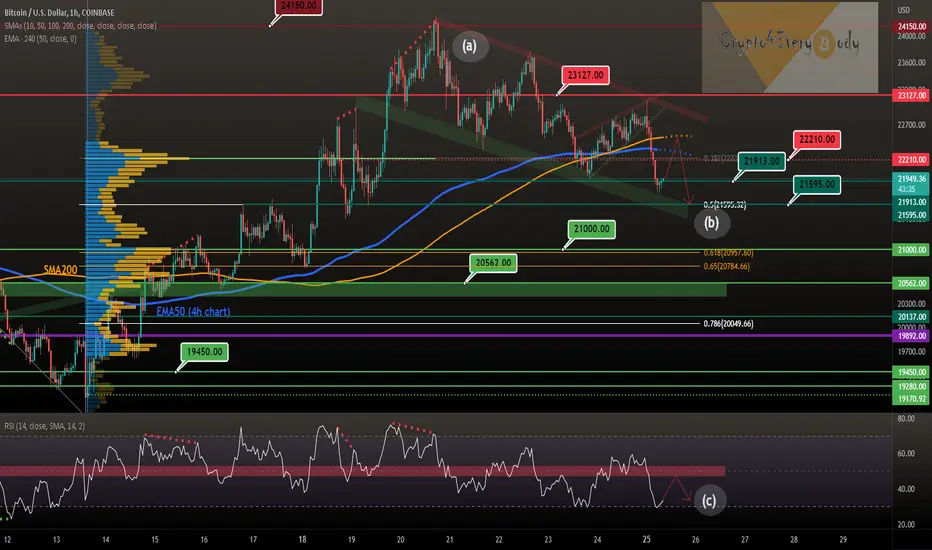
Bitcoin short-term view - breakout of rising wedgeBitcoin short-term view - breakout of rising wedge
(a) but BTC is still in a bullish flag
(b) a second leg down to FIB50% and at price action support $21.595 possible
(c) a bullish divergence playing out would be great
Have a great day dear Crypto Nation
*not financial advice
do your own research before investing

BTC outlook for 18 July 2022. BTC respecting the strong support zone, following the wedge nicely. Currently BTC is making a nice bullish push towards the next resistance zone around 22,6k. If we can continue with this momentum and close above this strong resistance zone I believe BTC will continue pushing upwards to tests the next major levels around 26,7k in the near future.

TORO ENERGY: Breakout from 15 year old wedge pattern (This is a technofundamental idea. I assume familiarity with the uranium market fundamentals).
We can see a breakout from a large wedge pattern, going back as far as 2007. The recent pullback looks like a backtest of the wedge. A low risk entry point in my book, if you're looking to position into the uranium market.

Ascending Wedge forming on BTCA potential ascending wedge is forming on 1H BTC chart.expext BTC to drop from highest peak.you could see volume decreasing in the wedge as it builds higher highs which gives this pattern strength.good luck!

SUSHIUSDTI think it is very bullish, or do you have the same opinion!?!?!
If the corrective movement trend does not fall below the price range of $0.918, the possibility of forming an upward trend similar to the drawn scenario is not at all out of mind.
On the other hand, Ethereum and Bitcoin have not yet issued a signal for an upward trend!!!
As long as the loss limit is met, you can make a trade worth the risk and reward.
We would be very happy to hear your comments

US100 - Breakout from wedge patternPrice broke and retested wedge pattern and reacted on ascending trendline. From harmonic point of view possible some move up towards 78.6 or 88.6 Fibo of last bearish impulse to fulfill harmonic pattern.

Does the downward trend continue?As a reminder, I attached this educational image in the analysis
The famous pattern, the wedge pattern in the financial markets

BTC: QUICK rade for short term tradingHeres a quick trade for you short term traders scalpers or whatever
ON THE 15 MIN TIMEFRAME WE HAVE A BEARISH WEDGE (as shown on the chart
Entry 21.3k
TP:20.5k
Enjoy and go take a look on my other related idea.
You're all losers
Peace out.
