GRTUSDT Ready for the breakout?The price is testing the demand zone on 0.26$ below the monthly support on 0.29$.
On the daily timeframe the price is creating a descending channel, and now the price is creating a falling wedge inside it.
How to approach it?
We need to wait the clear breakout from the supply zone at 0.35, where the market has the dynamic and static resistance.
IF the price is going to have a breakout According to Plancton's strategy , we can set a nice order
–––––
Keep in mind.
🟣 Purple structure -> Monthly structure.
🔴 Red structure -> Weekly structure.
🔵 Blue structure -> Daily structure.
🟡 Yellow structure -> 4h structure.
–––––
Follow the Shrimp 🦐
Wedgebreakout

BNB/USDT WEDGE BREAKOUT
Wedge breakout occured.
We got a nice volume as we desire.
RSI resistance is broken.
Price also crossed up the Fibonacci retracement level 0.618
The setup will be more reliable if it crosses up the 4h 200 period SMA, the red one.
You can hit the like button if you want to appreciate my work and motivate me.

BTC : Correction till 42000$Hi every body
I see a wedge
I see the end of wave 5 (wave yellow)
i see the end of wave 1 and start wave 2 (wave blue)
so i think we are in wave 2 and i expect a correction wave
If price break resistance 39200$ (R1) then 41000$ and 42000$ could be our next resistances

AirBnB breakout in the worksHello Friends!
AirBnB had a great earnings report and seems to be leading the way in travel. There might be a good trade in the works to break to the upside (wedge breakout) to it’s 1st resistance of $174.52. If it can hold above that level, I think it might have some steam to go after $189.41 and $204.96.
These days good news can flip to bad news overnight, trade with caution.
As always thanks for your follows, likes, and comments. Let’s learn and grow together. Cheers!
*This information and publication is not meant to be, and do not constitute, financial, investment, trading, or other types of advice. Do your own research.

GBPJPY SHORTGBP/JPY Short
From a technical perspective, there's a high probability that price will reject our entry zone and drop to our bearish targets.

$RNDR - get ready for the wedge breakoutRNDR has been ranging in this wedge in the last 2 days - which could also be seen as a bullish flag to be honest
if we see a breakout to the upside, we can expect a good rally to the following resistance around $2
locally bullish on RNDR if we see a good breakout
what do you think about this?

MATICUSDT is testing the key level! 👀The price is testing the monthly support on 1$ it's a historical and key level.
As you can see the price got liquidity for a bounce on that area and now is going to retest the previous demand zone as new supply zone.
How to approach?
The price found ave a rejection from that area with a new bearish impulse until the monthly support again. The scenario is invalidated if the price is going above the 1.3$

4H timeframe: forming a falling wedgeBitcoin broke the trend line support. But the question is: Is this a breakdown or a trap?
This breakdown cannot be confirmed at this time. On the other hand, it can be seen that Bitcoin has formed a falling wedge pattern. The TSI indicator also shows a positive divergence. Looks like this could be a trap and there is a possibility of a break-up of this wedge. In this case, you can expect a local top.
To confirm or reject this hypothesis, one must wait for the wedge pattern breakout

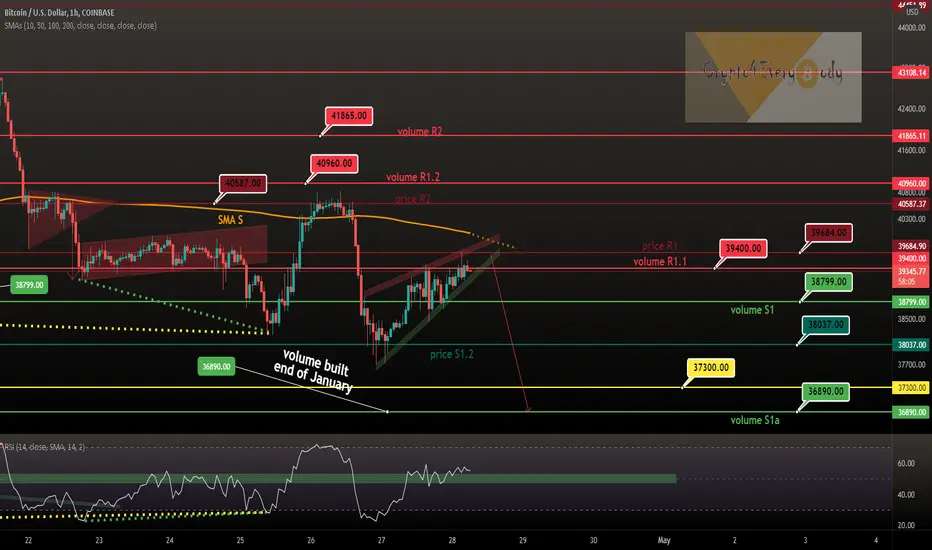
Bitcoin short-term view - BTC in rising wegdeBitcoin short-term view - BTC in rising wegde
A breakout to the downside more likely - target can be $36.890 - a volume support from January.
Would be interesting to see the reaction at $37.300 - the important monthly price level (see my other ideas and tweets).
But maybe now its time for another Crypto surprise.
Drop me a nice comment if you'd like me to analyze any other cryptocurrency.
*not financial advice
do your own research before investing
Call Option Setup *ATER*Speculating that ATER will break 5.20 resistance and move up towards $6 a share. Im looking to buy a $5 call option expiring 4/29. A perfect wedge is being set up, good buy oppurtunity in my eyes.

AAVE USDT BULLISH EMERGINGHourly to Daily Chart
RSI Momentum from Support Line down at 150
Next Resistant is 200 then 300
Possible good Entry point lower 150s

ENJUSDT is creating a dalling wedgeThe price is testing the daily support on 1.3 inside a falling wedge after a rejection from the 4h resistance. Daily support is a key level.
On the bigger picture, we can spot a demand zone above the weekly support on 1.176$
How to approach?
the price could have a pullback until the previous 4h support now resistance on the dynamic resistance as well. If the price is going to have a rejection, we could see a new bearish impulse until the weekly support. The scenario is going to invalidate if the price is going to have a clear breakout above 1.4
–––––
Follow the Shrimp 🦐
Keep in mind.
🟣 Purple structure -> Monthly structure.
🔴 Red structure -> Weekly structure.
🔵 Blue structure -> Daily structure.
🟡 Yellow structure -> 4h structure.

LUNA/USDT : Moving into a formed falling wedge ! BINANCE:LUNAUSDT
Hello everyone 😃
Before we start to discuss, I'll be so glad if you share your opinion on this post's comment section and hit the like button if you enjoyed it!
$LUNA has formed a falling wedge which is bullish in majority; But as we all know, The leading bias on market is bearish.
Also $LUNA is moving above a critical S/R zone and it's important to hold!
That's why the chart comes up with two possible Scenarios...
📈 Bullish Scenario : If $LUNA breaks above the wedge, Then the terms for bulls will comes up with a bullish continuation; But it need to break above the $92's S/R line for further movement!
- You can locate your Longs on a proper retest of $92's broken line towards $98's resistance zone.
📉 Bearish Scenario : If $LUNA breaks below the wedge, Then the terms for bears will comes up with a bearish continuation; Also on the Wedge's rejection, We'll face the S/R zone's rejection neither.
- That makes this opportunity for Traders to located their Short on a proper retest of broken points ( Wedge or Zone ).
Hope you enjoyed the content I created, You can support us with your likes and comments!
Attention: this isn't financial advice we are just trying to help people with their vision.
Have a good day!
@Helical_Trades

EURO - Wedge to a bull trendEURO - Wedge to a bull trend
hello everyone
As I have mentioned before In my previous analysis, we have a wide divergence and we can have a reverse pattern by the end of the week ( double bottom ideally). I expect to see a good bull bar with almost no shadow on ether side on daily.
The last week's candle closed with a long shadow and a small bear body that can be the end of selling pressure hopefully.
our resistance level is 1.09$ and our support level is 1.078$, and I expect to have the price touches our resistance level by the end of this week.

GER40 (DAX40) Weekly Gann Analysis. Will it BREAKOUT? CAPITALCOM:DE40 Falling Wedge Pattern (Weekly)
The index is testing resistance of the falling wedge once again for 5 weeks in a row.
Weekly candle close above 400 will indicate a breakout from the downward trend with a target of 16,200 if the breakout sustains.
Good Luck!

EURUSD bullish breakout of wedge pattern, growth expectedEURUSD
price started growing from support/resistance structure, and price also made a breakout of wedge structure, if price continues to hold above the upper trendline of the wedge I expect the price to move higher.
Trade Wisely
*The content on this analysis is subject to change at any time without notice, and is provided for the sole purpose of assisting traders to make independent investment decisions.

rune great longbig liquidity zone we are in now you can see it goes back a couple weeks now. resistance turned into support. this looks like a gigantic falling wedge to me we just broke and are came back down to accumulate more. 4 hr chart i see a massvie cup and handle. low rsi and mac d finally turning white on the 1 day makes me believe we are in a re test liquidity grab stage before we moon. next couple days weeks should be massive upside in my opinion.

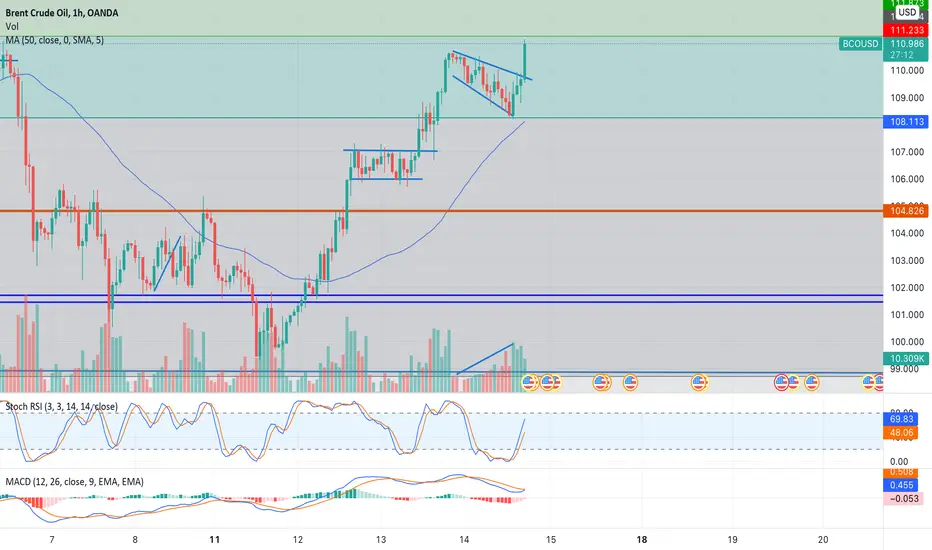
Descending Broadening WedgeBrent Crude Oil has fallen quite far from its yearly high of $135. That was almost two months ago. Ever since the price crashed down to $100 in less than two weeks from the high, the price has been swinging very nicely between Fibonacci levels. I had done some analysis of that in a previous post. However, today I will be analysing two chart patterns that have formed. The first that has already broken out is a flag. This is a specific chart pattern that forms after there has been a quick steep price rise (pole) and then a consolidation period (flag). The second is a descending broadening wedge.
Ideally from my learning, you want the flag patterns and any chart patterns to be on the daily timeframe. That is how I learnt it, I have had some success trading chart patterns on a short timeframe and I have largely seen other people do the same. However, I don’t know if this is just luck or actual trading. So, I will still use them just for educational purposes so that you may know what would be the case if it was on the daily or weekly frame.
The flag pattern has already broken out so there’s no point in analysing it apart from getting a price target:
Difference between bottom of pole ($99.938) to the top ($107.086) = $7.148 * 0.46 (percentage meeting price target) = $3.28
Add that to the bottom of the flag ($106.003) = $109.29.
The Flag pattern has already broken out and reached its price target. So the main focus will be the Descending Broadening Wedge.
Breakeven Failure Rate for upward breakouts: 18%
Average Rise: 32%
Throwback Rate: 62%
The bottom of the pattern has found support at the 0.62 Fibonacci level. The price, ideally, should touch (not cut) the trendlines five or more times. A good split between the two trendiness. That isn’t really the case here. However, the volume has been trending upwards. This is of course ideal. The price target for this pattern is quite simple for upward breakouts, it's just the peak. So that would be $110.632. This trade may be a quick one, however. The pattern has formed between two Fibonacci levels so the price may rebound once it hits the upper level. Also, as you can see from the Stochastic RSI (upper Indicator on the bottom) a bullish cross over has emerged. Also, the MACD (lower indicator on the bottom) could possibly be closing in on a bullish cross over.
Well, this is a bit embarrassing because by the time I finished my analysis the pattern broke out and reached its price target haha.
EURUSD bullish breakout of wedge pattern, growth expectedEURUSD
price bounced from support/resistance structure, and price also made a breakout of wedge structure, if price continues to hold above the upper trendline of the wedge I expect the price to move higher.
Trade Wisely
*The content on this analysis is subject to change at any time without notice, and is provided for the sole purpose of assisting traders to make independent investment decisions.

XRPUSDT > The Perfect Place for A Buy.Analysis of #XRPUSDT
XRPUSDT established very well defined support trend lines and resistance trend lines
if the market falls down to test the support level near 0.600-05500 we can then trigger a long-term buy entry.
however if the market rally and break above 0.9500 we can also look to enter in the direction of the breakout as well
⚡ Be aware that due to the global tension we currently live In, markets are not following or respecting chart patterns and technical analysis.
________________________________________
💭 | Comment your thoughts below, I always answer.
📥 | Feel free to message me if you have any questions.
Thanks for your continued support!

BTC outlook for 6 April 2022. BTC trading within this wedge and has a strong support around the 45k level. Here's what I want to see next from BTC:
1) Current daily bar to close back within the wedge having made a rejection from the 44k level. If this happens then it is clear that the support level around 45k is very strong and that BTC is likely to continue bullish.
2) After closing back within the wedge I would like to see bullish continuation and a break out above the wedge.
BTC has a very choppy range to fill from 45k to 50k looking to the left, but as long as my support holds I expect BTC to close it.

GOLD 2009 vs TodayThis is self explanatory. See the chart.
Top chart is today, bottom chart is 2009. Color coded tops and bottoms. History repeats itself it seems.

BTC outlook for 3 April 2022. As mentioned yesterday, BTC made a retest on my short term trend line and taking the fake out in to account as well is now making a double touch on my short term trend line. I would like to see BTC respect my short term trend line and keep pushing upwards towards the next major resistance level around 48k, before making a break out to the top side of the wedge.
