Possible trade for AUDCADWhen we look at the chart we can see that the wedge has been broken. It did try to breakout of the resistance level but that was not successful.
Please let me know in the comments what you think of it.
Wedgebreakout

EUR/GBP ideaWhen we look at the chart we can see that the wedge has been broken. It is rough to say what is going to happen now. I will wait to see what happens on Monday because the US is not open today so it will be a slow ending of the week.
The thing that could happen is that it will go up and than does a retest of the wedge but there is also a chance that it will not do a retest because this is something that happens a lot since the pandemic.
The risk reward ratio will be good in this trade but we have to wait and see what it does on the opening on monday
Please let me know in the comments what you think of it.
If you like the idea than please give it a like and follow me for more trade ideas.
If you have any questions feel free to PM me.

Can gold break the wedge??When we look at the chart we can see that gold is close to a wedge. Will it be able to break the wedge?
Please let me know in the comments what you think of it.
If you have any questions you can always PM me.

Possible trade for GBPCADAs we take a look at the 15min chart we can see that there is a wedge formed and that the price is testing the wedge. What I think is going to happen is that the price will go above the wedge and than do a retest of the wedge before it will go up good. What we need to keep in mind is that since the pandemic there was a lot of trades that broke a wedge but did not retest the wedge. So what also is a chance is that it just takes off and does not do a retest.
Please let me know in the comments what you think of it.
If you like the idea please do not forget to like and follow me for more trading ideas.
If you have any questions you can always PM me.

Idea for USD/CHFWhen we look at the chart we can see that the wedge on the 15min has just been broken. Will be waiting for the candle to close but look very good for a short trade. Do keep in mind that it has a very close SL. Also notice that the US had a holiday today so that the market will be slow today so the chance is big that if you enter the trade that you need to keep it over the weekend. If you do keep the trade over the weekend be sure to have a good risk management to cover possible gaps if there is news on the weekend.
Please let me know in the comments what you think of this idea.
If you like the idea do not forget to give it a like and follow me for more ideas.
If you have any questions feel free to PM me.

Breakout of Huge Falling Wedge..LONG IT..2R TradeBreakout of HUGE Falling Wedge
Entry / SL / Target on Chart
Decent RR
Huge Divergence on RSI too

Will AUD/JPY break the wedgeAs we can see on the daily chart of AUD/JPY there is a wedge that is being tested for a few days now. Will it be able to break below the wedge?
Please let me know in the comments what you think of it.
If you have any other questions feel free to PM me.

Trade idea for EURUSDWhen we look at the chart we can see that the wedge has been broken. We do have to wait and see if there is going to be a new retest of the wedge. When there is a good retest we could consider to go long on this one.
Please let me know in the comments what you think of this.
If you have any questions you can always PM me.

Trade Idea Completed, CHFJPY, Target Price 114.004Trade Idea Completed, CHFJPY, Wedge Pattern, Target Price 114.004

Trade Idea for AUDJPYWhen we look at the chart we can see that there was a breakout out of the wedge. What I think is that it is a fake out and that the price will drop one more time before it goes up. If this is a breakout and it can brake above the resistance zone than I will also be looking to go long on it. What we also need to keep an eye out for is that if the price is going to drop. That it does not brake the lower wedge that you see on the chart.
Please let me know in the comments what you think of it.

Idea for DXYWhen we look at the chart we can see that the candles are close to the wedge. What we are waiting for is for the candles to break above the the wedge. When that happens we need to see if it is able to break above the resistance level. If it breaks above the resistance level we could go long than. When it gets rejected at the resistance level we wait for it to do a retest of the wedge and when that than happens we go long. We do have to keep an eye out for the resistance level if we go in after the retest of the wedge.


Possible drop in S&p500When we look at the chart we can see that there was a wedge breakout on the 1H chart. I think that this will be a wedge fake out and that we will see real wedge breakout when it will retest the wedge. We can see that it closed very close to the wedge. We will have to see what it does when the market will open but i personally think that there is a good chance of another drop.
Please let me know in the comments what you think.
Disclaimer: This is just only for educational purpose. I am not telling you to Buy/Sell anything.

USDRUB LongFrom a monthly PoV, pair has retraced to around the 61.8% fib level, which lines up with previous market structure (i.e resistance). If this level will hold as support, then it could be the point where retracement end.
Target is gotten from the weekly chart at the previous weekly support; further conflunce for target is that it lines up with the 38.2% fib level taken on the retracement leg from the monthly chart.
On the daily chart, market is forming an accumulation in the form of a wedge/pennant. If the pair would break out of this structure with a strong impulse on the daily chart, then entries can be sought on the retest of the structure, either on the 4hr, 1hr or lower time frame, depending on preference.
Patience is important. Best of luck!

GOLD: Long PositionGold broke above the wedge pattern. It's looking very bullish right now.
We can wait for correction to it's bottom supporting trendline and then go long.
The only question is, how far will it (potentially) go up?
---


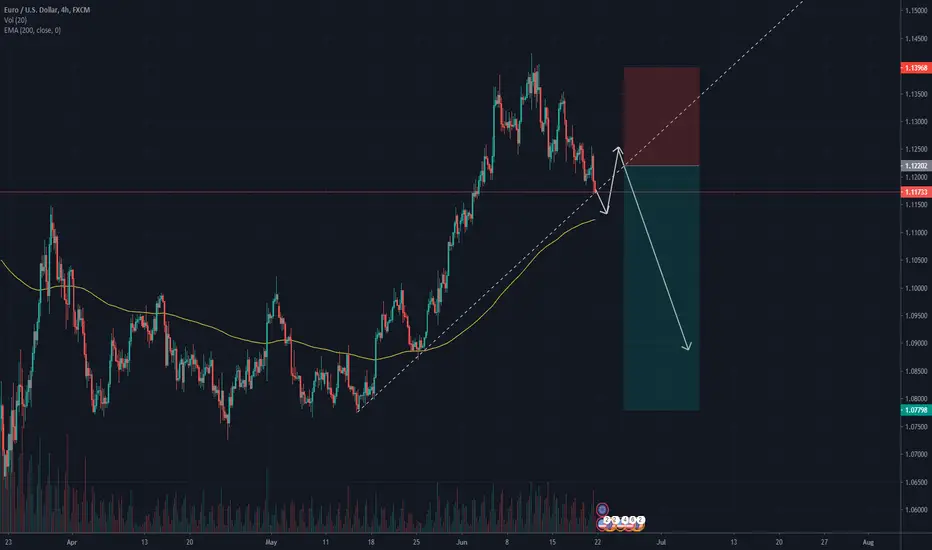
EURUSD possible tradeWhen we look at the chart we can see that it is touching the wedge. It will be interesting to see if this wedge holds but I think that it will not hold. I personally think that the wedge will first do a fake-out, than there will happen retest of the wedge. When it than does the breakout of the chart we will see that it will dropen even more. We do have to also keep an eye out for the DXY because there is a correlation between those 2.
We do have to wait until the market opens to see what will happen but I think that a drop is possible.
If you like what the idea please leave a like and a comment.
Important: This is just an idea that I have. I am not telling you to buy/sell anything. What you do with the information that I give you is totally up to you.
Possible trade for AUDUSDWhen we look at the chart we can see that the wedge has been broken for the second time. We can see that the first breakout of the wedge was a fake-out so the chance is very good that this is the real breakout of the wedge. We are a little late because it already went down. I had a setup for this one earlier that was closed in profit and reversed signal that was in profit also. After that I went back to this setup so I am already in profit. you can still enter and ride the down wave. We do have to look and see what it does when it is close to the longer time wedge that there is. It will possibly struggle a bit there but if it breaks out of that wedge also than it could drop even more.
If you like what the idea please leave a like and a comment.
Important: This is just an idea that I have. I am not telling you to buy/sell anything. What you do with the information that I give you is totally up to you.

MTHBTC | Breakout Trade
MTHBTC is currently trying to break the resistance shown in the chart.
If broken buy the retest of the flipped support for a good entry.
Take profits are at 33%, 77% and 140% respectively.
Never buy into the resistance! Always wait for it to flip to support and buy the retest.
The Aroon Indicator shows a bullish continuation ahead.
Thank you!

eurusd longEURUSDhf is MOVING IN DESCENDING WEDGE ON 4H TIME FRAME i AM EXPECTIONG BULLS TO TAKE CONTROL AROUND 1.11 I WILL PLACE A BUY ORDER ON THE BREAKOUT

AUDUSD Possible SellWhen we look at the chart we can see that the wedge is tested at the moment. What we would like to see is that it breaks out of the wedge and than do a quick retest of the wedge. When this happens we will short this pair. What is also very important to take away from this chart when we look at it is that the 0.382 level of the fib has been respected in the past. What I would do is make sure that when I take this trade that I secure some profits at that level.
Please let me know in the comments what you think of this setup.
