NVDA - BullishForecast a break-out up as the price increased by 3.3% in the after hours.
- The price area in a falling wedge, almost a descending channel.
- The MACD indicator in the Weekly frame shows an uptrend after a rare day of oversold (04.04.2025).
The price today (04.30.2025): $108.92.
Price target: $135.00.
Stop loss: $95.00.
IMO, amateur trader.
Wedgedown

USO Oil ShortUSO on the 60 minute chart is currently in a broadening wedge and reflecting down off a
reversal at the upper resistance trend line. The MACD lines have crossed over the histogram
and are trending down showing moving average convergence. Price is between the mean and
first upper band lines and moving down toward the former. Current factors at play include
an OPEC+ meeting, Russia working around sanctions, increased demand of the summer driving
season, federal rate action projections as well as those in Europe and the ongoing conflicts in
the Middle East. I will short USO here targeting 74 at the bottom of the wedge pattern.

WAVESUSDT is testing the supply zone inside a rising wedgeThe price had a nice breakout from the descending channel on the daily timeframe.
After the breakout the market had another breakout from the static daily resistance with volume on 1.8$ area.
on 4h timeframe the price is testing the supply zone, the 2.5$ area is a key level for WAVES, and now the market is creating a rising wedge.
A rising wedge is a bearish chart pattern consisting of two converging trend lines, with the first line connecting the recent lower highs and higher highs, and a second trend line connecting the recent lows. The resulting shape looks like a triangle that is angled upward. The opposite of a rising wedge pattern is a falling wedge.
What's next?
If the price is going to lose the local support and retest it as new resistance we could see a retracement until the previous daily support on 2$ area

SLPUSDTHi again
There is a possibility that the price can raise itself up to the yellow area, $0.00414!
1) We must not forget that the price range of $0.00358 in the daily time frame has been engulfed!
2) On the other hand, RSI has a positive divergence in the daily time frame!
3) Currently, in the one-hour time frame, the price inside a pattern is a triangle!
Do you think the downward trend line will break upwards!!?!!
I believe that according to the drawn scenario, we will have a downward trend up to the range of $0.00341, and if the price does not fall below the yellow range ($0.00319), there is a possibility of completing a wedge at the end of the descending channel.

GRTUSDT Ready for the breakout?The price is testing the demand zone on 0.26$ below the monthly support on 0.29$.
On the daily timeframe the price is creating a descending channel, and now the price is creating a falling wedge inside it.
How to approach it?
We need to wait the clear breakout from the supply zone at 0.35, where the market has the dynamic and static resistance.
IF the price is going to have a breakout According to Plancton's strategy , we can set a nice order
–––––
Keep in mind.
🟣 Purple structure -> Monthly structure.
🔴 Red structure -> Weekly structure.
🔵 Blue structure -> Daily structure.
🟡 Yellow structure -> 4h structure.
–––––
Follow the Shrimp 🦐

BTCUSD Rising Wedge Pattern Formation 1hr Timeframe.BTC Appears to have fully formed a rising wedge on the current downtrend in the 1hr timeframe, and from knowledge of chart patterns ad price action, it is obvious that a rising wedge on a downtrend is a trend continuation pattern.
This downtrend would be met with a previous zone of support at the 42,400 regions. This could lead to a bounce to the top side, following a trend to the topside before meeting resistance at a previous support level at 44,391. If this resistance fails to hold, we could witness higher highs.

BTCUSDT is creating a rising wedge?Bitcoin had a bounce from our weekly support after a dump due to war, the price created a V shape.
On the 4h Timeframe, the price is testing a key level on 39600 on the daily resistance on 0.5 Fibonacci level. If you look on the left you can see an accumulation before the previous bearish impulse, it means that this area is so strong to break.
the previous candle created a false breakout, no bullish momentum followed the candle, and the Volume is decreasing. If we exclude the nervous candles about the war, we can identify a rising wedge. A rising wedge with two up-sloping trend lines. The volume trend usually slopes downward.
How to approach?
We are monitoring the price, a clear breakout of 38300 with retest should be a clear sign for a new bearish impulse, 37k is the first 4h support.
The setup is invalidated if the price is going to have a breakout and retest of 42k
––––
Keep in mind.
🟣 Purple structure -> Monthly structure.
🔴 Red structure -> Weekly structure.
🔵 Blue structure -> Daily structure.
🟡 Yellow structure -> 4h structure.

HUYA: Double bottom failed, now falling wedgeDouble bottom failed, but it might still bounce up from the wedge down. Book value is getting really cheap on this one.

ICPUSDT is inside a falling wedge 🦐ICPUSDT is inside a falling wedge and now the price is between two 4h structures. IF the price will have a breakout upward and retest the current resistance as new support, According to Plancton's strategy (check our Academy ), we can set a nice order
–––––
Follow the Shrimp 🦐
Keep in mind.
🟣 Purple structure -> Monthly structure.
🔴 Red structure -> Weekly structure.
🔵 Blue structure -> Daily structure.
🟡 Yellow structure -> 4h structure.
⚫️ Black structure -> <4h structure.
Here is the Plancton0618 technical analysis, please comment below if you have any question.
The ENTRY in the market will be taken only if the condition of the Plancton0618 strategy will trigger.

VITEUSDT is creating a falling wedge 🦐VITEUSDT is creating a falling wedge on the daily timeframe and now the price is testing the daily resistance. IF the price will have a breakout from the wedge and retest the current resistance as new support, According to Plancton's strategy (check our Academy), we can set a nice order
–––––
Follow the Shrimp 🦐
Keep in mind.
🟣 Purple structure -> Monthly structure.
🔴 Red structure -> Weekly structure.
🔵 Blue structure -> Daily structure.
🟡 Yellow structure -> 4h structure.
⚫️ Black structure -> <4h structure.
Here is the Plancton0618 technical analysis, please comment below if you have any question.
The ENTRY in the market will be taken only if the condition of the Plancton0618 strategy will trigger.

CRM breaking out of downward wedgeCRM has broken its long term trendline after bouncing off prior longterm support and successfully retested the trendline. All the way up from here

1INCH/USDT Long Looking to long the breakout of this falling wedge. First target at the the TP1, then looking to move SL to take profit.


TQQQ if you don't short you might be in for an atomic Wedgie!!!Since Sept TQQQ looks like it's formed mini Wedge patterns inside possible Wedge ready to Form. The downside is calling to complete this atomic Wedgie Sandwich!!! Don't be tricked by the long play or the atomic wedgie will hurt!! This is only an incredible idea so please do your own due diligence! Comments welcome!

LINKUSDT is inside falling wedge 🦐LINKUSDT is inside a falling wedge after the price broke daily ascending channel. If the price will have a breakout upwards and retest the previous daily resistance as new support, we can look for a long, otherwise, if the price will break the wedge downside, According to Plancton's strategy (check our Academy), we can set a nice order
–––––
Follow the Shrimp 🦐
Keep in mind.
🟣 Purple structure -> Monthly structure.
🔴 Red structure -> Weekly structure.
🔵 Blue structure -> Daily structure.
🟡 Yellow structure -> 4h structure.
⚫️ Black structure -> <4h structure.
Here is the Plancton0618 technical analysis, please comment below if you have any question.
The ENTRY in the market will be taken only if the condition of the Plancton0618 strategy will trigger.

ADAUSDT created a rising wedge 🦐ADAUSDT created a rising wedge, and now the price is testing weekly resistance.
IF the price will lose the daily support and turns it into resistance, According to Plancton's strategy, we can set a nice order
–––––
Follow the Shrimp 🦐
Keep in mind.
🟣 Purple structure -> Monthly structure.
🔴 Red structure -> Weekly structure.
🔵 Blue structure -> Daily structure.
🟡 Yellow structure -> 4h structure.
⚫️ Black structure -> <4h structure.
Here is the Plancton0618 technical analysis, please comment below if you have any question.
The ENTRY in the market will be taken only if the condition of the Plancton0618 strategy will trigger.

QKCBTC is inside a huge descending wedge 🦐QKCBTC is inside a huge descending wedge and the price created a double bottom on daily support.
IF and only IF the price gains bullish momentum and will break recent daily resistance and the wedge, According to Plancton's strategy, we can set a nice order
–––––
Follow the Shrimp 🦐
Keep in mind.
🟣 Purple structure -> Monthly structure.
🔴 Red structure -> Weekly structure.
🔵 Blue structure -> Daily structure.
🟡 Yellow structure -> 4h structure.
⚫️ Black structure -> >4h structure.
Here is the Plancton0618 technical analysis, please comment below if you have any question.
The ENTRY in the market will be taken only if the condition of the Plancton0618 strategy will trigger.

Rising Wedge In FlexacoinI've found a clear rising wedge in FXCBTC which is a very bad sign and id guarantee will fall a decent amount


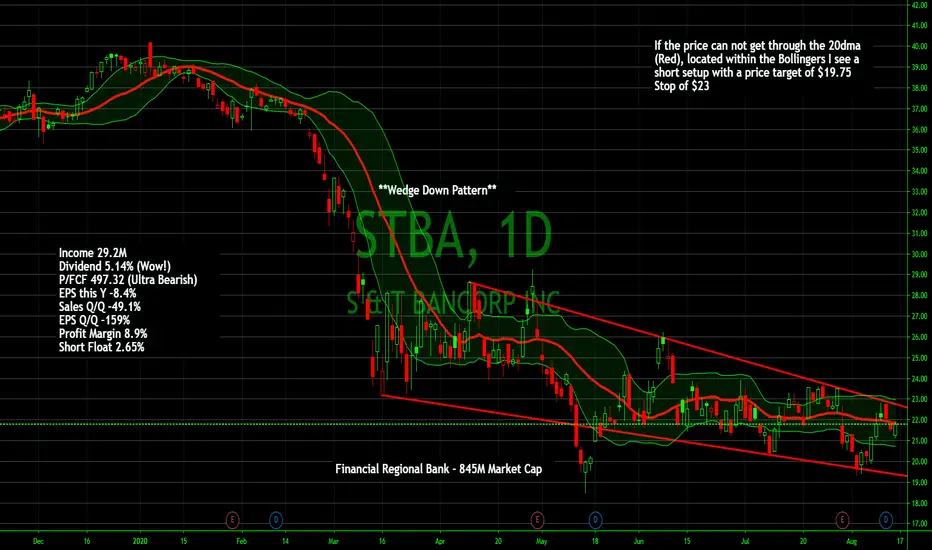
Short opportunity located within this Wedge Down Pattern on S&TIncome 29.2M
Dividend 5.14% (Wow!)
P/FCF 497.32 (Ultra Bearish)
EPS this Y -8.4%
Sales Q/Q -49.1%
EPS Q/Q -159%
Profit Margin 8.9%
Short Float 2.65%
BTCUSDT creates wedge inside huge triangle 🦐BTCUSDT creates wedge inside huge triangle, be careful.
I'm neutral at the moment
–––––
Follow the Shrimp 🦐
Here is the Plancton0618 technical analysis, please comment below if you have any question.
The ENTRY in the market will be taken only if the condition of Plancton0618 strategy will trigger.

The Descending Broadening WedgeA descending broadening wedge is bullish chart pattern (said to be a reversal pattern). It is formed by two diverging bullish lines.
A descending broadening wedge is confirmed/valid if it has good oscillation between the two upward lines . The upper line is the resistance line; the lower line is the support line.
Each of these lines must have been touched at least twice to validate the pattern.
NB: a line is said to be "valid" if the price line touches the support or resistance at least 3 times.
This implies that the descending broadening wedge pattern is considered valid if the price touches the support line at least 3 times and the resistance line twice (or the support line at least twice and the resistance line 3 times).
A descending broadening wedge does not mark the exhaustion of the selling current, but the buyers’ ambition to take control. The divergence of the two lines in the same direction (increase in price magnitude) informs us that the price continues to fall with movements that are increasingly low in magnitude. The sellers manage to make the price rebound on the resistance line but lose control after the formation of a new lowest point. The highest point reached during the first correction on the descending broadening wedge’s resistance line forms the resistance. A second wave of decline then occurs of more magnitude, signalling the sellers' loss of control after a new lowest point. A third wave forms afterwards but the sellers lose control again after the formation of new lowest points.
During the formation of a descending broadening wedge , volumes do not behave in any particular way but they increase strongly when the support line breaks. source:Centralcharts
In 80% of cases, the exit is bullish.
In 75% of cases, a descending broadening wedge is a reversal pattern.
In 60% of cases, a descending broadening wedge’s price objective is achieved when the resistance line is broken.
In 21% of cases, the price makes a pullback in support on the descending broadening wedge’s resistance line.
This type of pattern appears during the correction in a bullish movement, it is a bullish continuation pattern. Resumption of the bullish movement after correction.
The break in the resistance line definitively validates the pattern.
The price objective is given by plotting the wedge’s maximum height onto the breaking point
NB: pullbacks are harmful to the pattern’s performance.
Statistics of the descending broadening wedge after a bullish movement
- In 79% of cases, the exit is bullish.
- In 23% of cases, a descending broadening wedge occurs in a consolidation movement.
- In 81% of cases, the pattern's price objective is achieved when the resistance line is broken.
- In 40% of cases, the price makes a pullback in support on the descending broadening wedge’s resistance line.
