ADAUSDT → Bear market. Support breakdownBINANCE:ADAUSDT.P is in the distribution phase after exiting consolidation. The coin continues to update local lows within a downtrend.
Technically, the cryptocurrency market is in stagnation/correction, as there is no bullish driver yet. Bitcoin is currently consolidating but continues to shoot local downward impulses, which generally has a negative impact on coins.
ADA is entering a distribution phase of accumulation formed in the range of 0.62 - 0.71. If the bears keep the price below 0.62-0.6, ADA may well test the intermediate bottom of 0.5364-0.51
Resistance levels: 0.61, 0.62
Support levels: 0.5993, 0.5364
Focus on 0.61 and the local level of 0.5993. Price consolidation below this zone could confirm the bearish nature of the market, which could lead to another decline.
Best regards, R. Linda!
Wedge

SILVER (XAGUSD): Waiting For BreakoutIt appears that ⚠️SILVER is gearing up for a bullish trend.
Analyzing the 4H time frame, I spotted a falling wedge pattern and a confirmed breakout above its upper boundary.
The final hurdle for buyers is the 36.11 - 36.17 neckline of a cup and handle pattern.
If the bulls manage to break and close above this level, it will serve as a significant bullish signal, likely leading to a continuation towards at least 37.00.

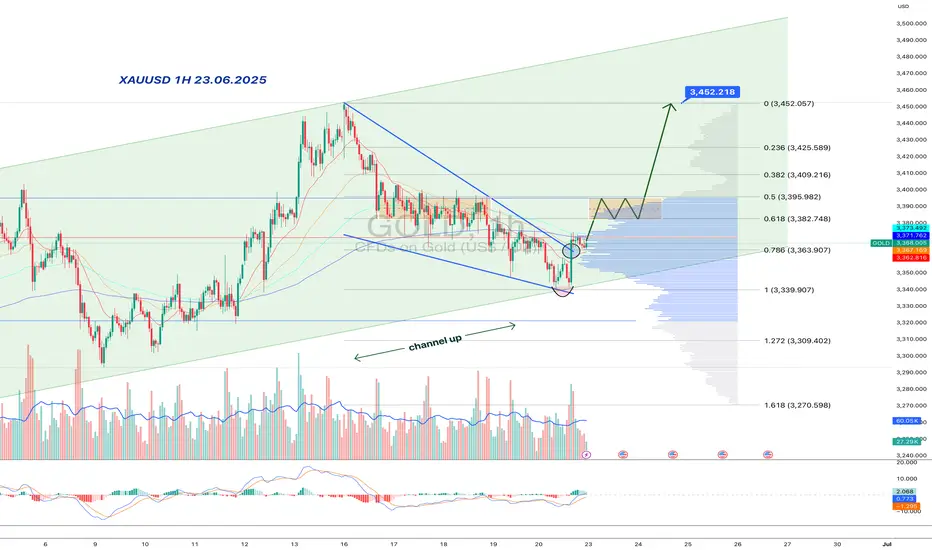
Gold:bullish wedge inside a rising channel-double trap for bearsInside the major upward channel, gold formed a falling wedge — and, of course, faked a breakdown. But the move reversed quickly: price reclaimed the wedge, surged on volume, and held above the key 3363–3368 area. This isn't just a bounce — it's a structural reclaim in line with the broader trend.
Price is now in the upper part of the rising channel and has broken a local downtrend line, reinforcing the bullish signal. Consolidation around 3380–3395 might be the last pause before acceleration. Above that lies a volume gap — no resistance until 3452.
MACD is flipping bullish, RSI turning upward, and volume confirms smart money presence. Classic: trap below, breakout above. As long as 3363 holds — longs remain in control.
USDCAD - Bullish Falling WedgeHello Traders !
The USDCAD price formed a falling wedge pattern.
Currently, The resistance line is broken!
So, I expect a bullish move🚀
______________
TARGET: 1.37490🎯

Bitcoin Holds $100k as Risk Assets Shrug Off Mideast TensionsWeakness in risk assets has been relatively contained so far on Monday in Asia, despite the escalation in geopolitical tensions in the Middle East over the weekend—including in bitcoin.
Yes, it’s down, but not by any margin that sets this open apart from the usual. And having bounced after a brief dip below the psychologically important $100,000 level—which also doubles as wedge support—it’s generated a potential long setup if risk appetite improves.
Longs could be considered above $100k with a stop beneath today’s low to protect against a reversal. Targets include $102,500, $106,500 or even $109,000, depending on your preferred risk-reward.
While momentum signals are neutral to mildly bearish, the price action so far has been constructive for the setup.
Good luck!
DS

$ROOT IS IN A LONG TERM WEDGE WHICH SHOULD BREAK OUT SOONNASDAQ:ROOT that is in that bullish wedge is constricting and consolidating, it's like a rocket ship getting ready to launch NASDAQ:ROOT to $200 and higher like $230 or so.

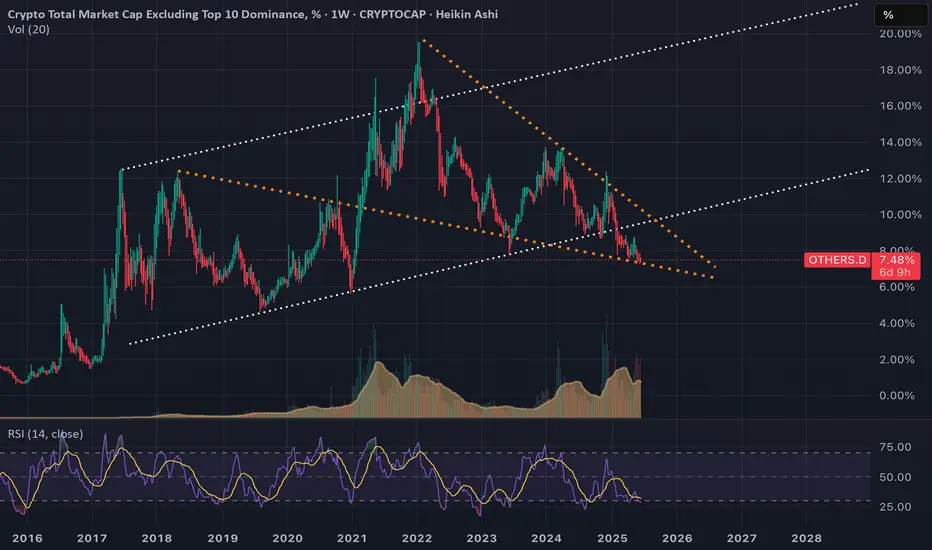
Fallingwedge for the Others.D(?)If you look at the orange dotted lines you can see there is a falling wedge formed for the others.d. If this pattern will be the reality this will mean it's a bullish sign for the alts.
GOLD (XAUUSD): Bullish Move After Opening?!
I think that there is a high chance that Gold will have a bullish opening.
The market closed, breaking a resistance line of a bullish flag pattern
on an hourly time frame.
Fundamentals strongly support this bullish outlook.
Resistance 1: 3392
Resistance 2: 3420
❤️Please, support my work with like, thank you!❤️
I am part of Trade Nation's Influencer program and receive a monthly fee for using their TradingView charts in my analysis.

Bitcoin may rebound from support line of wedge and start to growHello traders, I want share with you my opinion about Bitcoin. Initially, the price was trading inside a well-defined range, moving sideways with repeated rejections from both support and resistance. After several attempts to stay above the support zone, BTC finally broke down and sharply declined below the 104000 level, entering the buyer zone. However, the decline was short-lived. Price quickly rebounded from the lower boundary and formed a strong bullish candle, suggesting that buyers were still active. After this recovery, BTC began forming a wedge pattern, with a gradually narrowing structure between the resistance line and the ascending support line. This kind of price action typically signals a buildup of pressure and potential breakout. Currently, BTC is once again testing the support line of the wedge and hovering near the buyer zone, where it previously reversed. This level has proven significant and is now being retested. Given the current structure, the wedge formation, and price behavior near the support, I expect BTC to rebound from this zone and start climbing back toward the upper resistance area. My current TP 1 is set at 106800 points, which aligns with the mid-level of the previous impulse zone and the inner resistance of the wedge. Please share this idea with your friends and click Boost 🚀
Disclaimer: As part of ThinkMarkets’ Influencer Program, I am sponsored to share and publish their charts in my analysis.

GOLD → Consolidation within a falling wedgeFX:XAUUSD is consolidating. A major player is gathering a trading position inside a wedge ahead of distribution. But the main question is: in which direction?
Gold lost ground again on Friday after mixed holiday trading on Thursday. Traders are waiting for new signals from the Fed and monitoring the situation in the Middle East. Interestingly, gold fell as the conflict escalated further (which is not logical overall). The dollar is in a global bearish trend, and traders are waiting for a decision from Powell (who is under pressure from Trump to cut rates).
Technically, if we look at the wedge, we can see how difficult it is for the market to move. The price is stuck inside the consolidation. The intraday movement is very short, with long tails and a very weak reaction to both false breakouts and level break. Large players are building up positions inside the current channel. This may only hint at the possibility of future implementation (distribution).
Resistance levels: 3360, 3396, 3420
Support levels: 3338, 3320, 3302
On D1 - H4, gold is in a countertrend (bullish trend) correction and is testing the trend support + 0.7 Fibo zone. Below, there are fairly strong areas of interest — 3320 and 3302 — which gold may test before rising. However, within the wedge, there is a fairly high probability of a breakout of resistance and the 3360 level, followed by a rally to the liquidity zone at 3396
Best regards, R. Linda!

SMCI – Wedge Breakout Triggering Around 46 ZoneNASDAQ:SMCI – Wedge Breakout Watch with Intraday Setup Potential
Super Micro Computer ( NASDAQ:SMCI ) is working on a wedge breakout, and it's pressing right into the key $46 zone — the trigger area for a clean move higher.
🔹 Wedge Structure Clearing
Price has been compressing into a wedge, and it's now testing the upper trendline.
The $46 level is the key breakout point — if it clears and holds, this could unleash serious momentum.
🔹 Intraday Setup Developing
If NASDAQ:SMCI can hold this level intraday and consolidate, I’m watching for an entry signal right at or slightly above $46.
Volume confirmation will be key here — watching the tape closely.
🔹 My Trade Plan:
1️⃣ Entry: Watching for clean hold + setup at $46 zone.
2️⃣ Stop: Below yesterday’s low — keeps the trade tight and risk defined.
3️⃣ Add: If it breaks $46 with volume, I’ll build into the position.
Why I Like This Setup:
Breakout from compression = potential expansion
Clear risk level, clean structure — everything I want in a breakout trade
If it holds this level today, this could turn into a trend day.

ORDI/USDT – Bullish Falling Wedge Formation!!Hey Traders — if you're into high-conviction setups with real momentum, this one’s for you.
ORDI is forming a bullish falling wedge pattern and is currently consolidating near crucial support. The price is showing initial signs of breakout potential.
Here's the trade plan:
Entry: $7.20–$7.70
Targets: $9.20 / $10.50 / $11.90
Stop Loss: $6.50 (Strict)
Excellent risk-to-reward opportunity here. Keep your stops tight and manage your risk wisely.

GOLD (XAUUSD): Technical Analysis & Important Pattern to Watch
For some known reason, Gold remains bearish this entire week.
The market is currently correcting within a falling channel - a bullish flag on a 4H time frame.
Ahead, I see a bunch of strong intraday supports.
From one of these structures, a bullish rally may resume.
A trigger that you should look for is a bullish breakout of
a resistance line of the flag and a 4H candle close above that.
A bullish continuation will be expected then.
❤️Please, support my work with like, thank you!❤️
I am part of Trade Nation's Influencer program and receive a monthly fee for using their TradingView charts in my analysis.

BIG PUMP ON GRASS COIN THAT NOONE TALKS ABOUTGRASS is setting up for a major reversal from this falling wedge structure. After a prolonged downtrend, price has now reached the apex of a well-defined descending wedge, supported by a key ascending trendline. This area is shaping up as a high-probability buy zone.
On the chart, we can see price respecting both wedge boundaries and now reacting to the lower support line. This is a classic setup where breakout potential increases significantly. The compression of price action inside the wedge suggests a strong move is imminent.
Looking at Market Cipher B, momentum is showing a clear bullish divergence. Multiple green dots have printed on the oscillator, and money flow, while still negative, is beginning to curve upward. These are early signs that sellers are losing control and buyers are stepping in with strength.
Volume has also dried up on this last leg down, which is typical in wedge structures before a breakout. Low volume near support and divergence on a trusted indicator often marks the beginning of a trend reversal.
From a risk-reward perspective, this setup offers a strong opportunity. A break above the descending resistance could propel price toward the previous key resistance levels around the $3.40 zone. Always place your take profit just below major levels to ensure execution.
Leave your thoughts in the comments. Are you long here or waiting for confirmation? This is not a trade setup, no stop-loss or take-profit is shared publicly. Trade with discipline and confidence.

AUDCHF - Wait For it!Hello TradingView Family / Fellow Traders. This is Richard, also known as theSignalyst.
📈AUDCHF has been overall bearish trading within the flat falling broadening wedge pattern marked in red.
Moreover, the green zone is a supply.
🏹 Thus, the highlighted red circle is a strong area to look for sell setups as it is the intersection of the upper red trendline and supply.
📚 As per my trading style:
As #AUDCHF approaches the red circle zone, I will be looking for bearish reversal setups (like a double top pattern, trendline break , and so on...)
📚 Always follow your trading plan regarding entry, risk management, and trade management.
Good luck!
All Strategies Are Good; If Managed Properly!
~Rich
Disclosure: I am part of Trade Nation's Influencer program and receive a monthly fee for using their TradingView charts in my analysis.

EURNZD: Bearish Move From Resistance 🇪🇺🇳🇿
EURNZD is going to retrace from a strong daily resistance cluster.
As a confirmation signal, I see a bearish breakout of a support line
of a rising wedge pattern on an hourly time frame.
Goal - 1.9144
❤️Please, support my work with like, thank you!❤️
I am part of Trade Nation's Influencer program and receive a monthly fee for using their TradingView charts in my analysis.

GOLD → Continuation of the global trend... To 3350?FX:XAUUSD is testing trend support within a correction. Against a complex fundamental backdrop (the Middle East, Fed comments, Trump's desire to lower rates), the price may continue to rise.
The price of gold rose from a weekly low of $3,363 on Thursday thanks to increased demand for safe-haven assets following reports of possible US strikes on Iran. Markets are ignoring the Fed's hawkish decision to maintain its tight policy and rate forecasts. Traders are waiting for new signals from the Middle East, given the risk of increased volatility due to low liquidity in connection with the US holiday.
Technically, a bullish wedge pattern is forming as part of the correction. The breakdown of the pattern's support did not lead to a decline, but a return of prices and a breakout of resistance could trigger growth after liquidity returns.
Resistance levels: 3373, 3403, 3420
Support levels: 3349, 3320
Before growth, a retest of the trend support or the 3350 zone is possible. However, if the price goes above 3375 and the bulls hold their ground above this level, then we can expect growth to continue within the trend.
Best regards, R. Linda!

Gold Hits PRZ with RD-! Time for Bears to Take Over?Gold ( OANDA:XAUUSD ) attacked the Resistance zone ($3,445-$3,406) once again, forming an Ending Diagonal at the top of the structure.
Although price reached the Potential Reversal Zone (PRZ) , the presence of Regular Divergence (RD-) between the last two peaks could indicate the weakening of bullish momentum .
In terms of Elliott Wave theory , we can clearly count a completed 5-wave structure , with an Ending Diagonal pattern . This supports the idea of a major correction starting soon .
I expect Gold to attack the lower lines of Ending Diagonal , and if it breaks, it could drop to at least $3,333 . The Second Target could be the Support zone ($3,451-$3,120) .
Do you think Gold will make a new All-Time High(ATH) again in this rally?!
Note: Stop Loss (SL) = $3,463
Gold Analyze (XAUUSD), 2-hour time frame.
Be sure to follow the updated ideas.
Do not forget to put a Stop loss for your positions (For every position you want to open).
Please follow your strategy; this is just my idea, and I will gladly see your ideas in this post.
Please do not forget the ✅ ' like ' ✅ button 🙏😊 & Share it with your friends; thanks, and Trade safe.

#BSVUSDT #1D (ByBit) Falling wedge breakoutBitcoin Satoshi Vision is pulling back to 100EMA daily support where it seems likely to bounce and resume bullish, mid-term.
⚡️⚡️ #BSV/USDT ⚡️⚡️
Exchanges: ByBit USDT
Signal Type: Regular (Long)
Leverage: Isolated (2.0X)
Amount: 4.5%
Entry Targets:
1) 38.05
Take-Profit Targets:
1) 63.54
Stop Targets:
1) 29.54
Published By: @Zblaba
AMEX:BSV BYBIT:BSVUSDT.P #BitcoinSatoshiVision #PoW
Risk/Reward= 1:3.0
Expected Profit= +134.0%
Possible Loss= -44.7%
Estimated Gain-time= 2 months

$ENS / USDT Daily Time frame, MAJOR PUMP?Chart Overview
- Pattern Identified: Falling Wedge Pattern
- A bullish reversal pattern, often appearing after a downtrend.
- Three major touchpoints on the lower trendline indicate strong support and pattern validity.
Demand Zone (Support Area)
- Marked near the current price level ($2.0309 - $2.6722)
- Price is testing this zone for the third time.
Supply Zone (Resistance Area)
- Around ($6.6529 – $9.2734)
- Multiple swing highs are plotted within or near this region, indicating strong historical resistance.
Volume Profile (Right side of chart)
- High volume node between $2.50 – $4.00 suggests price acceptance and a potential area for consolidation or resistance after breakout.
- Low volume area between $4.50 – $6.50 implies less resistance, so price might move quickly through it.
FVG (Fair Value Gaps)
- Several FVGs (imbalance zones) are highlighted.
- $3.8 – $4.05
- $5.8236 – $6.1663
- These zones often act as magnets for price, offering potential targets after breakout.
📏 Fibonacci Levels
- Pullback levels (0.28, 0.5, 0.618, 0.786) are marked.
- Price may retrace toward these areas as part of the bullish structure.
✅ Bullish Scenario
- Breakout from the falling wedge pattern.
- Price pushes into first FVG (~$3.8), then toward $5.8236 – $6.1663, eventually challenging the supply zone ($6.6529 – $9.2734)
⚠️ Risks
- If price breaks below the demand zone, it invalidates the wedge and opens room for further downside.
- Falling wedge breakouts require confirmation (e.g., daily close above wedge resistance).
📊 Summary
- Bias: Bullish if support holds and wedge breakout occurs.
- Trigger: Break and close above wedge resistance line.
- Targets: $3.8 → $5.8 → $6.1 → $9.5
- Invalidation: Daily close below the demand zone ($2.00 - $1.90)
Please note this is not financial Advice. This is just an analysis!

WIFUSDT Long Setup – Falling Wedge Breakout Incoming?Hey Traders — if you're into high-conviction setups with real momentum, this one’s for you.
WIF has been consolidating inside a falling wedge structure and is now showing signs of strength from the major horizontal support zone around $0.77. The structure is tightening, and the recent bounce from support could be the early signal of a breakout.
Here’s the trade idea:
Entry Zone: $0.77 – $0.81
Breakout Confirmation: 4H close above the wedge trendline (~$0.87)
Targets:
Target 1: $0.95
Target 2: $1.10
Target 3: $1.35
Invalidation / SL: Below $0.74
Risk-Reward: High (3R+ depending on entry)
Strategy:
Wait for a confirmed breakout with volume. Early entries around current support with tight SLs offer favorable setups if you’re comfortable with added risk.
Keep an eye on Bitcoin’s volatility and global macros, as they may influence alt momentum.

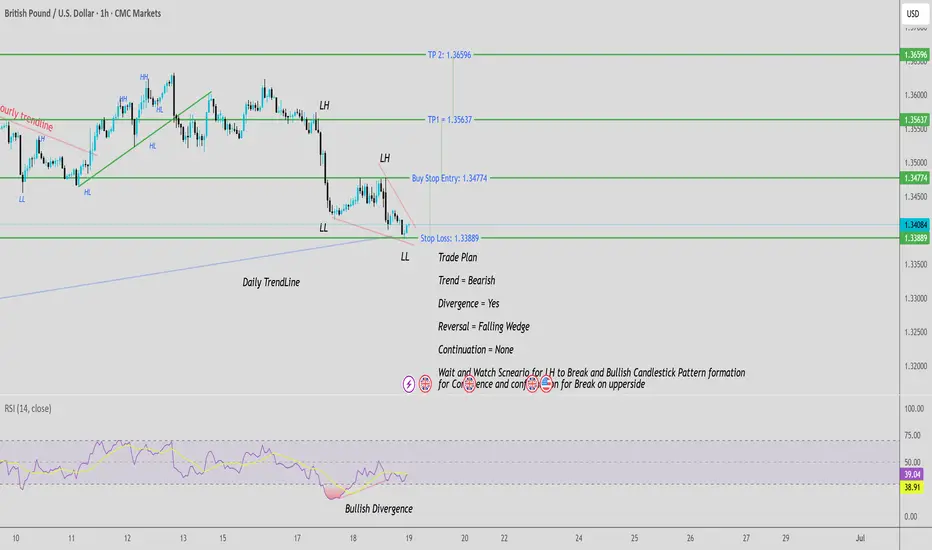
GBPUSD is forming a Potential Bullish Reversal pattern
Price formed a Potential Falling Wedge pattern with a waiting for break of LH as current Temporary Resistance.
• ✅ Entry is triggered only after a confirmation candle breaks above the LH.
• Buy Stop is placed to catch the momentum move.
• Stop Loss is at the recent lower Low (safe and logical placement).
• 🎯 Take Profit levels are based on measured move projections.
Trade Plan:
• Buy Stop = 1.34774
• Stop Loss = 1.33889
• Take Profit 1: 1.35637
• Take Profit 2: 1.36596
• Lot size : 1:2 Risk Reward Ratio
“Waiting for Lower High to break with Bullish confirmation candle” – this ensures you enter only on strong momentum.
GBPUSD is forming a Potential Bullish Reversal pattern with clear structure. A break of the neckline confirms the setup
Key Highlights:
• ✅ Pattern: Falling Wedge
• ⚠️ Confirmation: Break + Bullish candle
• 🔄 Risk Management: Tight SL, 2 TP levels
• 🧩 Confluence: Trendline Bounce + structure shift + RSI Divergence
Silver Under Pressure with Dollar on the MoveSitting in a rising wedge and with momentum indicators rolling over, the ducks look to be lining up for a potential downside break for silver. Throw in signs the U.S. dollar may have bottomed—an adversary to commodity prices—and the unwind could be sizeable, especially if risk appetite were to evaporate.
If silver were to break beneath wedge support and hold there, it would allow for shorts to be established with a tight stop above the level for protection. $35.50—where the price bounced strongly from on June 12—screens as an initial target. If broken, it would bring uptrend support established in early April, along with the October 2024 highs at $34.87, into play.
Bullish momentum that helped power silver higher is also showing signs of waning—we’ve seen bearish divergence between RSI (14) and price, while MACD is also rolling over towards the signal line. The momentum picture isn’t outright bearish but just looks heavy.
Another important factor to consider beyond technicals is that silver and other commodity prices often struggle in an environment where the U.S. dollar is strengthening. That point is reinforced by the inverse correlation between silver and DXY over the past month, sitting with a score of -0.66—not strong by any stretch, but not something you can ignore either.
Good luck!
DS
