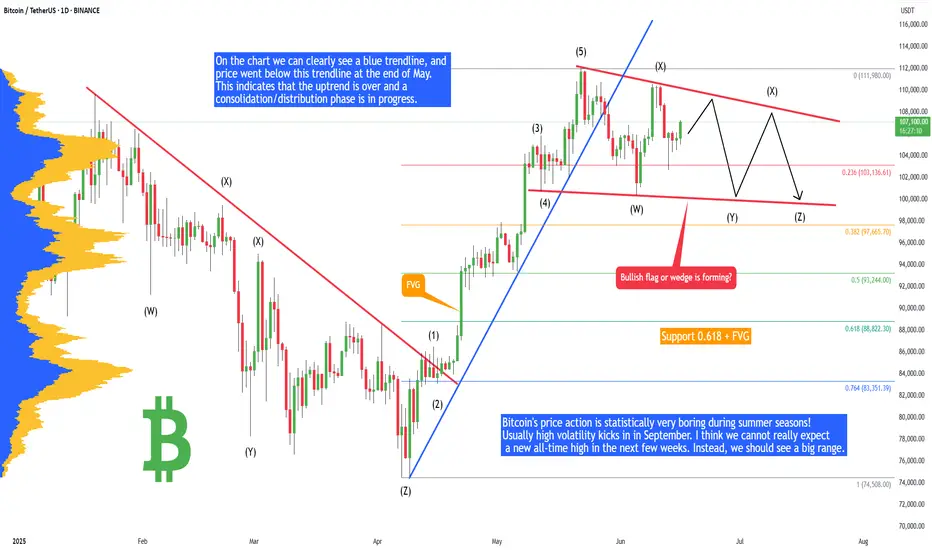
Bitcoin - Plan for summer 2025 (no new ATH, big range!)Bitcoin's price action is statistically very boring during summer seasons! Usually high volatility kicks in in September. I think we cannot really expect a new all-time high in the next few weeks. Instead, we should see a big range. Why? Let's take a look at technical analysis.
On the chart we can clearly see a blue trendline, and price went below this trendline at the end of May. This indicates that the uptrend is over and a consolidation/distribution phase is in progress. This phase is usually represented as a bull flag, triangle, rectangle, or wedge. When we look at the current price action, it looks like a bullish flag consolidation pattern. In this case we will probably see multiple liquidity sweeps below the previous swing lows to kick out early longs.
There are 2 types of traders. The first one they love to trade ranges, and the second they love to trade breakouts and higher volatility environments. Currently I think Bitcoin is creating a range, so do not expect any crazy movements until this range is valid.
Bullish flags are usually bullish patterns, but often they break down and act like bearish patterns. So what would happen if this bullish flag breaks down? That would send the price of Bitcoin to the 0.618 FIB, which is at 88,882 USDT. What is this bullish flag breaks out? That would send the price of Bitcoin to 116,000 to 125,000, but to establish this price we first need to see low of the bull flag, which is not confirmed yet. I will definitely inform you in one of my next analyses, so write a comment with your altcoin + hit the like button, and I will make an analysis for you in response.
At the end of each post, I share my professional trading tips: "If you realize you’ve made a poor trading decision, exit before the stop loss forces you out." Trading is not hard if you have a good coach! This is not a trade setup, as there is no stop-loss or profit target. I share my trades privately. Thank you, and I wish you successful trades!
Wedge
EUR/USD Triangle Pattern – 1H Timeframe
📊 EUR/USD Triangle Pattern – 1H Timeframe
🕐 Date: 17 June 2025
📌 Chart by: GreenfireForex
🔷 Pattern: Contracting Triangle (ABCDE)
🔍 Context: Forming inside Wave (4) – possible breakout before Wave (5)
📈 Upside Potential: Break above triangle → target near 1.16500+
📉 Downside Risk: If fails to break up → revisit demand zone around 1.15000
---
🔮 Possible Scenarios:
✅ Bullish Breakout:
Breaks above wave (e)
Clean rally toward target zone
Ideal for a long setup with tight SL
❌ Bearish Fakeout:
Rejection from triangle resistance
Falls back into demand zone
Look for reversal or retest opportunities
---
🎯 Strategy Tips:
Wait for a breakout candle
Use SL outside triangle zone
Entry based on confirmation – avoid early trades
💬 Let’s discuss live market reaction as price nears triangle edge. Stay ready .

Wedge Pattern – Simple Explanation
📚 Wedge Pattern – Simple Explanation
A wedge pattern is a shape on the chart that looks like a triangle or cone. It tells us that the price is getting ready to break out — either up or down.
---
🔻 Falling Wedge (Bullish)
Looks like price is going down, but slowly.
Lines move closer together.
Usually means the price will go up soon.
It's a bullish signal (good for buying).
---
🔺 Rising Wedge (Bearish)
Price goes up, but losing strength.
Lines get closer together.
Usually means the price will go down soon.
It's a bearish signal (good for selling).
---
💡 Easy Tips:
Wait for breakout (big move out of the wedge).
Use a stop-loss below/above the pattern.
Target = height of the wedge.
---
📌 In Short:
Wedge = Squeeze pattern.
Falling wedge = Buy chance.
Rising wedge = Sell chance.
---
Let me know if you have sny doubt in comments

Google Wave Analysis – 16 June 2025- Google reversed from support level 175.00
- Likely to rise to the resistance level 180.00
Google recently reversed up from the support zone between the support level 175.00 (former Double Top from May) and the 38.2% Fibonacci correction of the sharp upward impulse iii from the start of June.
The upward reversal from this support zone started the active minor impulse wave v of the C-wave from the start of May.
Google can be expected to rise further in the active Rising Wedge chart pattern to the next resistance level 180.00 (which stopped the previous impulse wave (iii) earlier this month).

Bitcoin Consolidates Near Highs — Bullish Wedge Signals StrengthHolding Strong Amid Uncertainty:
Despite rising geopolitical tensions, Bitcoin remains resilient, trading near recent highs. This stability reflects strong institutional confidence and sustained accumulation by long-term holders.
Bullish Technical Setup:
The ongoing consolidation between $100,000 and $110,000 is forming a wedge pattern—a classic bullish continuation structure. This suggests the market is coiling for its next major move.
Key Levels to Watch:
Immediate Resistance: $112,500
Support Zone: Holding above $100,000 keeps the bullish case intact
Measured Move Target: $130,000–$135,000
Outlook:
This tight consolidation signals a healthy pause in a strong uptrend, positioning Bitcoin for a potential breakout and continuation higher. All signs point to the bulls remaining firmly in control.
#Bitcoin #BTC #TechnicalAnalysis #BullishWedge #CryptoMarket #InstitutionalBuying #PriceAction #Geopolitics #SupportAndResistance #BullRun

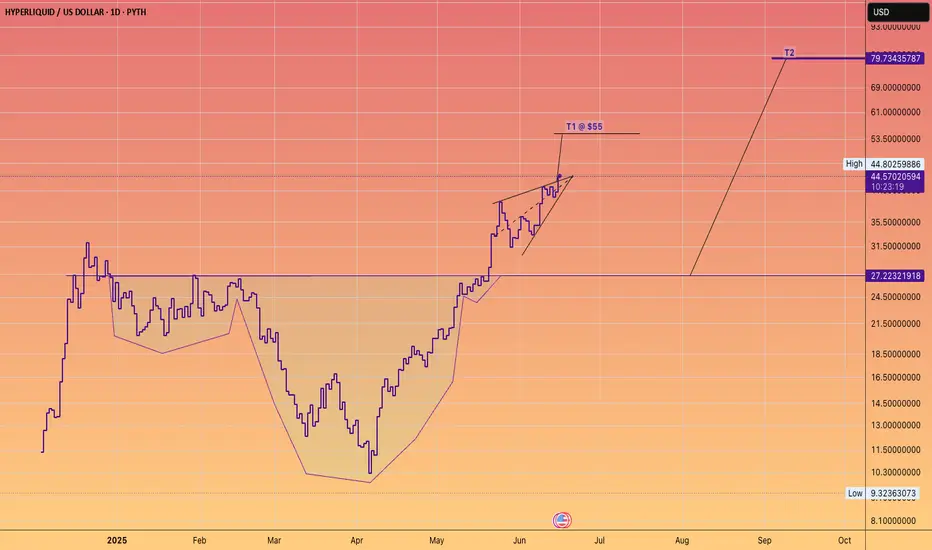
Don't fight the HYPE train!The James Wynn saga was wonderful advertising for the platform.
(Maybe it was staged).
Either way #Hyperliquid goes higher.
USDCHF → Retesting resistance will lead to a declineFX:USDCHF , having failed to reach its global target after breaking through support, is turning back to retest the zone of interest at 0.8157. A fall in the dollar could trigger a decline in prices...
After breaking through support and falling to 0.8055, a correction is forming towards the zone of interest and liquidity at 0.8157. After reaching the local target, the price may return to the global target (liquidity zone) at 0.8042.
The dollar returned to its downward phase at the opening of the session, to which the forex market reacted accordingly. Most likely, bearish pressure may also affect the USDCHF currency pair, which continues to follow the downward trend.
Resistance levels: 0.8157
Support levels: 0.8055, 0.8042
A retest of resistance amid high volatility could form a false breakout (liquidity capture) before the decline continues within the downtrend.
Best regards, R. Linda!

SYRUP consolidates for rallySYRUP - is testing ATH while the crypto market is in correction. We can conclude that this coin is stronger than the whole market and can continue its rally after accumulating the right potential.
Focus on the mirror support level 0.4600 - the round number gives strength to this level. After a false breakdown, the coin is consolidating in the buying zone. A break of the downside resistance will trigger a rally
Scenario: If the consolidation above 0.4600 continues and the coin breaks the downside resistance, a breakout and consolidation above 0.49450 will attract new buyers, which will only strengthen the rally.

PIPPIN/USDT Long Setup Update!!PIPPIN Breakout Alert – 100% Potential on the Table
Hey Traders — if you're into high-conviction setups with real momentum, this one’s for you.
PIPPIN is breaking out from a falling wedge pattern on the 4H timeframe after a long period of consolidation. This structure typically signals a potential reversal with strong upside momentum.
With the recent breakout, we’re looking at a fresh long opportunity:
Entry:
Current levels: 0.0172 and add more up to $0.0155
Stop-Loss:
Below support: 0.0141
Targets:
Target 1: 0.0336
Target 2: 0.0450
Target 3: 0.0550
Target 4: 0.0650
✅ Risk-reward remains highly favorable from this point.
✅ Tight stop-loss to manage risk in case of any invalidation.
✅ Watch for confirmation above immediate resistance for further strength.
Disclaimer: Always manage your position size and risk. Trade safe!

USDJPY – 4H . [[ TRIANGLE PATTERN ]]Technical Breakdown:
Symmetrical triangle pattern clearly formed with clean ABCDE wave structure.
The price has broken out from the upper resistance (trendline), confirming a bullish breakout scenario.
Next key area to watch is the supply zone near 145.800 – 146.200, where price may either:
Face resistance and retrace,
Or break through for continuation.
---
🔍 Key Levels:
Support Base (Retest zone): ~143.000
Breakout Entry Trigger: Above 144.200
Supply Zone Target: 145.800 – 146.200
Invalidation Level (Break Below Triangle): <142.500
---
🧠 Analysis Insight:
This is a classic triangle consolidation breakout, with price respecting both ascending and descending boundaries before thrusting upward.
Look for possible pullback retest entries before continuation to the supply zone.
Volume and momentum confirmation on breakout is key for sustainability.
---
🎯 Strategy Note:
Use low-risk entry setups on breakout retest.
Ideal for scalp to swing trades, with strong risk-reward structure.

GBPUSD – 1 Month Analysis (Long-Term Outlook)Strategy Used:
✔ Smart Money Concept (SMC)
✔ Elliott Wave Theory
✔ Wedge Pattern Breakout
---
🔍 Chart Overview:
The pair has completed a classic falling wedge pattern, hinting at a potential long-term bullish reversal.
Wave 5 completion suggests the start of a new cycle or correction (ABC).
Currently in a buyer-dominated zone, with momentum pushing towards the key supply area (seller zone) marked in blue.
A breakout above this zone could indicate continuation toward major highs, while rejection might trigger Wave C or a deeper corrective structure.
---
💡 Key Levels:
Immediate Support Zones:
1.2550 - 1.2700 (Buyer's Checkpoint)
1.2000 - 1.2200 (Deeper Buyer Interest)
Major Resistance / Supply Zone:
1.5500 - 1.6000
---
🧠 SMC Perspective:
Break of Structure (BoS) confirms bullish intent in multiple zones.
Expecting reaction from premium zone – either for continuation or smart money reversal.
---
🌀 Elliott Wave Outlook (Box Inset):
Current wave structure hints at a completed 5-wave impulsive decline.
Now in early stages of ABC correction.
Targeting Wave C to reach the major supply zone in the long-term.
---
📌 Summary:
A macro bullish opportunity is unfolding after years of consolidation and impulse decline. Keep eyes on higher timeframe confirmations and reactions at key zones. This chart aligns well with institutional footprints and macro price action logic.

DEEPBOOK Spot Buy IdeaDEEP/USDT SPOT - 1D - BYBIT
Current Price: 0.14727 (Close)
24h Range: 0.13600 (Low) → 0.15582 (High)
Change: -5.47% (▼0.00853)
🔥 Extremely Bullish on DEEP!
Falling Wedge Pattern confirmed—breakout incoming!
If you’re not holding yet, consider buying at market price.
🎯 Targets:
First Target: $0.20 (Breakout confirmation)
Second Target: $0.25 (Mid-term resistance)
Final Target: $0.31 (Aggressive upside)
Follow me for more signals like this!

Gold will grow a little more and then make correctionHello traders, I want share with you my opinion about Gold. After forming a downward wedge and several rejections near the support line, the price eventually broke out to the upside, signaling a reversal. This breakout was followed by a strong upward impulse, and Gold quickly shifted into a consolidation phase, creating a wide sideways range structure. Inside this range, we observed multiple rebounds from the lower boundary and a gradual rise toward the resistance level. Recently, the price exited the range upward after testing the buyer zone and breaking above the support area. However, this breakout seems impulsive and may need a correction. Currently, Gold trades slightly above the 3400 level, which aligns with the support area and the previous range border. In my view, the price may make a short upward move, followed by a return to the current support level. That’s why I set my TP at 3400 points, which corresponds to the support area and acts as a potential bounce zone in case of a retracement. Please share this idea with your friends and click Boost 🚀
Disclaimer: As part of ThinkMarkets’ Influencer Program, I am sponsored to share and publish their charts in my analysis.

#BERAUSDT #1D (Bitget Futures) Descending wedge on supportBeraChain printed a bullish hammer that may have marked a double bottom here on daily.
Reversal seems around the corner, revisiting 50MA & 100EMA resistances would make sense.
⚡️⚡️ #BERA/USDT ⚡️⚡️
Exchanges: Bitget Futures
Signal Type: Regular (Long)
Leverage: Isolated (2.0X)
Amount: 4.8%
Entry Zone:
2.798 - 2.558
Take-Profit Targets:
1) 3.345
2) 3.848
3) 4.350
Stop Targets:
1) 2.120
Published By: @Zblaba
CRYPTOCAP:BERA BITGET:BERAUSDT.P #1D #BeraChain berachain.com
Risk/Reward= 1:1.2 | 1:2.1 | 1:3.0
Expected Profit= +49.8% | +87.4% | +124.9%
Possible Loss= -41.7%
Estimated Gaintime= 1-2 months

(iFVG) before continuing its fall.EUR/USD is now ready to move downward. The market has already cleared out all the liquidity above, which suggests that it's now in the mood to drop. Earlier, on the 4-hour timeframe, the market had formed a bullish Fair Value Gap (FVG), but that has now been broken to the downside.
Currently, there are chances that the market might touch the imbalance (iFVG) before continuing its fall. Keep an eye on that level and observe how the market reacts there. It could be an important zone.
Do Your Own Research (DYOR)! This is not financial advice.

ETH $700 SWING SHORT MUST SEENext Prediction
$2600 to $3000
$3009 to $2300
⸻
Since the full Wedge failed to play out fully so now if we go up and inside the wedge has a higher higher giving us a huge swing
Target:
$2,300 is the full measured move if the rising wedge pattern plays out cleanly and fully resolves.

BITCOIN (BTCUSD): Pullback From Support
Bitcoin nicely respected a key horizontal support.
A breakout of a resistance line of a falling wedge pattern
provides a strong bullish confirmation.
I think that the price will go up and reach at least 108.320 level.
❤️Please, support my work with like, thank you!❤️

My idea for the end of this Crypto BullrunSo far, everything is going according to plan, despite the unnecessary panic from retail; Bitcoin is doing fine.

Gold Correction = Bearish Divergence + Wedge + Zigzag CompleteGold ( OANDA:XAUUSD ) attacked the Resistance zone($3,387-$3,357) today after the release of the US CPI indices . Although the figures seemed to be in gold's favor, traders still seem to be determined to continue the price correction.
In terms of Elliott Wave theory , it seems that Gold has managed to complete the Zigzag Correction. We should wait for the next 5 down waves .
Also, we can see the Regular Divergence(RD-) between Consecutive Peaks .
In terms of Classic Technical Analysis , Gold appears to have successfully formed a Rising Wedge Pattern .
I expect Gold to drop to at least $3,296 AFTER breaking the lower line of the Rising Wedge Pattern .
Note: Stop Loss(SL)= $3,380
Gold Analyze ( XAUUSD ), 1-hour time frame.
Be sure to follow the updated ideas.
Do not forget to put a Stop loss for your positions (For every position you want to open).
Please follow your strategy; this is just my idea, and I will gladly see your ideas in this post.
Please do not forget the ✅' like '✅ button 🙏😊 & Share it with your friends; thanks, and Trade safe.

Nasdaq Futures: Tariff Talk, Tech Fatigue Turn TideHaving surged more than 20% from the April lows, we could be nearing a turning point for Nasdaq 100 futures.
Bullish momentum is showing signs of shifting lower, while Wednesday’s inverted hammer candle—on a day when tech stocks were given every excuse to rally thanks to the soft U.S. inflation report and subsequent decline in Treasury yields—warns the rally may be running out of steam.
With Donald Trump talking about setting firm tariff rates for individual nations within the next two weeks, we’re already seeing signs of weakness in futures, bolstering the prospect for a three-candle evening star pattern being completed. Sitting in a rising wedge, directional risks seem to be skewing lower.
If the price breaks and closes beneath wedge support, it would create a setup where shorts could be established with a stop above Wednesday’s high to protect against a resumption of the bullish trend.
21436 is a minor support level that screens as an initial target, although 20800—where the price bounced strongly from on May 23—makes for a more appealing case from a risk-reward perspective.
A push and close above 21969—a minor resistance level established earlier this year—would invalidate the bearish bias.
Good luck!
DS

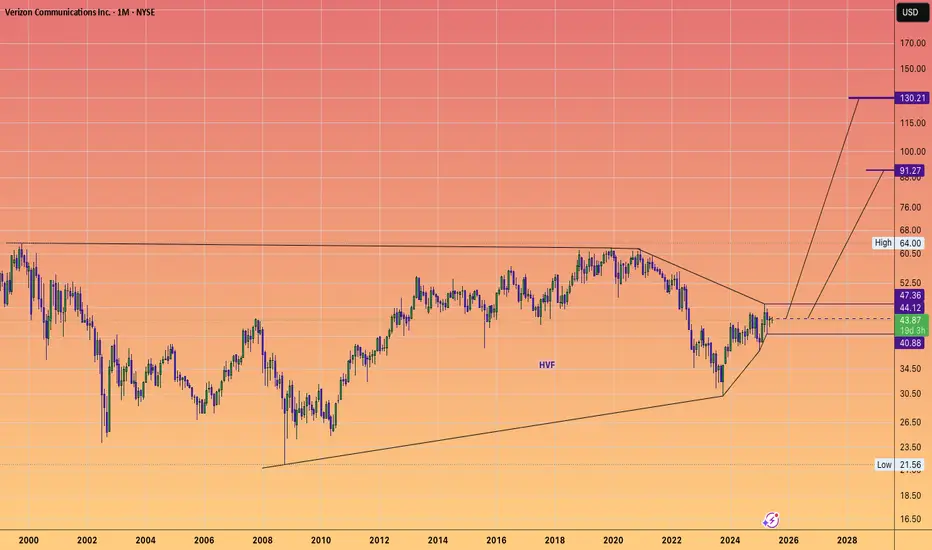
VERIZON will run up to $130It's not me
it's the chart that says it will
#HVF
#HuntVolatiltyFunnel
@FrancisHunt-TheMarketSnipe
@TheMarketSniper
@TheCryptoSniper
FTNT to 150 this yearWith the market pumping I believe the greedy will suffer the next two quarters. Cybersecurity is generally a safe bet when the market spooks. This contraction is my main style of swing trading. I am in multiple wedge setups like this right now and just entered calls on FTNT.
BBWP and stochastic have room to run
Might need a few weeks for this to play out so I went further out
My plan:
9/19 120$ calls

LINK about to explodeI believe link is going to lead a massive Bitcoin leg followed by Eth then altcoins. Link tends to start big pushes for Bitcoin. I have seen this happen every single time Bitcoin finds new all-time-highs. The whales are up to something.
TA Wise:
We have a LOT of room for BBWP expansion.
Stochastic RSI is heating up with room.
We note a contracting wedge, with a rising bottom.
