Bitcoin will rise from support level and exit from wedgeHello traders, I want share with you my opinion about Bitcoin. This chart shows how the price rebounded from the current support level and then turned around and rebounded up. Price broke the 109000 level, coinciding with a support area, and then traded near this level for some time. Later price turned around and started to decline inside a downward channel, where it soon broke the 109000 level, reached the resistance line, and continued to fall next. Bitcoin fell to the support line of the channel, which coincided with the 103000 support level and buyer zone, after which it rebounded up. Then BTC exited from channel and later entered to upward wedge, where it at once made a correction movement from the resistance line to the support line, breaking the 103000 level. But soon, price made an impulse up, breaking the support level one more time. Next, it rose to the current support level, broke it too, and now trades inside the support area. In my mind, BTC can rebound from the support level and rise to the resistance line of the wedge. Then it can break this line, thereby exiting from the wedge and continuing to move up; therefore, I set my TP at 112000 points. Please share this idea with your friends and click Boost 🚀
Wedge

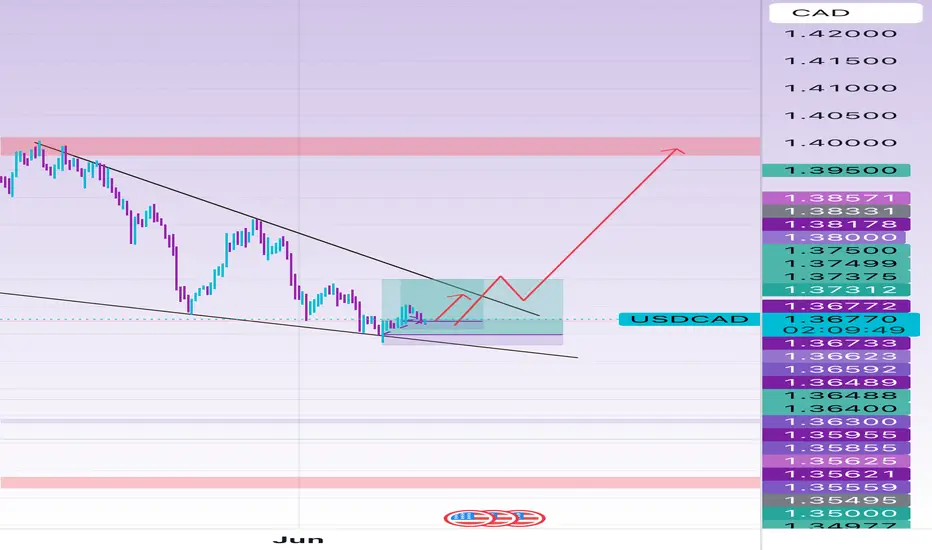
Eurusd !!! Ascending Wedge Pattern Signals a Major Reversal! Time': 30 min
Technical analysis:
Ascending Wedge Pattern 📈: A clear ascending wedge signals a potential bearish reversal. The price has just completed Wave ⑤ at the top trendline, a classic trigger point for sellers.
* Elliott Wave Confirmation 🖐️: The wedge contains a perfect 5-wave Elliott structure, reinforcing our bearish bias as the final impulse wave concludes.
* Live vs. Textbook 👨🏫: Our live chart is mirroring the ideal "textbook" example shown, increasing confidence in the setup's validity.
The Trade Plan 🎯
* Entry ▶️: Short position initiated in the "Risk Zone" after rejection from the wedge resistance.
* Stop Loss ⛔️: Placed tightly above the Wave ⑤ high at ~1.14821.
* Take Profit 💰: Targeting the major support level at ~1.12925.
Conclusion ✨
This setup presents an exceptional risk-to-reward ratio. The combination of a reliable chart pattern and Elliott Wave count gives us a high-conviction bearish outlook for EUR/USD.
Disclaimer ⚠️: This is a technical idea, not financial advice. Always use proper risk management. Trade safe!

FARTCOIN’s - High Probability Breakout or Devastating Trap?Yello Paradisers, are you truly prepared for what #FARTCOIN is signaling right now? Because this setup is dripping with opportunity—but only for those who understand market structure and probability. After a steady grind lower inside a clean falling wedge formation, price just printed a high-probability deviation below the key support/resistance zone before snapping back inside. That kind of fakeout is no joke—it’s often the precursor to a major reversal. But will this deviation mark the beginning of a bullish surge, or is it a calculated trap before another leg down?
💎#FARTCOIN is hovering just above the reclaimed support/resistance area between 0.95 and 1.00. Historically, this level has played a pivotal role. The recent deviation below and swift recovery adds to the probability that this is a classic shakeout—designed to liquidate weak longs and trap aggressive shorts. However, we must be cautious.
💎Hovering above price is the multi-timeframe EMA (represented by the orange line), which is currently serving as dynamic resistance. As long as this EMA remains unbroken, bullish momentum is at risk of stalling. The probability of continuation only rises significantly if this EMA is reclaimed with strong candle closure above it.
💎The next obstacle is the minor resistance zone around 1.04667. A sustained breakout above this level will increase the probability of a move toward 1.20265, and if momentum builds, there’s a strong case for price to reach into the higher time frame major resistance zone between 1.45 and 1.50. However, we’re not there yet—and probability works both ways.
💎Should FARTCOIN fail to hold the reclaimed zone, or if price gets rejected at either the EMA or minor resistance, the bearish scenario comes back into play. In that case, price could collapse back into the wedge, increasing the likelihood of a drop toward the major support range between 0.73 and 0.64. Even worse, a confirmed 12-hour candle close below 0.60 would invalidate the entire bullish wedge setup and open the probability for a deeper correction.
This is the point where the weak hands get shaken out and smart money reloads, Paradisers. If you're aiming for long-term success, wait for high-probability setups and protect your capital. Strive for consistency, not quick profits. Treat the market as a businessman, not as a gambler.
MyCryptoParadise
iFeel the success🌴

ETH will 5X from HERE! Hit the Like to manifest this.I'm serious hit the like to turn this #HVF into a reality.
I have been monitoring this pattern build out for years now.
BUT we are on the verge on triggering this pattern any day now, and triggering a massive Altcoin run which sucks in capital from all parts of the globe.
@TheCryptoSniper

USDJPY: Strong Intraday Bullish Price Action 🇺🇸🇯🇵
On the today's live stream, we discussed a very bullish setup
on USDJPY.
The price retested a recently broken horizontal resistance.
A resistance line of a falling wedge pattern was violated with
a strong bullish movement then.
We see its retest at the moment.
I think that the price will resume growth soon and reach 145.25 level.
❤️Please, support my work with like, thank you!❤️
I am part of Trade Nation's Influencer program and receive a monthly fee for using their TradingView charts in my analysis.

BEARS TAKEOVER IN PSU BANK INDEX ??The PSU Index saw a strong rally after a falling wedge breakout but now faces resistance near 7250, with bearish RSI divergence hinting at weakening momentum. A pullback is likely, and price action at 6838 or 6572 will decide whether the uptrend resumes or a downtrend begins—impacting key PSU bank stocks like SBI, PNB, and BOB.
Key Pointers:
📉 Falling wedge breakout led to a strong bullish rally.
⛔ Resistance near 7250 is restricting upside.
⚠️ RSI bearish divergence suggests weakening momentum despite rising prices.
🔄 Two scenarios ahead:
Pullback + bullish signs → uptrend likely to resume.
Pullback + no bullish signs → possible start of a downtrend.
📊 Key pullback support levels:
6838 (major pullback)
6572 (major pullback)
📉 Impact: Stocks like SBI, PNB, and BOB may see short-term fluctuations in line with PSU Index movements.

SELL GBPUSDGU is playing out the Rising Wedge so we anticipate a decent drop in price action today having in mind the NFP is also brewing,... lets get it

NZDJPY - One More Bullish Leg!Hello TradingView Family / Fellow Traders. This is Richard, also known as theSignalyst.
📈NZDJPY has been overall bullish trading within the rising wedge marked in blue.
Moreover, the green zone is a strong support!
🏹 Thus, the highlighted blue circle is a strong area to look for buy setups as it is the intersection of support and lower blue trendline acting as a non-horizontal support.
📚 As per my trading style:
As #NZDJPY approaches the blue circle zone, I will be looking for bullish reversal setups (like a double bottom pattern, trendline break , and so on...)
📚 Always follow your trading plan regarding entry, risk management, and trade management.
Good luck!
All Strategies Are Good; If Managed Properly!
~Rich
Disclosure: I am part of Trade Nation's Influencer program and receive a monthly fee for using their TradingView charts in my analysis.

AVAAI/USDT: FALLING WEDGE BREAKOUT! 90%+ PROFIT POTENTIAL!!AVAAI Breakout Alert – 90%+ Potential on the Table
Hey Traders — if you're into high-conviction setups with real momentum, this one’s for you.
AVAAI has officially broken out of a falling wedge structure on the 4H timeframe — a classic bullish reversal pattern. After weeks of downtrend, price finally closed above resistance with volume.
📌 Entry: Current Market Price (CMP) and add more up to $0.0487
🎯 Targets: $0.0585 / $0.0670 / $0.0798
🛑 Stop Loss: $0.0412
📈 Leverage: 5x–10x (low to moderate)
We’ve already seen a 90% move last time from this zone — if momentum holds, a repeat isn’t off the table. Breakout confirmed. Now it's all about the follow-through.
What's your take on AVA AI here? Are you riding this breakout or staying cautious?

Buy ideaFalling wedge pattern, in a buy currently but could look to add further positions if the structure is broken where we could expect a further upwards climb. Let me know what you think! Comments and/or suggestions highly appreciated! :)
Stock of the Week ! LMND Price Action June 2025Overview
Name: Lemonade, Inc.
Ticker Symbol: LMND
Exchange: New York Stock Exchange (NYSE)
Founded: 2015
Headquarters: New York City, USA
CEO: Daniel Schreiber (as of 2025)
Sector: Financial Services
About
Lemonade is a technology-driven insurance company that uses artificial intelligence (AI) and behavioral economics to disrupt traditional insurance. It offers a variety of insurance products through a mobile-first, digital platform:
Renters insurance
Homeowners insurance
Pet insurance
Term life insurance
Car insurance
Fundamentals
Overview
Statements
Earnings
Revenue
Key Takeways
Lemonade had a robust quarter with growth accelerating to 27% year-on-year to $151 million in Q1 2025., the 6th quarter of year-over-year (YOY) acceleration, and outperforming. The company posted losses this quarter that was less than expected.
Technicals
Price has crossed above the 50-week EMA (~$30) and is now at $38.98, suggesting strong bullish momentum. The 50-day MA also just crossed the 200 day MA forming a golden cross.
It also recently broke out of a falling wedge pattern formation on the 4hr timeframe.
It has formed and broken out a saucer suggesting a price reversal from 2021 on the weekly chart suggesting bullish momentum.
My Take
NYSE:LMND is showing a clear bullish momentum though it has entered overbought RSI signaling a consolidation or pullback near $42-$45 range. I am looking for a potential upside to
$52 by the end of the month.
Position: LMND 40 Call June 20 2025
Quantitly: 10
Average Cost Basis: 1.26
Last Price: 2.33
Total % Gain/Loss: +85%

ABNB inflection pointABNB comes to finality of the macro wedge. This chart reminds me of the multi year downtrend and contraction on TSLA before the explosive break. My target remains 225, a short-term 38% upside on the monthly chart.

XAG LONG RESULT Silver created a minor ascending wedge pattern after the dump and holding Trendline and order blocks attempting to create new HH and HL's, which is a bullish indication.
Price did move up in the expected direction, just hitting sl with a wick.
Better Luck next time 😉

BTCUSD: Bearish Signal from Mother Candle on Daily ChartMother Candle - A big candle that engulfs the subsequent candles.
The Mother Candle formed on Dec 5th on a Daily Chart still holds good, with a Bear Counter Attack and a Fake Break Down. With the Rising Wedge to get to the Mother Candle, there is a very high probability that this could be a bearish reversal.
If there is a Break Down on the Mother Candle, there are known support levels from GETTEX:92K to $85K. The price could dip down to one of these levels.
Let's see.

Euro will correct a little and then continue to move up nextHello traders, I want share with you my opinion about Euro. Observing this chart, we can see how the price entered to upward channel, where it at once dropped from the resistance line to the support line and then started to grow. In a short time price rose to the 1.1210 level, broke it, and even rose a little more, but soon turned around and declined to the support line of the channel. Then the Euro made an upward impulse, and then broke the 1.1210 level one more time and continued to grow inside the channel. Later price reached the resistance line of the channel and then corrected, after which, in a short time rose to the support area, breaking the 1.1400 level. But soon the price turned around and dropped to the 1.1210 level, thereby exiting from channel. Next, Euro continued to grow inside the wedge, where it rose to the current support level and soon broke it. After this, the price rose to the resistance line of the wedge and then corrected, after which it made an upward impulse. Price exited from the wedge, and now I think that the Euro can make a correction, after the rise, and then continue to grow next. That's why I set my TP at 1.1560 points. Please share this idea with your friends and click Boost 🚀
Disclaimer: As part of ThinkMarkets’ Influencer Program, I am sponsored to share and publish their charts in my analysis.


Bitcoin's Structure Breaks — PRZ May Trigger a BounceBitcoin ( BINANCE:BTCUSDT ) has finally continued its downward trend , as I expected in my previous idea .
Do you think this downward trend will continue or not?
Bitcoin has now managed to break the Support zone($104,180-$103,670) and the lower line of the Ascending Broadening Wedge Pattern .
In terms of Elliott Wave theory , Bitcoin appears to be completing microwave C of the main wave Y of the Double Three Correction(WXY) .
I expect Bitcoin to continue to decline to the Support zone($102,000-$107,120) and the Potential Reversal Zone(PRZ) and then start to rise again.
I choose to label this idea as ''Long''.
Note: If Bitcoin falls below $100,200, we should expect further declines.
Please respect each other's ideas and express them politely if you agree or disagree.
Bitcoin Analyze (BTCUSDT), 1-hour time frame.
Be sure to follow the updated ideas.
Do not forget to put a Stop loss for your positions (For every position you want to open).
Please follow your strategy and updates; this is just my Idea, and I will gladly see your ideas in this post.
Please do not forget the ✅' like '✅ button 🙏😊 & Share it with your friends; thanks, and Trade safe.

ZIG ZAG PATTERN SILVER The time frame for above pattern to complete might take 1-3 months make your postion as per the time frame. Target green line Stoploss red line and silver will fly as per pattern can add now and in little dips later

BTC Double Bottom incoming?Short term analysis.
I think BTC will drop back to 101800 to make double bottom then bounce back to 105200

NZDJPY: Another Bearish YEN Pair 🇳🇿🇯🇵
One more YEN pair that looks bearish to me is NZDJPY.
I see 2 bearish price action confirmations after a test
of the underlined horizontal resistances:
the price broke a support line of a rising wedge pattern
and a neckline of a double top.
The price may drop now to 86.66 level.
❤️Please, support my work with like, thank you!❤️
I am part of Trade Nation's Influencer program and receive a monthly fee for using their TradingView charts in my analysis.

A Contrarian View On the US DollarI don't recall the last bullish headline I saw for the US dollar, bearish sentiment may be stretched, and I'm seeing plenty of clues across the US dollar index and all FX majors that we could at least be looking at a minor bounce. Whether it can turn into a larger short-covering rally is likely down to Trump's trade deals. Either way, I'm, on guard for an inflection point for the dollar.
Matt Simpson, Market Analyst at City Index and Forex.com

TON Looks Ready to Collapse — Is This the Start of a Bull Trap?Yello Paradisers! what if TON is about to reverse hard—are you positioned correctly, or will you be caught chasing the wrong move?
💎TONUSDT is showing clear bearish signs that can’t be ignored. The price has broken down from an ascending channel—a classic early signal of weakness. But that’s not all. This breakdown happened right at the resistance zone, and it’s backed by a clear bearish divergence on momentum indicators. Adding to the conviction, there’s a 1H Fair Value Gap (FVG) sitting right in that same region, which often acts as a magnet for price before continuation to the downside.
💎This confluence significantly increases the probability of a bearish move in the short term. So, what’s the plan?
💎For risk-averse (safe) traders, the optimal approach is to wait for a pullback and retest of the broken structure. This allows for a cleaner entry and a much better risk-to-reward (RR) ratio. For the aggressive players, there’s potential to enter with reduced size from the current level, understanding that it carries more risk without confirmation.
💎However, if the price manages to break out and closes candle above the resistance zone, this entire bearish setup becomes invalidated. In that case, the smart play is to stay patient and wait for a more favorable structure or price action to develop.
🎖If you want to be consistently profitable, you need to be extremely patient and always wait only for the best, highest probability trading opportunities.
MyCryptoParadise
iFeel the success🌴

QQQ new lows incoming?QQQ has been consolidating in a massive rising wedge and looks set to break down from it.
Unless price can get back above previous highs, then new lows is the most likely outcome here.
I've marked off support levels on the downside that might be good opportunities to scale in on the long side.
Let's see how low we go.
