The What vs. The Where - A 2nd Breakout Pattern After A Nice WinA few days ago we looked at a bullish breakout opportunity on Silver and it played out perfectly. After a lovely move to the upside, price has started to consolidate again providing us with a very similar setup.
HOWEVER, just as in the case of the first, we need to be aware that once again the WHAT doesn't necessarily align with the WHERE stopping this from being a Grade A trading opportunity.
Please leave any questions or comments below and remember to hit that LIKE button before you go!
Akil
Wedge

AG just broke wedge pattern.As yo can see AG just broke wedge, Silver also over 34 adn new discovery yesterday.

Revenue growth nine consecutive quarters Ouster’s global partner network spans over 50 countries, supporting approximately 600 customers with applications in autonomous vehicles, robotics, drones, mapping, defense, and smart cities. Ouster has been getting lots of attention lately 230k 20 call 1/16/26 I'm wondering if someone knows there's an announcement coming this year that will get them ABOVE $20. Great growth stock huge partners here are some notable ones.
Anduril Industries: weapons/defense tech *
Komatsu: construction mining *
Vecna Robotics: warehouses
NVDIA: integration/traffic ***
Forterra, Textron, Field AI, and U.S. Army: vehicles
Google Maps, Apple Maps, Oshkosh Defense, John Deere: sensory
Amazon Robotics: Ouster’s LiDAR sensors are reportedly used in Amazon’s Proteus robots, described as part of a significant order, though not officially published. ***
Right at monthly resistance now 15$ is a strong resistance. Any pull back to $10 ish would make great buying opportunity I'm long from earlier this week July 14C / 16C Aug 17C looking to add BUT I'm also trading these the daily RSI is at 75 nearing overbought, weekly has room to run at 64 monthly is at 50 which it could reject momentarily from. Either way great company to DCA shares still under 1B market cap!

Raoul Pal's Big Banana. $100 Trillion dollars Crypto market.And how on earth do we reach that point?
Is Raoul's thesis regarding the exponential age accurate, suggesting we have until 2030 to invest and reap the benefits; so "don't F@ck this up!"
As a charting enthusiast, I am eager to see if there exists a technical foundation that could allow us to teleport to those levels and estimate how many years it might take.
Let's examine the entire crypto market, which includes everything from stable coins to tangible real world assets like Gold.
We can distinctly identify three significant consolidation patterns.
Rising wedge #1
a sideways pennant
rising pennant #2
Now, considering this is a logarithmic chart.
It provides us with logarithmic amplitudes and projections.
An amplitude is a calculated move based on the boundaries of the consolidation pattern.
Essentially, it involves taking the top and bottom width and applying it to the breakout point for a rising pattern.
In a #HVF, we utilise the midline of the funnel to forecast targets.
The projections illustrated on this chart pertain to the sideways pennant, employing the flagpole to establish our target.
It is this sideways pennant pole projection that leads us to 100 trillion dollars and beyond. Test it out for yourself if you find it hard to believe these figures could become a reality :)
So there we have it; yes, 100 trillion dollars may appear excessively optimistic and fantastical, especially since we are currently at 3.28 trillion dollars.
However, the charts indicate that Crypto could indeed be the sector where the majority of financial transactions take place in the forthcoming exponential future.

AUDCHF → Hunting for liquidity. Fall from resistanceFX:AUDCHF is emerging from local consolidation and entering a distribution phase. Potentially, against the backdrop of a downtrend, the market may be interested in the liquidity zone at 0.5356
Globally, we have a strong downtrend and a countertrend correction that is facing pressure in the 0.545 zone. The decline is resuming, but at some point the market formed an EQH liquidity pool at 0.5356, which is most likely acting as a magnet pulling the price towards it...
Based on the technical situation, we can conclude that if the price continues to form a distribution towards the target, the market is quite capable of stopping the price and returning to the downtrend phase.
Resistance levels: 0.535, 0.5356
Support levels: 0.5327, 0.5314
Thus, a breakout of the resistance level of 0.5356 without the possibility of continuing growth and a return of the price below the resistance level with subsequent price consolidation in the sales zone (below 0.5356) may trigger a resumption of the downward trend.
Best regards, R. Lind

NXPC/USDT: FALLING WEDGE BREAKOUT ALERT!!NXPC Breakout Alert – 100%+ Potential on the Table
Hey Traders — if you're into high-conviction setups with real momentum, this one’s for you.
NXPC has broken out of a falling wedge pattern on the 4H timeframe and is now retesting the breakout zone. As long as it holds above the green support box, a strong upside move remains likely.
Entry Range: $1.38 – $1.44
Targets: $1.70 / $2.30 / $2.70 / $3.10
Stop-loss: $1.26
Leverage: Use low leverage (Max 5x)
This setup has the potential to kick off a powerful rally.
Keep it on your radar and trade with discipline.
Let me know if you're in this one or watching from the sidelines.

USD/CHF: Squeeze Risk Builds After Bullish ReversalRisk of a countertrend squeeze in USD/CHF is building after it printed a bullish engulfing candle on Tuesday, breaking out of the falling wedge it had been trading in over recent weeks.
While the price signal alone is bullish, to get excited about the prospect of a meaningful squeeze higher, USD/CHF needs to clear minor resistance overhead at .8246. If it can get a foothold above this level, it would generate a setup where longs could be established with a stop beneath for protection. .8333 looms as a potential target—a known resistance level that also has the key 50-day moving average sitting just above it.
Momentum indicators remain bearish but are starting to turn higher, suggesting the bearish flows that pushed USD/CHF to multi-week lows on Monday may be starting to ebb.
Good luck!
DS

Falling Wedge - Bullish Reversal - Bullish DivergenceOANDA:EURGBP has formed and broken out of a falling wedge, which is considered a bullish reversal pattern. Pattern has formed after price found support at the support trend line and broke the lower highs in the retracement!
I am expecting bullish momentum in the coming days!

What is a Bearish Breakaway and How To Spot One!This Educational Idea consists of:
- What a Bearish Breakaway Candlestick Pattern is
- How its Formed
- Added Confirmations
The example comes to us from EURGBP over the evening hours!
Since I was late to turn it into a Trade Idea, perfect opportunity for a Learning Curve!
Hope you enjoy and find value!

Wedge pattern - Bullish Strategy (MSTR)My expectations for June for Microstrategy stock aka Strategy. Ofc, It all depends heavily on BITSTAMP:BTCUSD

DEXE/USDT: FALLING WEDGE BREAKOUT!!DEXE Breakout Alert – 80% Move Loading?
Hey Traders! If you're into high-conviction plays and real alpha — hit that like and tap Follow for trade setups that actually deliver.
DEXE has broken out of a falling wedge pattern on the daily timeframe and has successfully retested the breakout level. The structure looks strong, and momentum is starting to build.
Entry Zone: $13.4 – $14.4
Targets: $16.1 / $18.2 / $21.2 / $24.4
Stop-loss: $12.60
Leverage: Use low leverage (Max 5x)
This could be the beginning of a powerful upward move.
Keep this setup on your radar and manage risk accordingly.
Let me know your thoughts or if you're riding this one too.

Break down Were gunna go back down in ethfor a short period were getting a retest of the upwar slope if we get rejected looking at 20% move downwards

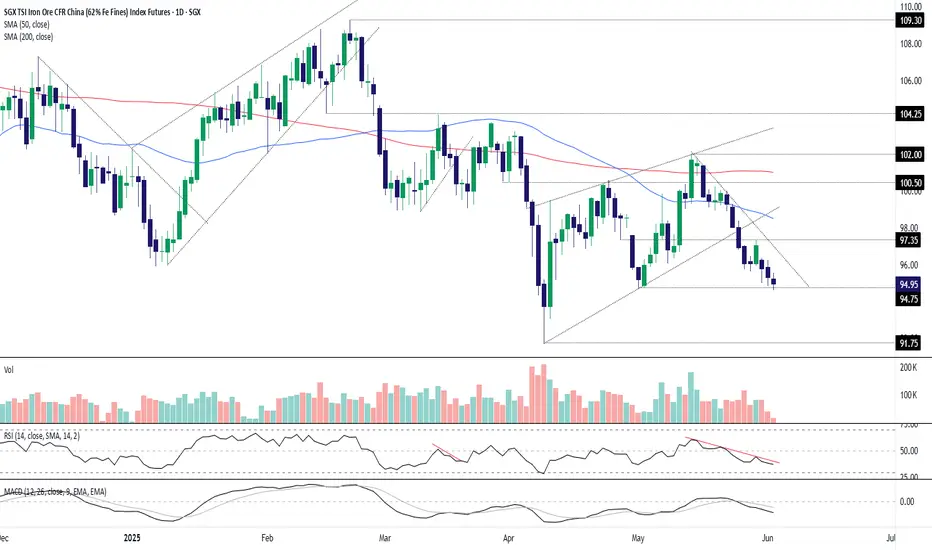
Bearish Iron Ore Bias Intact, Watching $94.75SGX iron ore looks heavy, threatening to extend the bearish break that began a week ago. The test and rejection at horizontal resistance at $97.35 last Thursday only adds to the bearish picture from momentum indicators like RSI (14) and MACD, reinforcing the bias to sell pops and downside breaks.
The price now finds itself at an interesting spot on the charts, sitting just above $94.75 after briefly dipping below it during thin overnight trade on Monday. While the bias remains lower, subdued volumes on either side of the weekend serve as a warning not to get overly bearish without a clear catalyst.
If the price can take out the overnight low and hold below $94.75, consider initiating shorts beneath the level with a stop above, targeting a potential retest of the April 9 low at $91.75.
Alternatively, if $94.75 continues to attract buyers, the setup could be flipped with longs established above the level with a stop beneath for protection. Downtrend resistance kicks in around $97, just above resistance at $97.35. They’re two potential targets.
Good luck!
DS
EURGBP Wave Analysis – 2 June 2025
- EURGBP broke daily Falling Wedge
- Likely to rise to resistance level 0.8525
EURGBP currency pair recently broke the resistance trendline of the daily Falling Wedge chart pattern from April, which encloses the earlier ABC correction (2).
The breakout of this Falling Wedge continues the active impulse wave (3), which started earlier from the key support level 0.8350.
EURGBP currency pair can be expected to rise to the next resistance level 0.8525 (which reversed the price twice at the start of May).

SOLANA It has good growth potential in midtermThe SOL will increase $150 and reach to the top of the wedge in the coming weeks .
Give me some energy !!
✨We spend hours finding potential opportunities and writing useful ideas, we would be happy if you support us.
Best regards CobraVanguard.💚

EURUSD Forms Rising Wedge + Evening Star_ Bearish SetupAs I expected in the previous idea , the EURUSD ( FX:EURUSD ) started to rise after breaking the upper line of the descending channel and hit the Long Position target with Risk-To-Reward: 1.46 .
The EURUSD is trading near the Resistance zone($1.149-$1.142) .
From a Classic Technical perspective, EURUSD appears to be completing a Rising Wedge Reversal Pattern . Also, a good sign for a EURUSD reversal is the formation of an Evening Star Candlestick Pattern near the upper line of the rising wedge pattern.
Also, we can see the Regular Divergence(RD-) between Consecutive Peaks .
In terms of Elliott Wave theory , I think the EURUSD corrective waves are NOT over yet, and it seems that EURUSD has completed the main wave X inside the rising wedge pattern.
I expect EURUSD to decline to at least $1.126 AFTER breaking the lower line of the wedge pattern.
Note: If EURUSD touches $1.14903 , we can expect more pump.
Please respect each other's ideas and express them politely if you agree or disagree.
Euro/U.S. Dollar Analyze (EURUSD), 4-hour time frame.
Be sure to follow the updated ideas.
Do not forget to put a Stop loss for your positions (For every position you want to open).
Please follow your strategy and updates; this is just my Idea, and I will gladly see your ideas in this post.
Please do not forget the ✅' like '✅ button 🙏😊 & Share it with your friends; thanks, and Trade safe.

Small Clues In A Big Breakout PatternSilver has been consolidating as of late and if there's one thing we no about contraction is that it eventually leads to expansion aka a breakout.
The issue with this particular setup is that based on location of the pattern, there's no predetermined directional bias for the breakout.
Therefor, what we're doing today is looking for small clues that the market has provided to give us any type of edge in predicting a breakout one way or another and guess what. WE FOUND SOME!
If you have any questions or comments, please leave them below!
Akil

A Different Way To Use the RSI To Trade Deceleration Patterns A deceleration pattern is a pattern that forms at the end of a directional move as it starts to lose steam. 2 good ones to learn are the rising/falling wedge & channel.
The problem wit these patterns however, is that it can sometimes be difficult to tell when that final reversal may come backing it hard to place stops.
Lately, and by that I mean for the past year or so, I've been tracking a very specific pattern on the RSI (Relative Strength Index) indicator to help me with these situations.
Please LIKE & SHARE and if you have any questions or comments, leave them below
Akil

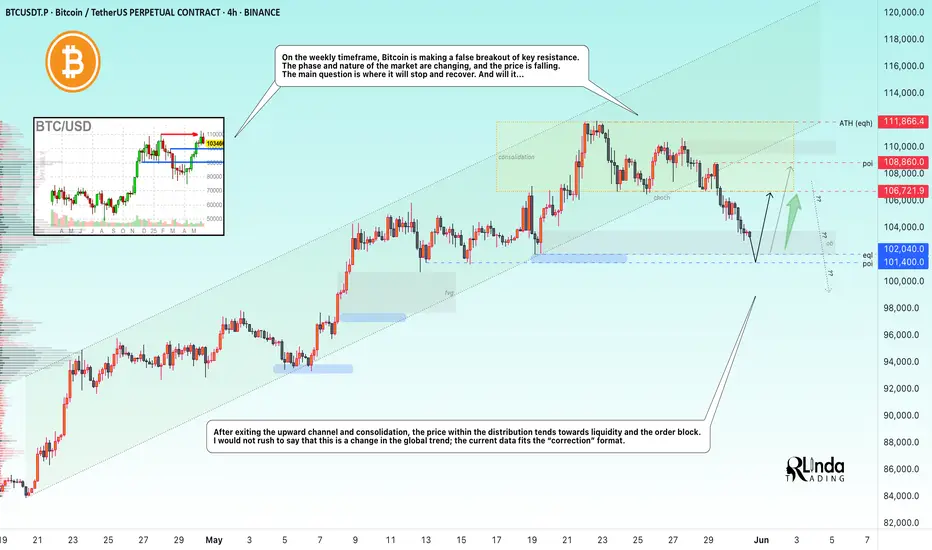
BITCOIN → Correction or trend reversal? Why is 101K important?BINANCE:BTCUSDT.P is exiting the upward channel after a false breakout of the key resistance level of 110K (previous ATH). Liquidation?
Quite an interesting situation with James Wynn. As they say, money loves silence, especially when it comes to a highly manipulated market... A week after the whale's actions, Trump decided to play the market again by creating emotional swings: he announced tariffs on the EU, canceled them, then made claims against China and is now ready to reintroduce tariffs on the EU. Things didn't end well with James... Liquidation before the rally?
On the weekly timeframe, Bitcoin is making a false breakout of the key resistance level of 110K. The phase and nature of the market are changing, the price is falling, breaking the structural support of 106500. The main question is where the stop and recovery will be. And will there be one...
After exiting consolidation and the upward channel, the price within the distribution is moving towards liquidity and the order block. I would not rush to say that this is a change in the global trend; the current data fits the “correction” format.
Support levels: 102000, 101400
Resistance levels: 106700, 108800
102-100K is a fairly important zone for the market; a breakout in this area could open the way to a (local) bottom. Bulls may not be able to hold the market, in which case a global sell-off could form. Therefore, I believe that retesting the 102000 level will end with a liquidity grab and a correction along the trend, during which the price may test the 106K - 108K level, which will determine the future of the market: consolidation, growth, or decline...
Best regards, R. Linda!
TAOUSDT at a Crucial Level – Breakout or Breakdown?Yello, Paradisers! Is TAOUSDT gearing up for a strong bounce, or is a deeper correction on the horizon? Let’s break it down.
💎TAOUSDT has completed a healthy retracement, forming a descending channel alongside a Dragon Butterfly candlestick pattern—both backed by high volume. Historically, when this pattern appeared with strong volume, we saw a solid upside move. This time, we also have a bullish divergence, adding confluence to the bullish case. However, to increase the probability of a breakout, we need to see price breaking above the descending channel with strong volume.
💎Now, what if price drops further or shows panic selling? In that case, we must wait for clear bullish confirmations before jumping in. Ideal signals include - Bullish I-CHoCH formation, W pattern or Inverse Head and Shoulders on lower timeframes. Any of these would significantly increase the probability of a strong bounce from the strong support zone.
💎 However, If price closes a candle below the strong support zone, it will invalidate our bullish outlook. If that happens, the best move is to stay patient and wait for better price action before considering any long positions.
🎖Patience is what separates pros from amateurs. If you want to make it in this game, trade smart, stay disciplined, and always wait for high-probability setups. The market will always test your emotions—don’t let it break your strategy.
MyCryptoParadise
iFeel the success🌴

Shiba INU - Bottom Buy confirmed istorical Pattern Repetition (2024 & 2025):
The chart suggests that SHIB is following a repeated pattern cycle:
Stage 1 – Falling Wedge (Completed)
Stage 2 – Cup and Handle (Completed)
Stage 3 – W Pattern (Recently Completed)
Stage 4 – Inverted Head and Shoulders (Pending Formation)
Key Highlights:
✅ Buying Zone Identified between 0.00001167 – 0.00001271 USD.
🎯 New Target: 0.00002431 USD, representing a potential 90% return from the buying zone.
⚠️ Breakout Awaited: Stage 4 pattern (Inverted Head and Shoulders) is pending confirmation, which could trigger a major upward move.
🔄 Emphasis on pattern repetition to project future price action.
Conclusion:
The chart analysis suggests that SHIBA INU is mirroring its previous bullish cycle. With three bullish stages already complete and the fourth (inverted head and shoulders) pending, a breakout could lead to a significant price rally targeting 0.00002431 USD.

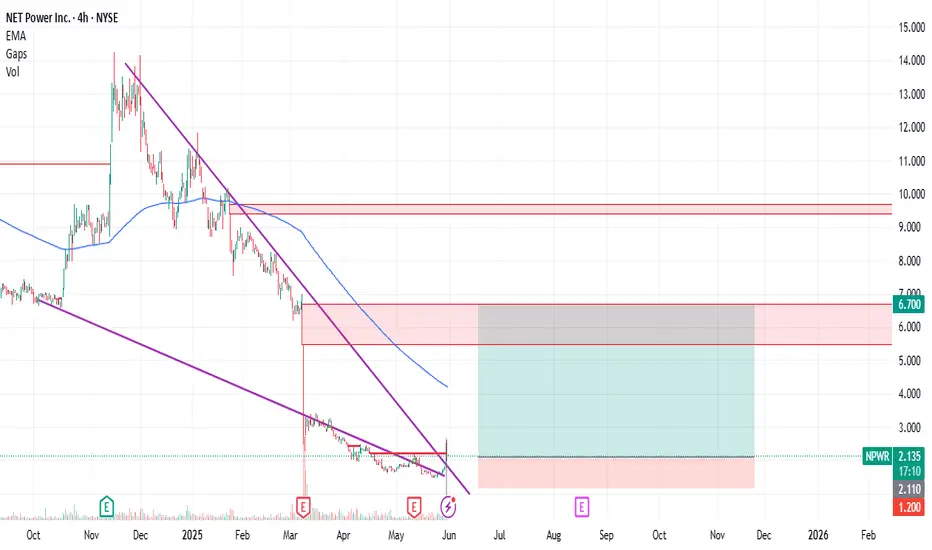
NPWR : Small Position Size Play with 5.00 Risk-Reward RatioNet Power Inc. NPWR stock has seen high volume and a tendency to break the falling wedge. Can this initiative close the gap that ended at 6.7 ?
This traded can be tried with very small position size.
Because Stop-Loss and Target are very wide.
Risk-Reward Ratio : 5.00
Stop-Loss : 1.20
Target: 6.70
ETHEREUM Wedge Breakout! Sell!
Hello,Traders!
ETHEREUM was trading in an
Uptrend but then the coin
Formed a bearish wedge pattern
And we are now seeing a bearish
Breakout so we are locally
Bearish biased and we will be
Expecting a long awaited
Bearish correction
Sell!
Comment and subscribe to help us grow!
Check out other forecasts below too!
Disclosure: I am part of Trade Nation's Influencer program and receive a monthly fee for using their TradingView charts in my analysis.
