NZDJPY: Another Bullish Confirmation 🇳🇿🇯🇵
If you remember, I already posted a bullish outlook for NZDJPY on Friday.
This morning, I spotted one more intraday bullish confirmation.
I see a breakout of a resistance line of a bullish flag pattern on an hourly time frame.
I expect a bullish movement at least to 85.9 level soon.
❤️Please, support my work with like, thank you!❤️
I am part of Trade Nation's Influencer program and receive a monthly fee for using their TradingView charts in my analysis.
Wedge

ETH's situation+ Target PredictionThe COINBASE:ETHUSD is in a Bullish phase by a Falling Wedge Pattern.
A falling wedge indicates the potential for price to reach to $2750.
Note if the Wedge Pattern is broken downwards with the strength of Bearish candles , this analysis of ours will be failed.
Give me some energy !!
✨We spend hours finding potential opportunities and writing useful ideas, we would be happy if you support us.
Best regards CobraVanguard.💚
_ _ _ _ __ _ _ _ _ _ _ _ _ _ _ _ _ _ _ _ _ _ _ _ _ _ _ _ _ _ _ _
✅Thank you, and for more ideas, hit ❤️Like❤️ and 🌟Follow🌟!
⚠️Things can change...
The markets are always changing and even with all these signals, the market changes tend to be strong and fast!!

ES1! (S&P500 Mini Futures) - Support Trendline Price Test -DailyES1! (S&P500 Mini Futures) price is currently testing a support trendline around $5900.
If several daily Price candles close below $5865 this month, a pullback in the price can occur (rising wedge pattern).
Volume has been decreasing in May 2025, compared to March and April.
Finance and Technology corporate earnings season has passed. The U.S. government 90-day tariff pause is set to expire in early July (pending trade deal negotiations with other countries).
Tariff and trade deal news, breaking news, corporate earnings, government law changes, consumer sentiment, inflation data, the FOMC, and presidential announcements can all affect the prices of stocks and ETFs.

GOLD consolidated below a key level on FridayGold is in a downtrend forming a counter-trend correction. Friday's trading session closes below the key level of 3203-3205. Buyers are weaker than sellers.
But, before the continuation of the fall MM is quite likely to test the resistance to provoke ordinary buyers before the fall
Scenario: the growth attempt may turn out to be false. A retest of 3203 resistance, a false breakout and price consolidation below 3203 is a sell signal.
Additional scenario: MM trap to provoke buyers to buy. A retest of the far resistance 3230, a false breakout and a price fixing below 3223 could start a decline

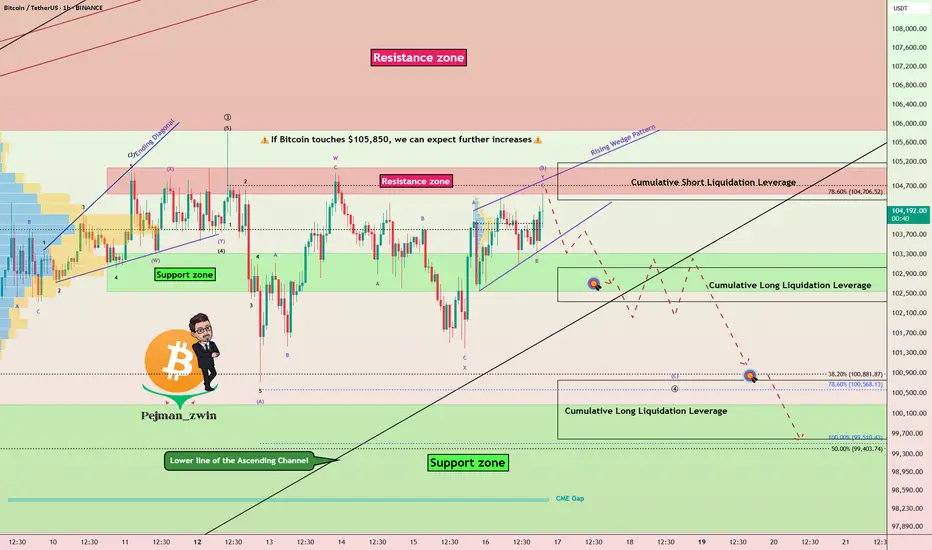
Bitcoin at Resistance With Weak Momentum-Bearish SetupBitcoin ( BINANCE:BTCUSDT ) finally reached the Resistance zone($105,100-$104,520) as I expected yesterday. Of course, the way Bitcoin reached the resistance zone was NOT with high momentum , so I decided to share this analysis with you.
In terms of Classic Technical Analysis , Bitcoin appears to have formed a Rising Wedge Reversal Pattern between Support zone($103,320-$102,600) and Resistance zone($105,100-$104,520) over the past few hours .
In terms of Elliott Wave theory , given Bitcoin’s low momentum and the Heavy Cumulative Short Liquidation Leverage($105,180-$104,412) ahead of Bitcoin, it appears that Bitcoin has completed microwave B of the main wave 4 with a Double Three Correction(WXY) .
I expect Bitcoin to decline to at least $102,800 at the first target AFTER breaking the lower line of the Rising Wedge Pattern, and if the Support zone($103,320-$102,600) and lower line of the ascending channel(Major) are broken, we should expect a drop to Cumulative Short Liquidation Leverage($100,763-$99,600) .
Note: If Bitcoin touches $105,850, we can expect further increases.
Please respect each other's ideas and express them politely if you agree or disagree.
Bitcoin Analyze (BTCUSDT), 1-hour time frame.
Be sure to follow the updated ideas.
Do not forget to put a Stop loss for your positions (For every position you want to open).
Please follow your strategy and updates; this is just my Idea, and I will gladly see your ideas in this post.
Please do not forget the ✅' like '✅ button 🙏😊 & Share it with your friends; thanks, and Trade safe.
Caught her playin’ both sides but trust me, she’s loyal in sellPrice be flirtin’ with that support — but yo, don’t get cozy, it’s fakin’ love before the real drop hits!”
Breakdown:
Bearish wedge structure
Liquidity grab incoming
Two clean selling zones
Targeting that juicy demand block below
Smart money’s movin’ silent. You ready or you sleepin’ on it?

EUR_AUD BULLISH WEDGE|LONG|
✅EUR_AUD made a bullish
Breakout from the bullish
Wedge pattern and the
Breakout is confirmed so
We are bullish biased and
We will be expecting a
Further bullish move up
On Monday when the
Market reopens
LONG🚀
✅Like and subscribe to never miss a new idea!✅
Disclosure: I am part of Trade Nation's Influencer program and receive a monthly fee for using their TradingView charts in my analysis.

ABNB close to huge breakoutABNB is poised to have a huge breakout, this massive wedge reminds me of the Tesla multi year consolidation and breakout. With the new version of ABNB we should see increased cash flows at they attempt to integrate more experiences into the platform. Need a chef for a luxury weekend? They will also have experiences for locals to try to make it a one in all app for many things. My fib extension is at 225. Remember this is a monthly chart and will take some time.

$WIFUSDT pushing towards $1.50BINANCE:WIFUSDT shows a bullish breakout from a descending wedge pattern following a strong uptrend. This suggests a high probability of continued upward momentum, with the primary target being the resistance zone around $1.50 already marked out on the chart with a yellow line.
TP1: $1.20
TP2: $1.50
Kindly support this analysis to enable it reach to other people, and do comment your thoughts.

EUR-AUD Bullish Breakout! Buy!
Hello,Traders!
EUR-AUD has formed a bullish
Wedge pattern and now we are
Seeing a bullish breakout which
Is confirmed so we are bullish
Biased and we will be expecting
A further bullish move up
Buy!
Comment and subscribe to help us grow!
Check out other forecasts below too!
Disclosure: I am part of Trade Nation's Influencer program and receive a monthly fee for using their TradingView charts in my analysis.

Bitcoin can drop from wedge to 100K pointsHello traders, I want share with you my opinion about Bitcoin. After consolidating for an extended period within a triangle pattern, the price eventually broke out with strong bullish momentum. The move was supported by a solid rebound from the buyer zone and a clean breakout above the 92800 - 94200 support area. This breakout initiated a steep climb, forming a new upward wedge structure, defined by narrowing trend lines and rising local highs. Currently, the price is trading near the resistance boundary of the wedge, around the 104000 - 105000 zone. This zone has already triggered one rejection and is showing signs of weakening bullish strength. Given the rising wedge geometry and the fading impulse strength, the risk of a correction is increasing. The current structure typically leads to a pullback, especially after such a steep rise. I expect that BTC may rise to the resistance line of the wedge and then drop below the support line, thereby exiting from this pattern. That's why I set my TP 1 at the 100K points. Please share this idea with your friends and click Boost 🚀

Gold Bullish Outlook - Gold BullishFollowing strong buying momentum observed yesterday, gold is currently consolidating within a falling wedge pattern — a typically bullish setup. A breakout from this pattern could trigger a fresh upward move in the price of gold.
Post-Breakout Bullish Targets:
Target 1: 3230
Target 2: 3240
Target 3: 3250
Target 4: 3275
Disclaimer: This is a technical analysis-based outlook. Please assess your risk-to-reward ratio and follow your individual trading strategy. This is not financial advice — trade responsibly and according to your plan.

Long Swing Idea – Waiting on Confirmation at Wedge SupportRefining the previous idea: Price is holding the lower boundary of an Ascending Broadening Wedge, showing signs of support rejection. However, we’re noticing a clear decline in bullish momentum. No rush to enter—we wait for strong confirmation before committing to a swing long. A solid reaction or breakout of a minor structure will be the signal. Until then, patience is the edge.

Bitcoin Ascending Triangle (4H)BINANCE:BTCUSDT might be forming an ascending triangle on the 4H chart, with a horizontal resistance at $105k and support being the resistance of the broadening wedge we identified last week: Bitcoin Ascending Broadening Wedge (4H)
A sustained break above $105k would set the target at $109k, very close to ATH.

OP/USDT Breakout Alert!!🚀 OP Breakout Alert – 100% Potential Incoming?! 👀🔥
Hey Traders! If you're all about high-conviction plays and real alpha, smash that 👍 and tap Follow for more setups that actually deliver! 💹💯
OP has successfully broken out from the falling wedge pattern on the daily timeframe, which historically signals a strong trend reversal. After retesting the breakout zone, price action looks ready for a fresh upside move!
🔹 Entry: CMP and add more up to $0.76
🎯 Targets:
→ $0.98
→ $1.21
→ $1.43
→ Final Target: $1.64
🛑 SL: $0.688
⚙️ Leverage: Low leverage (Max 5x)
📊 Structure:
Falling wedge breakout ✅
Retest holding strong ✅
Volume starting to pick up 📈
We’re watching closely—this setup has the potential to mimic the last 114% rally. Let's see how it unfolds! 🚀
💬 What’s your take on OP from here?

$RR: Broken Resistance, Following SupportAfter a strong run-up, this stock found a solid consolidation range between $1.50 - $2.20, building a healthy base. We've broken resistance three times, creating new levels, but support has been steadily climbing since December – a great sign of underlying strength. I predict we will come back to the latest resistance, creating a new support, for the stock to ride to $3.50
Current Setup:
Bull Flag Formation: Recently broke out of the flag pattern.
Support Flip: Price is retesting previous resistance as new support – a textbook setup for the next leg up.
Volume Pickup: Notice the volume spikes on breakouts, as well as increased continued action these past weeks, confirming interest.
Target: Potential move up to the $3.50+ range if momentum continues.
Risk Management: Watch for a confirmed support hold before entering.
__________________________________________________________________________________
All love and best of luck, traders

Brent Crude Breaks Lower: Iran Deal Could Add 800K BarrelsBrent crude has dropped over 2% following news that the US and Iran may strike a deal, potentially adding 800,000 barrels per day to global supply. We explore the technical setup, including a wedge pattern and the risk of a deeper fall.
This content is not directed to residents of the EU or UK. Any opinions, news, research, analyses, prices or other information contained on this website is provided as general market commentary and does not constitute investment advice. ThinkMarkets will not accept liability for any loss or damage including, without limitation, to any loss of profit which may arise directly or indirectly from use of or reliance on such information.

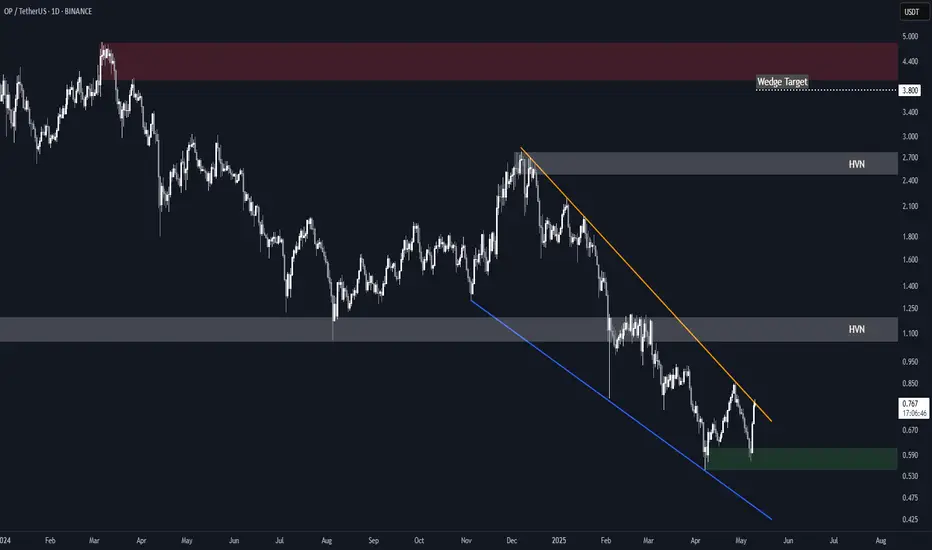
Optimism (OP) Falling WedgeBINANCE:OPUSDT is attempting a breakout from a 14 months long falling wedge.
A sustained break above the resistance in the near term would set the target at $3.80, just shy of the main $4.00-$4.80 supply zone.
Key Levels to Watch
• $0.55-$0.60: Main demand zone and invalidation point for the setup
• $1.00-$1.20: High Volume Node and key S/R dating back to June 2023.*
• $2.50-$2.80: High Volume Node and wedge high point.*
• $4.00-$4.80: Main supply zone.
* These could offer resistance and represent good levels for partial TPs.
$UNG starting to accumulate a position. Swing TradeBuilding a position in unleveraged natural gas AMEX:UNG in $13-14's
Divergence on price/RSI.
Falling Wedge
Would like to see price get over and hold above daily 50MA
Will likely update once that is achieved
After 50MA is achieved and held, breakout the wedge and target the 200MA daily for profit.
Add on down days and be very patient with this one

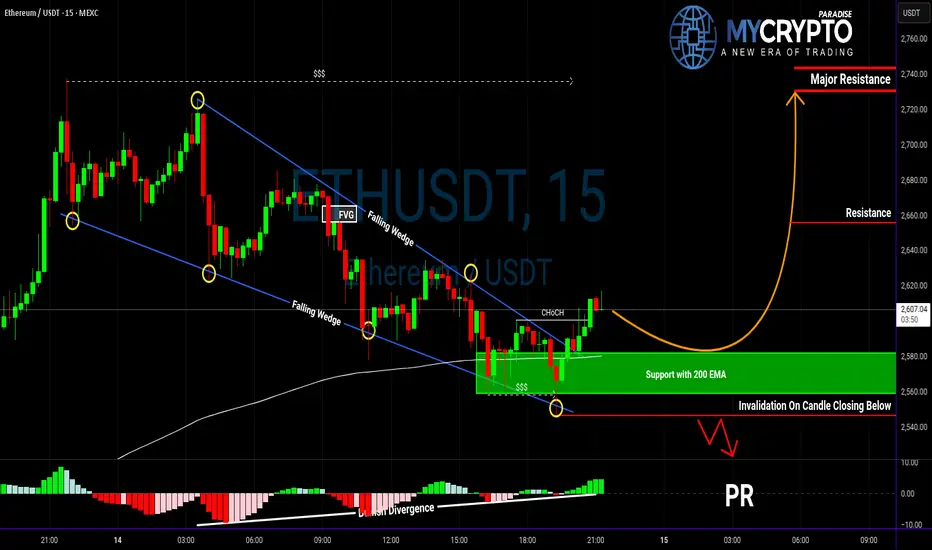
ETH Bulls on Alert: Is This the Move We've Been Waiting For?Yello Paradisers, did you catch that bullish breakout on ETH or are you still stuck waiting for confirmation?
💎Ethereum has officially broken out of its falling wedge pattern, which is a well-known bullish structure often signaling a trend reversal. What gives this breakout even more weight is that ETH has established a support zone exactly at the 200 EMA—an area that historically acts as a key level for institutional traders.
💎Adding to the bullish case, we’ve also identified a bullish divergence on the momentum indicators, which often suggests weakening selling pressure and the potential for upside. More importantly, there has been a clear bullish CHoCH (Change of Character), confirming that market structure is shifting in favor of the bulls. With all of these signals aligning, the probability of a continued bullish move is significantly higher.
💎However, the most disciplined traders understand that no setup is perfect without confirmation. A pullback to the support zone would offer a textbook opportunity for a high-risk-to-reward entry—ideal for bulls who are patiently waiting for a safer entry point rather than chasing the move. This kind of setup allows us to manage our risk properly and act only when the odds are clearly in our favor.
💎That said, if the price breaks down and closes below the support zone, the bullish idea is completely invalidated. This is the level where we draw the line and step aside. Being able to invalidate your own bias is what separates traders who survive from those who don't.
🎖We are playing it safe right now. If you want to be consistently profitable, you need to be extremely patient and always wait only for the best, highest probability trading opportunities.
MyCryptoParadise
iFeel the success🌴
SUIUSDT → False breakdown of support before growthBINANCE:SUIUSDT has entered a consolidation phase within a bullish trend. The chart shows a zone of interest and a trigger area that are worth paying attention to...
The coin looks quite positive. An upward trend is forming, which is also supported by the growth of Bitcoin and a relatively positive fundamental background.
Technically, SUI is consolidating between 4.110 and 3.811. Below the support level, a huge liquidity pool has formed, which has not yet been tested. There is a high probability of a false breakdown before the growth continues, but if the market turns out to be more aggressive, buyers may not let the price fall to 3.811, in which case we can consider a breakout of the resistance at 4.11-4.275 and consolidation of the price above these levels with the aim of continuing growth.
Support levels: 3.811, 3.667
Resistance levels: 4.11, 4.275
The movement of Bitcoin shows that the market is gathering liquidity as part of a local correction against the backdrop of a bullish trend. Yesterday, we all witnessed a local liquidation, but there are no reasons for a decline yet. SUI, in an ideal scenario, may test support at 3.811 and form a false breakdown before continuing to grow.
Best regards, R. Linda!

EURAUD Falling wedge Idea 🧠 Technical Overview:
The chart shows EURAUD trading within a falling wedge pattern — a classic bullish reversal formation.
Price has respected the wedge boundaries multiple times, indicating strong technical structure.
There is also a highlighted demand zone (marked in yellow) around 1.76500–1.77000, which has acted as previous support and resistance.
🔎 Key Elements:
✅ Falling Wedge Pattern
Bullish pattern, suggesting a potential breakout to the upside.
Price is near the bottom of the wedge, making it a good risk-reward zone for a long (buy) position.
A breakout above the wedge resistance would confirm bullish sentiment.
🟨 Horizontal Resistance Zone: 1.7650–1.7700
This zone has acted as a key resistance in the past.
If price breaks out of the wedge, this is the logical target area.
Traders may consider taking partial profits here or watching for rejection signals.
📈 Trading Plan (Example Idea):
Entry (Buy):
Consider buying near the lower wedge support, ideally with a bullish candlestick pattern.
More conservative entry: wait for a break and close above the wedge resistance.
Target:
First target: 1.7650–1.7700 (yellow zone)
Second target (if momentum is strong): possible continuation toward 1.7850+
Stop Loss:
Below the most recent swing low, ideally under 1.7200 for a safe buffer
⚠️ Risk Considerations:
A breakdown below the wedge invalidates the bullish idea.
Watch for AUD strength due to upcoming Australian data or China-related sentiment.
Don’t trade without confirmation (e.g., bullish engulfing candle, volume spike, etc.)
📌 Summary:
Pattern: Falling Wedge (Bullish)
Bias: Bullish – potential breakout and move toward 1.7700
Key Levels:
Support: 1.7200
Resistance: 1.7700
Action: Wait for wedge breakout confirmation or buy near lower boundary with tight stop.

Stellar (XLM) Falling Wedge + Inverse Head & ShouldersBINANCE:XLMUSDT has recently broken out of two major bullish patterns:
• Falling Wedge: The breakout above the descending resistance (orange) confirms the wedge setup, with a measured target around $0.70.
• Inverse Head & Shoulders: Breakout confirmed with a measured target around $0.40.
Key Levels to Watch
• $0.30 – 0.618 Fib level. IH&S neckline and current support. A break below it would invalidate the IH&S setup and potentially lead to a retest of the wedge's resistance as support.
• $0.36 – 0.5 Fib level and previous S/R.
• $0.40 – IH&S measured move target.
• $0.50 – 0.236 Fib level and previous resistance / swing high.
• $0.70 – Wedge measured move target.
Volume Analysis
Breakout volume is not as strong as expected, suggesting the need for further confirmation. A continuation with increasing volume would strengthen the bullish case.
