Wedge Pattern: A Key to Trend Reversals and Continuations📈 Wedge Pattern: A Key to Trend Reversals and Continuations
A wedge pattern is a technical chart formation that signals a potential reversal or continuation in the market. It’s formed when price moves between two converging trendlines — either sloping upward or downward — creating a narrowing range over time.
There are two main types of wedge patterns:
🔻 Falling Wedge (Bullish)
Formed during a downtrend or as a correction in an uptrend.
Characterized by lower highs and lower lows, with the slope of the support line steeper than the resistance line.
Typically signals a bullish reversal as momentum builds for a breakout to the upside.
✅ Confirmation: Break above the resistance line with volume surge.
🔺 Rising Wedge (Bearish)
Appears during an uptrend or as a correction in a downtrend.
Shows higher highs and higher lows, but the support line is steeper than the resistance line.
Often leads to a bearish reversal, especially when volume declines into the pattern.
⚠️ Confirmation: Break below the support line with increasing volume.
🧠 Key Characteristics
Volume tends to decrease as the pattern forms, indicating a pause in momentum.
The breakout direction (up or down) determines whether it’s a continuation or reversal signal.
Wedges can appear on any time frame and are useful for both day traders and long-term investors.
📊 Trading Tip
Always wait for confirmation of the breakout before entering a trade. False breakouts can be common, especially in low-volume environments
Wedge

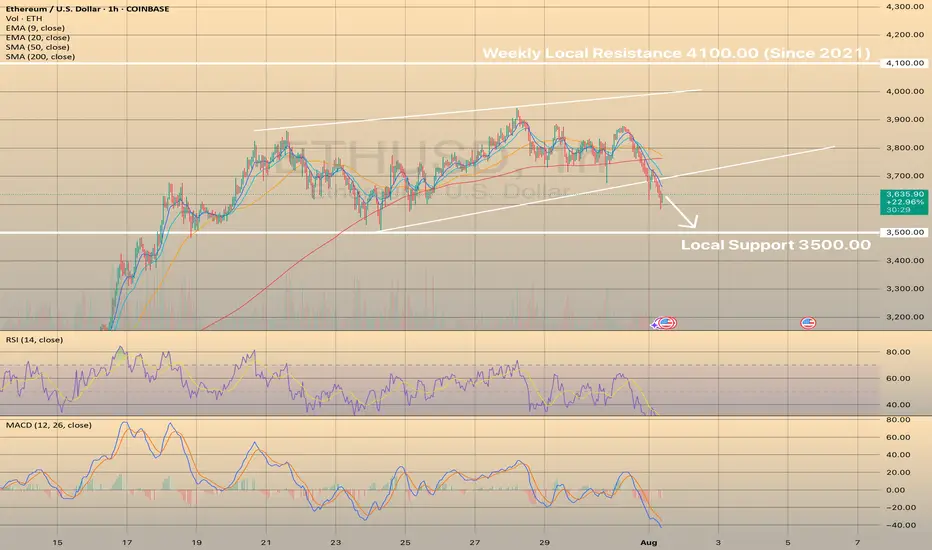
ETHUSD BROKE THE LOWER BORDER OF THE WEDGE. PRICE IS MOVING TOWAETHUSD BROKE THE LOWER BORDER OF THE WEDGE. PRICE IS MOVING TOWARDS THE LOCAL SUPPORT.
Yesterday, Ethereum saw its largest monthly increase since July 2022, thanks to strong inflows into exchange-traded funds and increased activity in the Ethereum treasury. US exchanges are working to obtain regulatory approval for a standardized framework for listing crypto funds. Coinbase and JPMorgan have joined forces to provide Chase customers with access to crypto products.
Despite these positive developments, the short-term outlook does not indicate a bullish setup. It appears that all the information has already been factored into the price. The pair moves towards the local support of 3,500.00. However, in the long term, these developments are favorable for investment.
USOIL REACHED THE 6,900.00 SUPPORT LEVEL. WHAT'S NEXT?USOIL REACHED THE 6,900.00 SUPPORT LEVEL. WHAT'S NEXT?
As we told July 31, the price got reversed towards first support level of 6,900.00. Market participants are waiting for the OPEC+ meeting this week, expecting a significant output hike. Currently, the price sits slightly above the support level. Although, the asset trades above this level, considering the current weakness of the asset, further decline is expected. The 6,800.00 support level is the next target here.

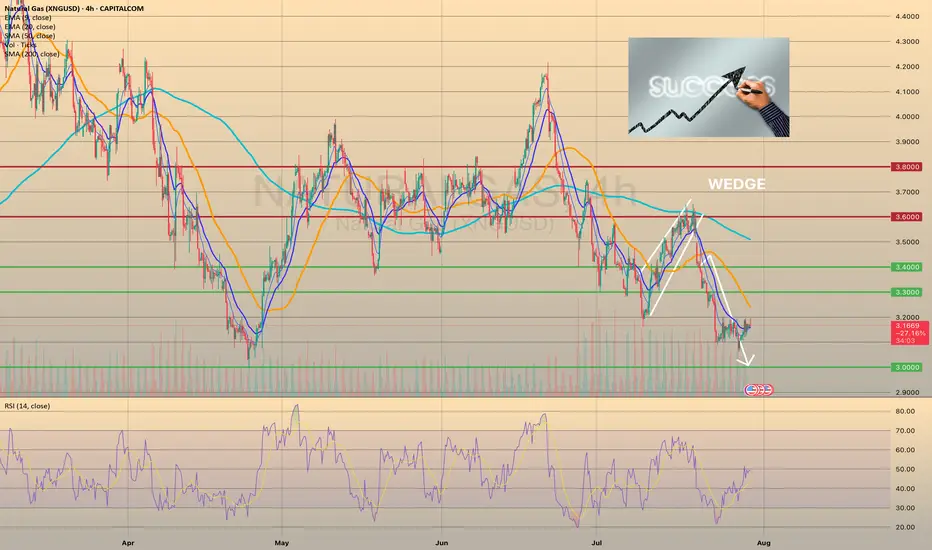
U.S. NATURAL GAS SUCCESSFULLY REBOUNDED FROM FIRM SUPPORT.U.S. NATURAL GAS SUCCESSFULLY REBOUNDED FROM FIRM SUPPORT.
Yesterday the natural gas storage report came out higher than expected. U.S. natural gas inventories increased by 48 billion cubic feet last week to 3,123 Bcf, increasing the surplus over the five-year average to 195 Bcf from 171 Bcf the week before, the EIA reports. The storage increase was bigger than the 24 Bcf average for the week, and above the 36 Bcf estimate. However, the price rised on 2.35% afterwards, supported by increased volume, which indicates the strength of the level. The upward movement towards the 3.3000 level is highly expected.
Additionally, seasonals suggest us that current prices may become the lowest till the end of the year. Historically, since August the natural gas prices increase in anticipation of a new heating season and higher energy demand (pic2).

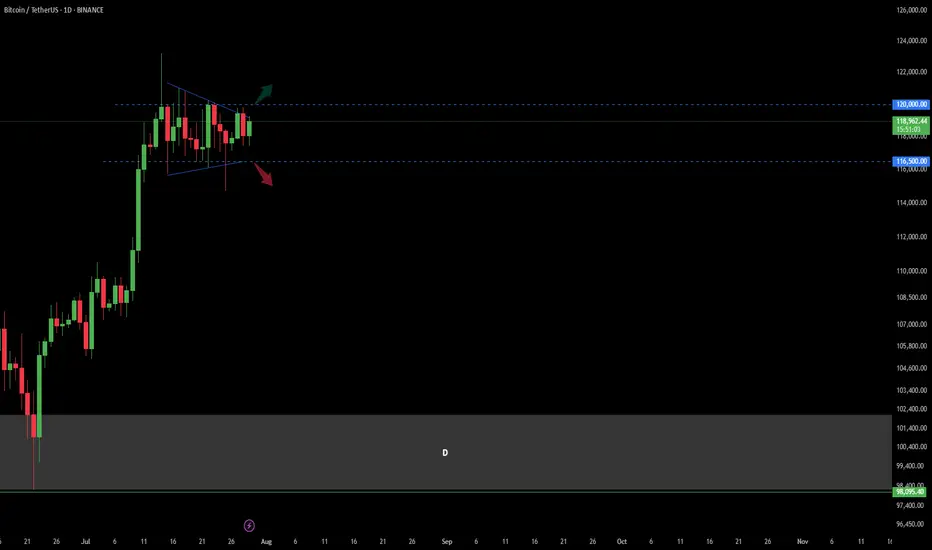
Bitcoin Trend Analaysis UP or DOWN?!Price capped in a wedge in Daily time frame.
There was a fake break from the bottom of this wedge last week and sharply got back to the top of it!
Now : break and confirm above 120 K in Daily would make the market BULLISH
break and confirm under 116.5 K in Daily would make the market BEARISH.
other wise market is still in a range mode...
TSLA Breakout Watch: Symmetrical Triangle Squeeze!Trade Summary
Setup: Symmetrical triangle pattern tightening since March; volatility compression signals an imminent breakout.
Entry: On daily close above the triangle resistance (~$324)
Stop‑loss: Below triangle support (~$305)
Targets:
• Target 1: $375
• Long-term: $500+
Risk/Reward: ~2.5–3:1 (Initial target), higher for long-term hold
Technical Rationale
📈 Symmetrical triangle: Clear converging trendlines; price nearing apex after months of higher lows and lower highs
🔔 Volatility squeeze: Range compression increases odds of explosive move
⏳ Daily timeframe: Signals a swing/position trade opportunity with significant upside
Catalysts & Context
⚡️ Earnings season ahead could trigger a breakout
🌱 EV sector momentum and renewed tech leadership
🏦 Analyst upgrades and potential for macro rate cuts
Trade Management Plan
Entry: Wait for a daily close and volume confirmation above $324 resistance
Stop-loss: Tight initial stop below $305; trail to breakeven after breakout confirmation
Scaling: Partial profits at $375; let remainder run for $500+ if momentum continues
Poll
What’s your view? Are you watching TSLA? Comment below or vote:
🔼 Bullish
🔽 Bearish
🔄 Waiting for confirmation
Follow us for daily high-probability setups & real-time trade updates!
Disclaimer: Not financial advice. Trade at your own risk.

GBPUSD: Strong Trend-Following Pattern 🇬🇧🇺🇸
GBPUSD is going to drop lower.
The market has completed a correctional movement within
a bearish flag.
Its support violation provides a strong bearish confirmation.
I expect a drop to 1.3202 level.
❤️Please, support my work with like, thank you!❤️
I am part of Trade Nation's Influencer program and receive a monthly fee for using their TradingView charts in my analysis.

XRPUSDT → Range formation. Retest of resistanceBINANCE:XRPUSDT.P , after a false breakout of the daily resistance level of 3.352 and the elimination of traders, has entered a correction phase. The trading range shown below has been formed, with an emphasis on resistance...
XRP previously formed a false breakout of the daily resistance level of 3.352, as indicated in the idea above. After changing its market character, the price entered a correction phase. Focus on the range of 3.00 - 3.264. A retest of resistance (zone of interest and liquidity) is possible before falling to 3.161, 3.05 or to the liquidity zone of 3.00. There are no technical or fundamental reasons for exiting the consolidation; most likely, a retest of the zone of interest may end in manipulation and a pullback to support...
Resistance levels: 3.1609, 3.264, 3.352
Support levels: 3.05, 3.00
I do not rule out the fact that a retest of the 3.264 resistance level may have a breakout structure and the price will continue to rise, but based on the price behavior pattern on D1, the market structure, and market stagnation, I conclude that at the moment, the chances of seeing a correction from resistance are higher. Further developments will need to be considered after the retest of key zones on the chart...
Best regards, R. Linda!

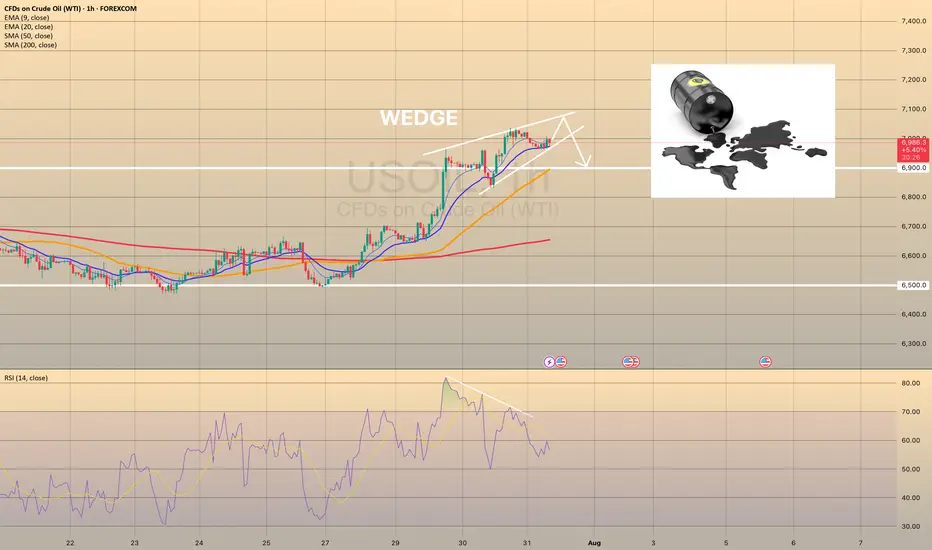
USOIL IS GOING BULLISH. FOR HOW LONG?USOIL IS GOING BULLISH. FOR HOW LONG?
Brent has started this week with a strong bullish momentum and holds near 6-week high on supply fears. President Trump announced plans to impose tariffs on Indian exports and penalize its Russian oil imports. In a parallel move, the US introduced its most extensive sanctions on Iran in seven years. The United States has even offered its oil to the world in exchange for Iranian and Russian oil, but there is evidence that the US production capacity is now at historic highs and is unlikely to grow in the near future.
However, technically oil shows us bearish divergence on RSI and bearish wedge here. The price may reverse towards 6,900.00 as a first target. EIA data showed US crude inventories jumped by 7.7 million barrels last week—the largest increase in six months and defying forecasts for a decline. Market participants are waiting for the OPEC+ meeting this week, expecting a significant output hike.
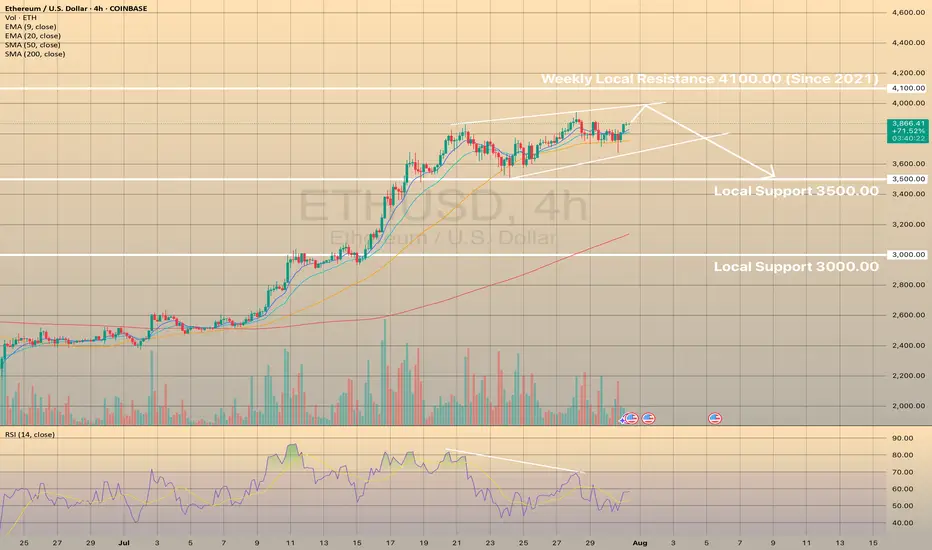
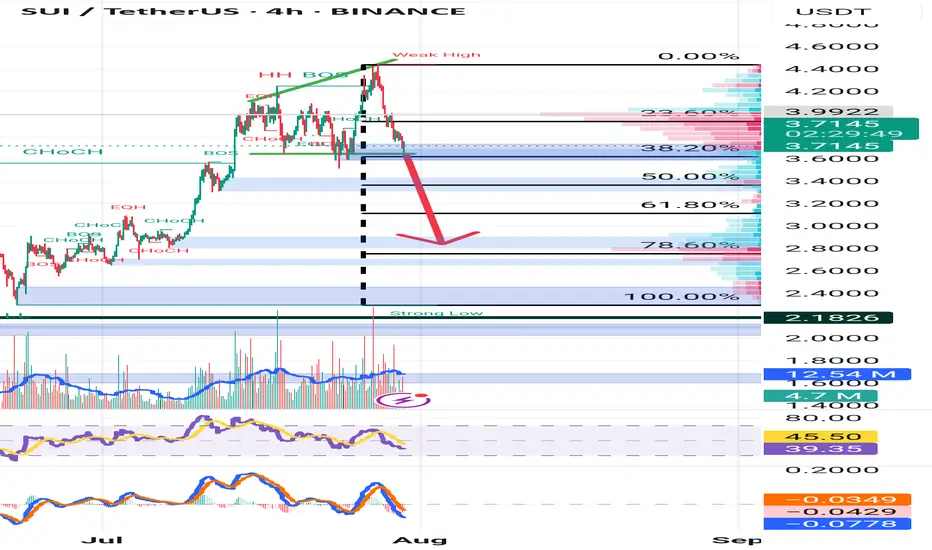
ETHUSD MAY FORM THE BEARISH WEDGE. THE PRICE IS GETTING READY TOETHUSD MAY FORM THE BEARISH WEDGE. THE PRICE IS GETTING READY TO DROP.
ETHUSD has been moving bullish since July 8. However since July 21 the price started to form the bearish wedge with bearish divergence on RSI on 4-h timeframe.
A bearish wedge is a bearish reversal pattern in an uptrend, where the price forms higher highs and higher lows within converging upward trendlines, signaling weakening bullish momentum and a potential downward reversal. To trade, identify the wedge with declining volume and confirm with RSI or divergence. Sell or short on a breakdown below the lower trendline with a volume spike. Set a stop-loss above the recent high or upper trendline. Target the wedge’s height projected downward from the breakdown or the next support level with a 1:2 risk-reward ratio.
We expect that the price will establish another bullish momentum and the price will go towards upper border of the wedge, slightly below the 4,100.00 resistance level and will decline towards 3,500.00 support level afterwards.
GOLD (XAUUSD) Short IdeaGold is in consolidation right now. Possible break below and fall until 3285.
Good Luck!

Nasdaq Short: multiple reasonsOver here, I present to you the Nasdaq short idea again. For my previous idea, it was stopped out at 23500. This time, I changed the wave counts again, mainly merging the previous wave 5 into wave 3, allowing for the new high to be a wave 5.
On top of that, here are the few other reasons for the short:
1. Fibonacci extension levels: Wave 5 is slightly more than Wave 1.
2. RSI overbought for the 3rd time on the hourly timeframe.
3. Rising wedge false breakout.
4. Head-and-shoulders on the 1-min timeframe.
As usual, the stop for this idea is slightly above the recent high, around 23700.
Thank you.

$BTCUSD, rally into rate cuts?BITSTAMP:BTCUSD has been coiling for some time now in a right angled descending broadening wedge.
A measured move of this cone so far would place BTC at right around ~$100k.
This aligns well with historical performance of BTC heading into a cutting cycle. If we rally into September and have a selloff following the cuts (sell the news), I wouldn't be shocked. This is a pattern that has happened in multiple years of the previous QE/QT Cycle (2016/2017, 2019/2020).
The real fireworks will be in 2025 if things go according to the FED's schedule


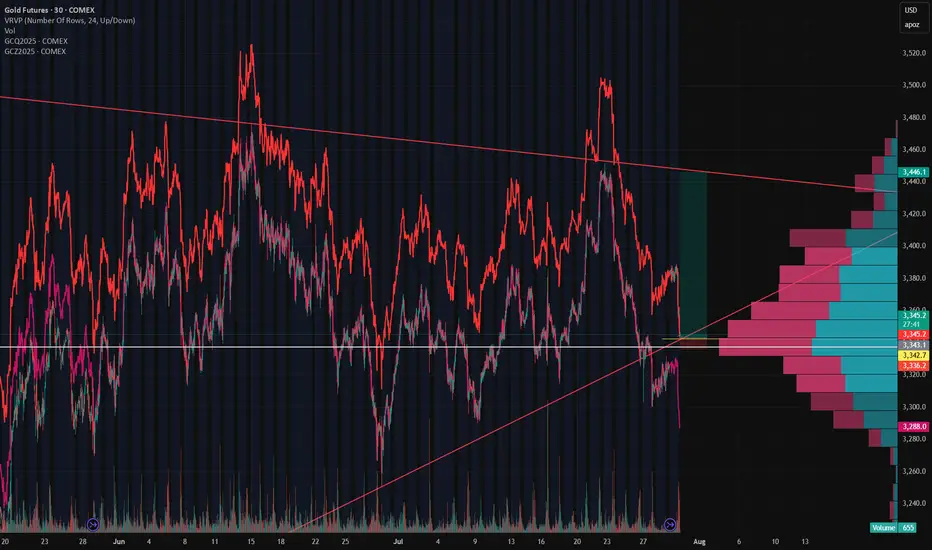
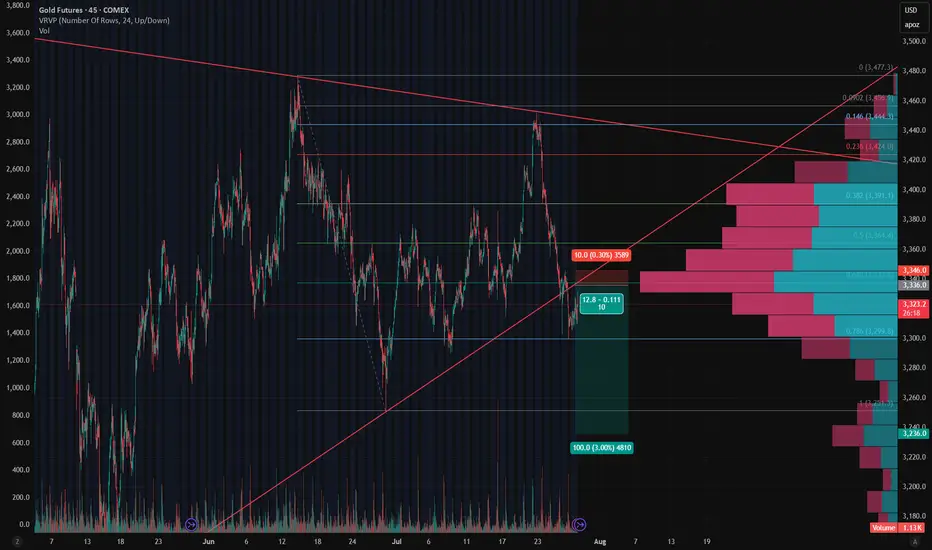
GC1! – The Wedge Strikes BackGC1! – The Wedge Strikes Back 🚀
Gold futures (GC1!) just gave us a textbook rollover move. As the front-month rolled, price faked a wedge breakdown, only to rip back inside the structure once rollover completed. That failed breakout speaks volumes – and now the wedge is back in control.
Rollover Trap → Back Inside the Wedge
Rollover volatility flushed price below the wedge, pulling in shorts… but the move didn’t stick. Buyers stepped up and snapped price back inside, turning the wedge’s lower boundary into rock-solid support once again.
The Long Game 🎯
With GC1! holding the wedge:
Longs off wedge support are the play
Resistance: 3,380
Target: 3,446 (upper wedge boundary)
Stop-loss: 3,336 (below support)
Risk/Reward: 🔥 10.69 RRR
Volume Profile also shows heavy accumulation in the 3,336–3,380 zone – crack through 3,380, and we could see momentum accelerate quickly.
Bottom Line
This isn’t just another bounce – it’s a failed breakdown on rollover. Wedge traders are back in the driver’s seat, and the setup offers a crystal-clear invalidation point with serious upside potential.
USDJPY Setup: Prime Buy Zone with a Clear Target!Good morning my friends,
I've prepared a fresh USDJPY analysis just for you.
Currently, the most logical buy zone sits at 147.170. If price reaches this level and performs a retest, it’s likely to target the 149.185 level.
I'll personally be entering at 147.170 and waiting for my target: 149.000.
This setup is based on the 4-hour timeframe, so it may take some time to reach the target.
Every single like you give is a major source of motivation for me to keep sharing these analyses.
Thanks so much to everyone supporting with a like!

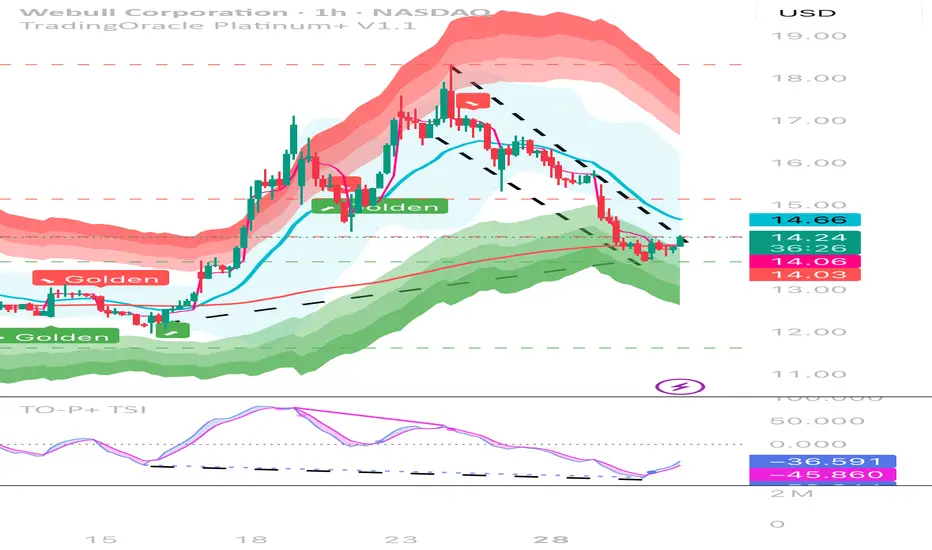
Hidden Bullish Divergence Bull is in a falling wedge patter while also making lower lows on the 1hr while making higher lows on the true strength index indicator. It is also bouncing off the 200ma, the bottom bollinger band, and the first reversal zone.
Break down to major support levelHere we have an expanding bearish wedge forming beautifully. My target is based off the 5 minute chart and a bullish order block.
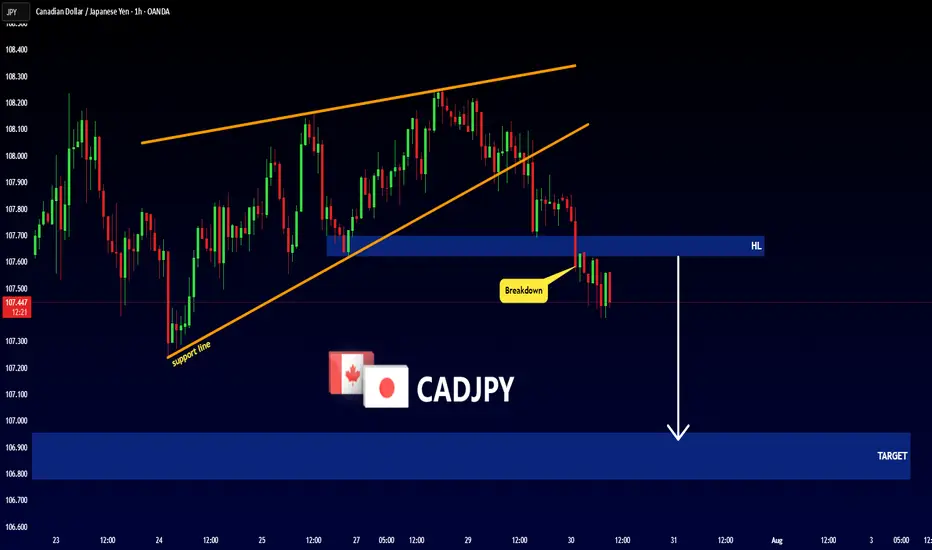
CADJPY - Bearish Rising WedgeHello Traders !
The CADJPY price formed a rising wedge pattern.
Currently, The support line is broken!
So, I expect a bearish move📉
_______________
TARGET: 106.955🎯
Wedge Pattern — A Key to Trend Movements📐 Wedge Pattern — A Key to Trend Movements 📈
🔍 Introduction
The Wedge is a chart pattern that represents a phase of directional consolidation following a trending move. It can act as a continuation 🔄 or a reversal 🔃 signal, depending on the context. The structure consists of two converging trendlines, both sloping in the same direction.
🧩 Pattern Description
Unlike the Flag pattern 🚩, the Wedge has no flagpole and doesn’t depend on the direction of the previous move. The direction of the wedge body determines its type:
A falling wedge ⬇️ is bullish 🟢 (buy signal)
A rising wedge ⬆️ is bearish 🔴 (sell signal)
The breakout is the key point to watch. The two trendlines slope in the same direction but at different angles, causing them to converge. This reflects a loss of momentum ⚠️ and typically indicates that buyers or sellers are preparing to take control.
This pattern can act as:
A continuation signal 🧭 — appearing at the end of a correction
A reversal signal 🔄 — forming at the end of a strong trend
📉 Volume is usually low during the wedge and rises on breakout. A low-volume breakout increases the risk of a false breakout ❗. Often, price retests the breakout level 🔁, giving traders a second chance to enter.
🎯 Entry & Stop-Loss Strategy
📥 Entry: On breakout confirmation
🛑 Stop-loss: Below the pattern’s low (bullish) or above its high (bearish), or under/above the most recent local swing point
🎯 Target: Project the height of the widest part of the wedge from the breakout point. Alternatively, use key price levels 📊 or a trailing stop 🔂 to lock in profits.
💡 My Pro Tips for Trading the Wedge
✅ Pattern Criteria
Two converging trendlines ➡️➕➡️
Clearly defined structure ✏️
Prior trending move before the wedge 🚀
Low volume within the wedge 📉, high volume on breakout 📈
Retest of breakout level = confirmation 🔁
🔥 Factors That Strengthen the Signal
Breakout on strong volume 📊💥
Appears after an extended trend 🧭📉📈
More touches = stronger pattern ✍️
Breakout occurs close to the apex 🎯
⚠️ Factors That Weaken the Signal
Low volume on breakout 😐
Poorly defined trendlines 🫥
Few touches on lines
Early breakout (too far from apex) ⏱️
No prior trend / appears in a range-bound market 📏
✅ Examples of My Successful Wedge Trades
📸
❌Examples of Failed Wedge Overview
💥
💬 Do you use the wedge pattern in your trading?
It’s a powerful pattern, especially when confirmed by volume and market structure. Share your favorite wedge setups or ask questions below 👇👇
Gold - Short Setup Off Major Trendline Rejection📉 Gold - Short Setup Off Major Trendline Rejection
Gold has broken down through the rising trendline and is now retesting it — the moment of truth! 🧐
🔻 Short Entry: 3,336
🎯 Target: 3,236 (Fib 1.0 + HVN gap fill)
🛑 Stop: 3,346 (Above trendline retest)
⚖️ Risk/Reward: ~1:10
📊 Bonus: High volume node above adds resistance. Bearish volume profile structure confirms the breakdown bias.
Watching for volume to pick up on the move down. Let's see if GC bleeds into August. 🩸📆
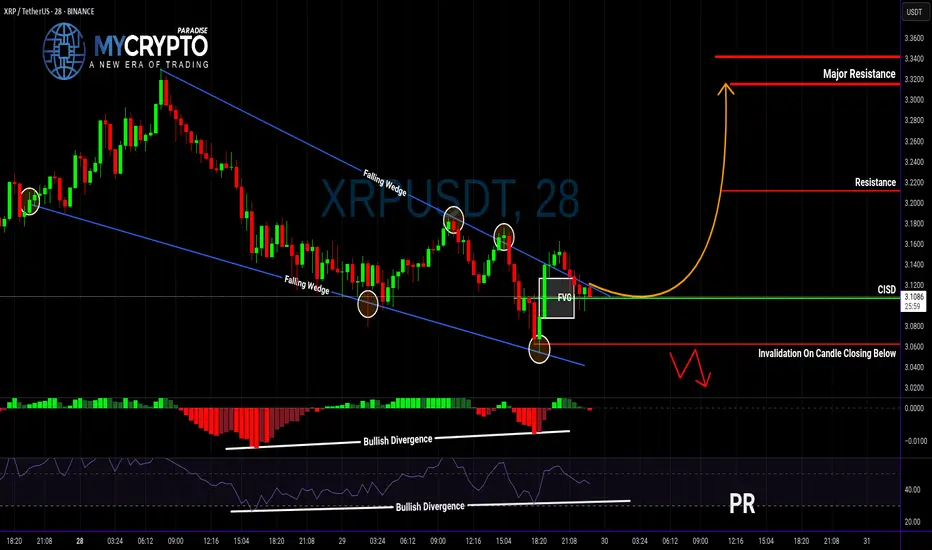
XRP Breakout Could Be a Trap… Or the Start of Something Big?Yello, Paradisers — are you about to buy into a fake breakout or position yourself right before a major move? Let’s break it down before emotions take over.
💎XRPUSDT has officially broken out of a falling wedge — a classic bullish reversal structure. What makes this breakout even more interesting is that it's supported by bullish divergence on both MACD and RSI, plus a Change In State of Delivery (CISD). All these technical signals combined significantly increase the probability of a bullish continuation.
💎Now, if you’re a disciplined trader looking for a safer entry with a higher risk-to-reward ratio, the smart move is to wait for a potential pullback to the CISD level. That would set up an opportunity offering a risk-to-reward of over 1:2.55 — not something you want to ignore.
💎But don’t get too comfortable…
💎If the price breaks down and closes below our invalidation level, the entire bullish idea is off the table. In that case, it’s wiser to stay patient and wait for clearer price action to develop. No emotional entries — only strategic moves.
🎖Strive for consistency, not quick profits. Treat the market as a businessman, not as a gambler. That’s how you’ll get inside the winner circle.
MyCryptoParadise
iFeel the success🌴
USDJPY Rising wedge on FX:USDJPY pair
Key level to watch is 150 where multiple failed breakout attempts were recorded.
Confirmed breakout will push price to 152-156
