HOOD daily chart: breakout or fakeout? Key zone approaching.Robinhood's stock has formed a falling wedge pattern on the daily chart, indicating a potential bullish reversal. The price has broken above the 0.618 Fibonacci level at $44.00, suggesting further upside potential. Next targets are $48.40, $52.79, $58.22, and $67.00. RSI and MACD indicators confirm bullish momentum.
Fundamental Factors:
Robinhood continues to show revenue and profit growth, supporting positive investor sentiment. The company is expanding its services and attracting new users, strengthening its market position.
Scenarios:
Main scenario: continued rise to $48.40, then to $52.79 and higher.
Alternative scenario: pullback to $39.71 with potential decline to $36.00.
Wedge

AUDCAD: More Growth Ahead?! 🇦🇺🇨🇦
AUDCAD bounced strongly after a test of a significant daily/intraday support cluster.
The price managed to violate a resistance line of a falling wedge
pattern and close above that on an hourly time frame.
I expect a movement higher at least to 0.8944
❤️Please, support my work with like, thank you!❤️

Bitcoin may correct a little and then continue to grow in wedgeHello traders, I want share with you my opinion about Bitcoin. The price has been moving confidently inside an upward wedge structure, which often signals a continuation in strong bullish trends but also warns of potential exhaustion if momentum fades. In this case, the wedge is forming after a clear impulse move and is supported by a solid base at the buyer zone. Multiple impulses from this level and consistent support at the current support zone have pushed the price higher, with bullish momentum now clearly in control. After a breakout from the previous resistance zone and a clean retest of the support area, the price started a strong rally. This move aligns well with the wedge formation, where both trend lines are narrowing upward, indicating that buyers are pushing steadily higher while sellers are becoming more aggressive, a setup that often leads to an explosive breakout if the resistance is breached. Now BTC trades above 93700, consolidating slightly below the wedge resistance line. Based on the wedge geometry and the strong impulse structure that preceded it, I expect the price to continue growing and test the 100000 level, which aligns perfectly with the upper wedge boundary and serves as my TP 1. Please share this idea with your friends and click Boost 🚀

DOGE Bulls Wake Up ! Major Breakout Setup You Shouldn’t Miss Hello Traders 🐺
Hope you're doing well!
We’re back with another idea — this time a clean trade setup on DOGE, so make sure to read this one all the way through 👇
As you can see on the chart, price is currently breaking above the descending channel, which forms our falling wedge resistance line — a bullish signal so far. But we need to pay close attention to the next key resistance area around $0.19460, which lines up with the previous high and the red resistance zone.
🔹 So, What’s the Plan?
You’ve got two solid options:
✅ Wait for confirmation.
Look for a clear breakout and at least two 4H candles closing above the resistance line. If price then retests that line as new support, it’s a good spot to enter a long position.
🎯 Stop-loss: Just below the current low at $0.12500
🎯 Target: The top of the wedge — which makes sense, since it also lines up with a heavy resistance zone.
📌 Don’t forget to take partial profits near the top and move your stop-loss to breakeven to secure the trade!
And as always, remember our golden rule:
🐺 Discipline is rarely enjoyable, but almost always profitable. 🐺
🐺 KIU_COIN 🐺

#BTC Dominance Update – Key Levels in Play!🚀 Hey Traders! 👋
If you’re finding value in this analysis, smash that 👍 and hit Follow for high-accuracy trade setups that actually deliver! 💹🔥
Bitcoin dominance ( CRYPTOCAP:BTC.D ) is trading inside a beautifully defined rising channel on the 4H chart.
📈 What’s unfolding?
✔ Strong support holds at the lower channel line (marked by green arrows)
✔ Bounce potential toward the upper channel resistance (~65%)
✔ Expect possible rejection there, followed by another retest of support
💥 Why this matters:
✅ BTC dominance drives altcoin sentiment
✅ Rising dominance → pressure on altcoins
✅ Watch for a breakdown below support → potential altcoin relief rally
⚙ Key Takeaway:
Monitor this channel carefully. If dominance breaks below support, alts could gain momentum. If it bounces, BTC will continue to lead.
💬 Drop your thoughts in the comments — are you betting on BTC or alts next? 🚀👇

AUDCHF is having Rising WedgesRising wedges on audchf, if break the neckline then we may see further drop to the nearest support

Morning Star To Wake GU TradersFX:GBPUSD has fallen into a Wedge Pattern after breaking Mondays Highs!
Price this morning has seemingly found Support at the 50% Retracement level signaling the potential ending of the Consolidation phase of the Wedge!
This Retracement comes in the form of a Morning Star, a strong Triple Candle Reversal Pattern!
If Price is supported in this area, we could see a Bullish Break to this Pattern delivering a Long Opportunities as a Break and Retest Set-up!

USDCHF set for big move? Fed meeting could trigger breakoutUSDCHF is stuck in a tight range ahead of today’s Fed meeting, with technical patterns pointing to a possible breakout. A dovish Fed could trigger a move toward 0.8872 or lower, with risk-reward setups as high as 11:1.
This content is not directed to residents of the EU or UK. Any opinions, news, research, analyses, prices or other information contained on this website is provided as general market commentary and does not constitute investment advice. ThinkMarkets will not accept liability for any loss or damage including, without limitation, to any loss of profit which may arise directly or indirectly from use of or reliance on such information.

VIRTUALUSDT → Rebound from resistance. Trend break, U-turn?BINANCE:VIRTUALUSDT.P is pausing within an uptrend and forming a range within which signals of a possible reversal and decline are appearing.
Bitcoin is pausing its rally and moving into correction. This is a negative development for altcoins, which will not grow without the flagship.
VIRTUAL is consolidating, but pressure is building in the market (as can be seen from the cascade of resistance levels within the range). Another prerequisite for a breakdown of the market structure is a downward exit from the upward channel (a break of the trend support). Another retest of support at 1.581 could trigger a breakout and a fall. There is a fairly free zone below, and the nearest target is located in the 1.178 zone.
Resistance levels: 1.72, 1.829
Support levels: 1.581, 1.416, 1.178
Focus on the current range of 1.581 - 1.829. The chart shows that the price continues to storm and test support, which is an important signal against the backdrop of a broken uptrend. A break of support at 1.581 and consolidation below this level could trigger liquidation and a fall to the fvg zone or the liquidity zone at 1.178.
Best regards, R. Linda!

XRPUSDT on the Edge: Is a Major Breakdown Coming? Yello Paradisers! Are you ready for what could be a huge bearish trap unfolding right now on XRPUSDT?
💎Currently, XRPUSDT is flashing serious warning signs. The formation of a rising wedge pattern is significantly increasing the probability of a bearish move. When analyzing the broader market structure, it appears this recent uptick is merely a retracement within the larger bearish trend—keeping the probability on the bearish side still very high.
💎If XRPUSDT bounces, grabs liquidity and starts forming clear bearish patterns from that resistance area, it could set up an excellent opportunity with a high risk-to-reward (RR) ratio for shorts.
💎However, if the price breaks out and closes a candle clearly above the resistance zone, our bearish thesis will be invalidated. In that case, it would be much smarter to stay patient and wait for a more reliable price action setup before considering any new trades.
🎖Remember Paradisers, the key to surviving and thriving in this market is to stay disciplined, patient, and smart. Trade what you see, not what you feel! Stick to the plan, and never rush decisions under emotional pressure. Play it safe, and stay focused—our time will come!
MyCryptoParadise
iFeel the success🌴

USDJPY: Pullback From Support 🇺🇸🇯🇵
There is a high chance that USDJPY will pull back from the underlined blue support.
AS a confirmation, I see a violation of a resistance line of a falling
wedge pattern on an hourly time frame.
Target - 144.35
❤️Please, support my work with like, thank you!❤️

AUDNZD (4H) Symmetrical Triangle Breakout+Falling Wedge ReversalOn the 4-hour chart of AUDNZD, the market has completed a compression phase inside a symmetrical triangle, nested within a larger falling wedge structure. Both patterns suggest a potential bullish reversal after an extended downward trend.
The breakout occurred to the upside, with price moving above the triangle and breaking through short-term resistance around 1.0713. Volume increased on the breakout, confirming genuine buyer interest. If the price holds above this level and breaks 1.0766, it opens the path to the next major target at 1.0844, aligned with the previous key swing level.
Technical picture:
– Symmetrical triangle breakout confirmed
– Price also broke out of the falling wedge
– Volume expansion on the move
– Bullish realignment of EMAs is starting
– Holding above 1.0713 + breaking 1.0766 will activate the next phase
Fundamental backdrop:
The Australian dollar is benefiting from resilience in the commodity and export sectors, while the New Zealand dollar faces pressure from weakening inflation and growing expectations of monetary easing by the RBNZ. This economic divergence creates short-term advantage for AUD over NZD.
This double-pattern setup confirms the transition from consolidation to bullish impulse. Holding above 1.0713 and a confirmed break above 1.0766 would unlock a move toward 1.0844. These patterns offer clean early entries into trend reversals.

Gold Breaks Wedge, 3270–3280 Now Key Pivot for RecoveryGold's recent retreat has slowed, forming a descending wedge pattern that has now been broken. This is a constructive setup for a potential upward reaction after falling $300 from the $3,500 high. The 3,270–3,280 zone is now the short-term pivot point. If this level breaks as well, the upward move may finally begin.
Potential targets include the 38.2% retracement level at 3,316 and the main resistance zone at 3,355–3,370.

Gold’s Got Its Groove Back: Morning Star Lights the Way to $3500Gold delivered a powerful signal pointing to a resumption of the bullish trend, completing a morning star pattern that saw it break out of the falling wedge it had been trading over the past fortnight. It would have been nice to catch the initial move, but all is not lost after the price broke above $3367 on Tuesday.
The price has run hard, so I’m reluctant to chase the move. But if we see a pullback and bounce from $3367, it would generate a bullish setup where longs could be established above the level with a stop beneath for protection. The obvious trade target would be the record high of $3500 set in April.
If the price were to reverse below $3367 and stay there, the setup would be invalidated.
Good luck!
DS

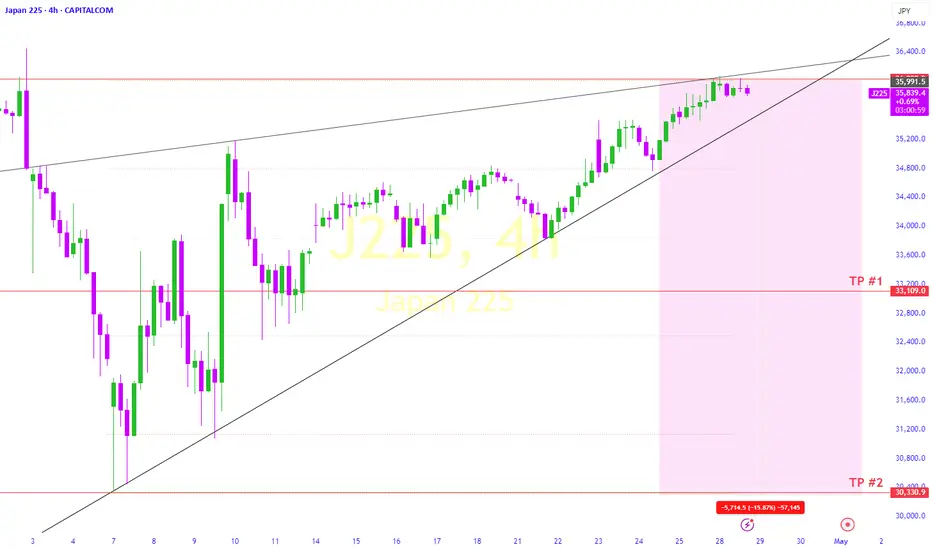
Formation of the Wedge Pattern in the Japanese Index.The formation of a wedge pattern in the Japanese stock index has raised concerns among investors, as it often signals potential volatility and market correction.
A wedge pattern typically occurs when the price movement narrows between converging trend lines, indicating indecision among traders.
In the context of the Japanese stock market, this pattern can be particularly telling, as it suggests that the index may be reaching a critical juncture. Recent trends have shown a gradual decline in the index, which could lead to a significant downturn if the wedge breaks downward.
Investors should remain vigilant, as a sustained drop in the index could trigger broader market reactions and impact investor sentiment. Monitoring key economic indicators and geopolitical developments will be essential in navigating this precarious phase. As the situation unfolds, prudent risk management strategies will be vital for those looking to mitigate potential losses in a fluctuating market environment.
UJ Impulse Wave 5 IncomingFX:USDJPY seems to have finished Wave 4 being a Correction Wave of the Elliot Wave Theory and looks to be prepping for the start of Wave 5 being an Impulse Wave!
Now Price has not only made a 38.2% Retracement to 143.6 of the 145.941 Swing High that ended Wave 3 but is testing Break of Previous Structure being Past Resistance attempting to turn it into Support if enough Buyers enter the market in this opportune area.
Price Action during the Correction of Wave 4 has formed a Falling Wedge Pattern, typically seen as a Continuation Pattern. For this to be fact, we will need to see a Bullish Breakout to the Falling Resistance followed by a successful Retest of the Break where the Long Opportunities should present themselves.
Once Wave 5 is confirmed, we can expect Price to work from here and potential reach the Potential Range Target of ( 148.662 - 150.245 )

Wajani Investments: Wheat analysisWheat has formed a very strong Head and Shoulder with a bearish wedge or descending triangle . This can be seen from both monthly, weekly and daily timeframes. All these points to lower prices in the weeks ahead. In this market you can risk a 1:3
Remember to always adapt or make changes as the market changes.
Let me know your thoughts.

Bitcoin Ascending Broadening Wedge (4H)After a clean breakout above the macro downtrend, BINANCE:BTCUSDT rallied into its supply zone — but price action has since become increasingly volatile, forming a rising broadening wedge (also known as a megaphone pattern).
Pattern Insights
• The structure is defined by diverging trendlines, with each swing becoming larger and more erratic.
• This pattern often signals instability or exhaustion, especially near key resistance.
• While it can break either way, broadening wedges in an uptrend frequently resolve to the downside, especially when supply is overhead.
Key Levels
• Resistance: ~$ 98K-$99.5k supply zone — the upper boundary of the pattern.
• Support: ~$93.5k area — prior S/R, potential flip zone.
• Reversal: A breakdown below ~$93k could confirm a short-term bearish resolution and open the door to ~$88.5k.
• Continuation: A breakout above the upper boundary with volume could trap shorts and ignite a squeeze toward new highs.
Until then, BTC remains in a high-volatility structure, best approached with caution or as a range-trading opportunity.

EURCHF new bearish push expecting
OANDA:EURCHF FALLING WEDGE we are have, in moment its be breaked, price is also be and on trend line with FW, i am expect price will continue pushing, but looks like we will have break of trend line and bounce on sup zone 0.93950
SUP zone: 0.94000
RES zone: 0.92450, 0.92000

$COST Rising WedgeCost perfectly tagged the upper line of the rising wedge that we have seen play out over the past couple of weeks. I opened some puts at the top today in hopes that it breaks to the downside of this wedge for a target around $900. This would also complete the right shoulder of H&S on daily chart.

Uj might be reversing- We are at a painfully large demand area.
- Price squeezing and consolidating in a dropping wedge.
- Thursday candle was a bullish harami (indicating a possible u-turn)
- Friday was the Good Friday (Market holiday), so it doesn't count
Let us patiently wait here for the price to either break the wedge or at least it hits the lower border of the wedge to place our first entry. The reversal is imminent provided we do not break the demand area. Patience is the key here.
Once we have a full confirmation to buy we will look further for targets, till then just watch it.
I will update you guys when I place my own entry. Pray hard, trade smart :) and best of luck!
Here is the close up look of the wedge:

Ishares 20+ Year Treasury Tumble with -15% crash ??On the above monthly chart price action has seen a nice 25% rise since November 2023. A number or reasons now exist to be bearish.
Incidentally, with all the recently published ideas on Tradingview, Without Worries appears to be the only one who is bearish.
The reasons?
1) Broken market structure confirmation.
2) Active price action resistance.
3) Rising wedge. A breakdown confirmation will see price action correct 17%.
4) $76 is the next support level, which is incidentally the measured move forecast by the bearish wedge identified in (3).
Is it possible price action continues to rise as most of Tradingview is calling for? Sure
Is it probable? No.
Ww
